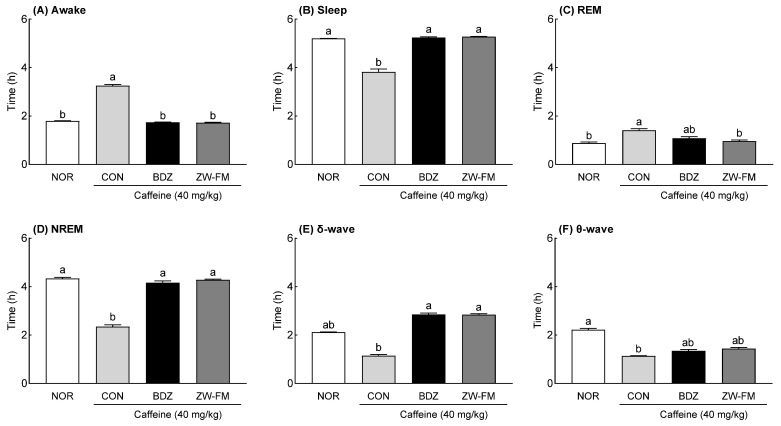
Figure 7.
Effect of ZW-FM on REM and non-REM sleep in caffeine-induced insomnia model at the indicated concentration. Graphs indicate wake time (A), sleep time (B), REM (C), NREM (D), δ wave (E), and θ waves (F) in indicated groups. Data are presented as means ± standard error of the mean (n = 6). Different letters (a,b) indicate significant differences at p < 0.05 using Tukey’s test. NOR, normal group; CON, caffeine (40 mg/kg) control group; BDZ, benzodiazepine (0.2 mg/kg)-treated group; ZW-FM: fermented product of ZW-EH -treated group.

