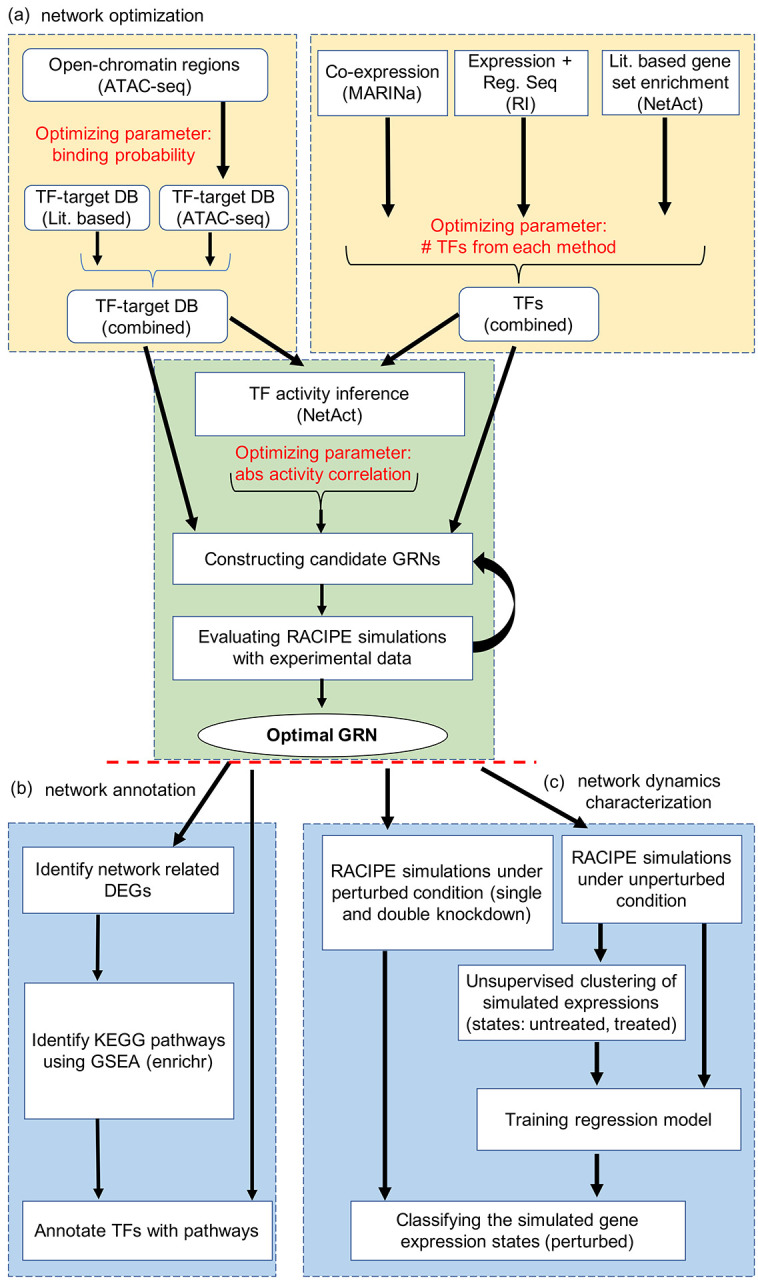
Figure 1. Illustration of the computational framework for gene regulatory network modeling.

(a) Procedures for gene regulatory network (GRN) optimization. The top left block shows the steps to construct TF-target databases (DB) using a literature-based TF-target DB and the TF-target relationships inferred from ATAC-seq data. The top right block shows the approach of TF inference using three distinct computational methods: VIPER, RI regression, and NetAct. The bottom block shows the steps to construct GRN candidates using the TF-target databases and TF activities. Many candidate GRNs are constructed by varying three adjustable hyperparameters, as highlighted in red color. Network optimization is then applied to identify the optimal GRN that best captures experimental gene expression states according to GRN simulations by RACIPE. (b) Network modeling analysis. Using the GRN-related differentially expressed genes (DEGs), we identify enriched KEGG biological pathways and the best representative pathways associated with each network TF (left block). In silico network perturbation analysis can be further performed to identify key regulators of the network driving state transitions (right block).
