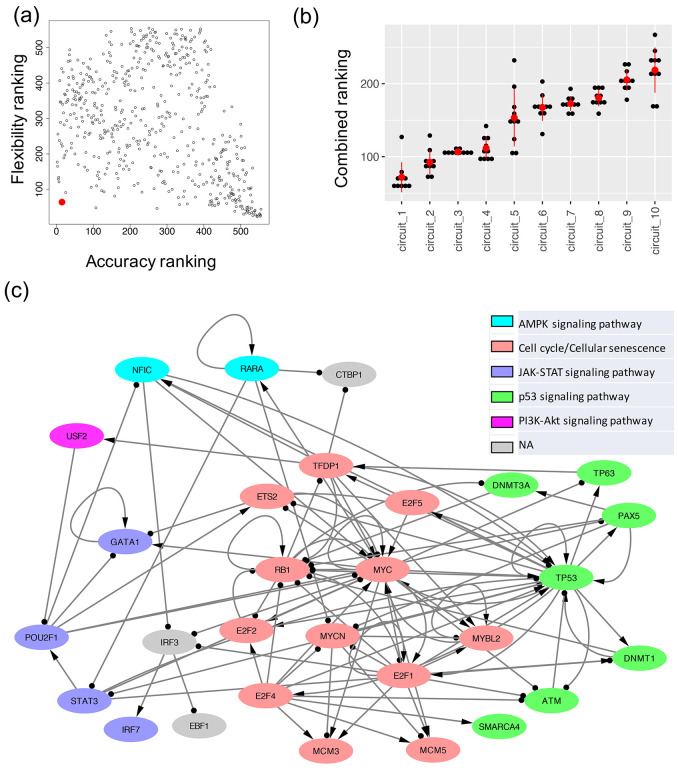
Figure 4. The optimal GRN of leukemogenesis in IDH mutant AML.
(a) A scatter plot showing the accuracy ranking (x-axis) and flexibility ranking (y-axis) for a total of 532 GRN candidates. The optimal GRN is marked with the red enlarged dot. (b) Convergence of the top ranked networks. Distribution of the combined scores (sum of two rankings, one based on accuracy and the other based on flexibility) for the top ten GRNs obtained from the ten repeats of 10000 RACIPE simulations for each circuit. The red dot and the vertical bar are mean and standard deviation of the distribution for each circuit. A two-sided t-test shows that the scores for the top ranked GRN is significantly different from those of the other GRNs. (c) The diagram of the optimal AML GRN of enriched TFs. Transcriptional activation is annotated by a line with arrowhead; transcriptional inhibition is annotated by a line with circle head. The colors of the gene nodes represent the most representative KEGG biological pathways. The coupling of biological pathways is shown in Fig. S2.

