
Figure A1:
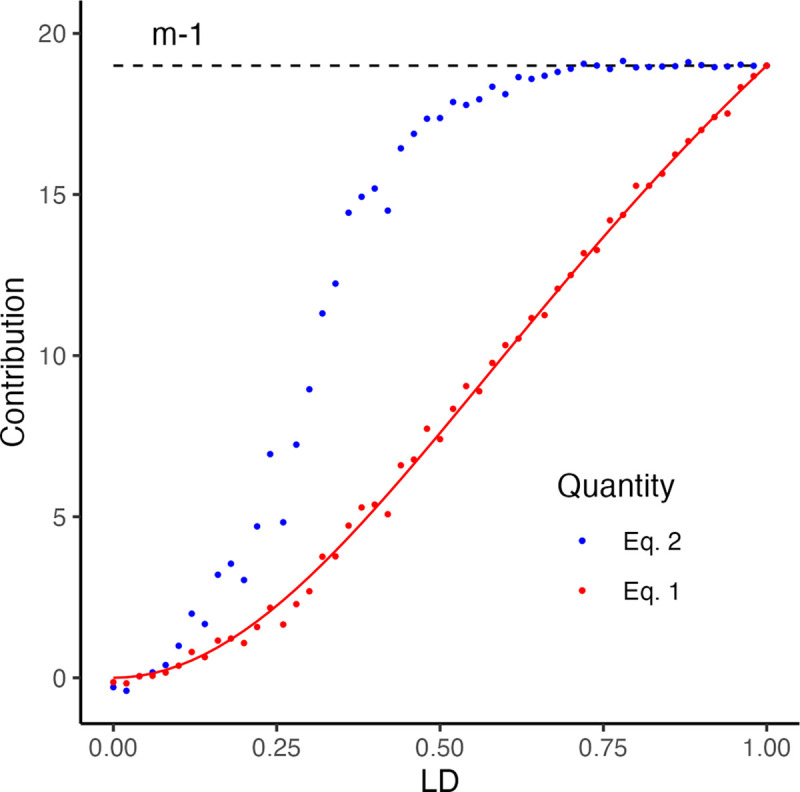
The behavior of the LD contribution (y-axis) to the genetic variance (red) and the Haseman-Elston regression estimate (blue) as a function of LD, i.e. (x-axis). Each point represents the contribution calculated from a random draw of genotypes, given . The red line represents the expected LD contribution and the black dashed line represents the contribution expected in the case of perfect LD.