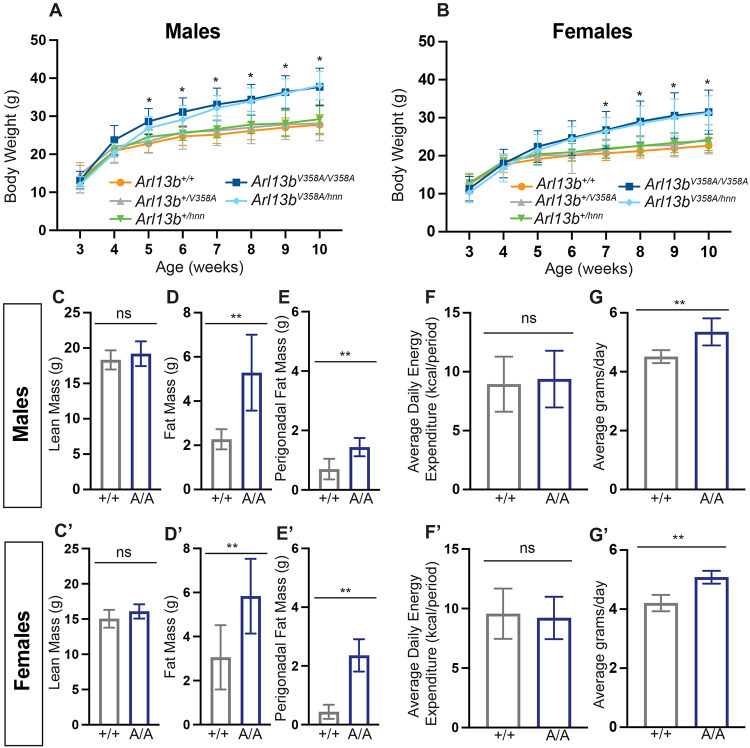
Figure 1: Arl13bV358A/V358A mice become obese.
(A-B) Mice maintained on breeder chow diet were weighed weekly from 3 to 10 weeks of age. Body weights of Arl13b+/+ (males n=14 and females n=13), Arl13b+/V358A (males n=22 and females n=22), Arl13+/hnn (males n=10 and females n=9), Arl13bV358A/V358A (males n=24 and females n=26), and Arl13bV358A/hnn (males n=15 and females n=17). Repeated measures ANOVA, *p < 0.01. (C-C’, D-D’) Lean mass and fat mass were measured using EchoMRI (n ≥ 5 per group). (E-E’) Perigonadal fat pads were isolated and weighed in 10-week-old mice (n=7 per group). (F-F’) Energy expenditure was analyzed by CalR ANCOVA, with body weight included as a covariate (n ≥ 5 per group). (G-G’) Food intake was measured daily from week 4 to week 5 (males Arl13b+/+ n=10 and Arl13bV358A/V358A n= 10; females Arl13b+/+ n=10 and Arl13bV358A/V358A n=10). Wild type (+/+), Arl13bV358A/V358A (A/A). Error bars represent standard deviation.

