

SUMMARY
The enthesis, a fibrocartilaginous transition between tendon and bone, is necessary for force transfer from muscle to bone to produce joint motion. The enthesis is prone to injury due to mechanical demands, and it cannot regenerate. A better understanding of how the enthesis develops will lead to more effective therapies to prevent pathology and promote regeneration. Here, we used single-cell RNA sequencing to define the developmental transcriptome of the mouse entheses over postnatal stages. Six resident cell types, including enthesis progenitors and mineralizing chondrocytes, were identified along with their transcription factor regulons and temporal regulation. Following the prior discovery of the necessity of Gli1-lineage cells for mouse enthesis development and healing, we then examined their transcriptomes at single-cell resolution and demonstrated clonogenicity and multipotency of the Gli1-expressing progenitors. Transplantation of Gli1-lineage cells to mouse enthesis injuries improved healing, demonstrating their therapeutic potential for enthesis regeneration.
In brief
Repair of the tendon enthesis (e.g., after a rotator cuff tear) is a clinical challenge. To motivate novel cell-based treatment strategies for enthesis repair, Fang et al. define enthesis cell transcriptomes and differentiation trajectories. A unique enthesis Gli1+ progenitor population is identified and delivered to injured entheses to enhance healing.
Graphical Abstract

INTRODUCTION
Tendon connects to bone via a specialized interface known as the enthesis.1 Enthesis disorders, including rotator cuff disease, psoriatic arthritis, and spondylarthritis, are prevalent and result in a heavy clinical burden.2,3 The healthy enthesis is a functionally graded tissue that bridges unmineralized tendon and mineralized bone and is formed and maintained by a spatially graded distribution of cell phenotypes.4,5 The functionally graded tissue, necessary for reducing stress concentrations at the interface between two dissimilar materials, is not regenerated after enthesis degeneration or injury, resulting in a mechanically weak attachment and ultimately rupture.6,7 For this reason, failure rates after surgical repair of torn tendon to bone are remarkably high.8,9 Despite significant treatment advances over the past decade, the development of therapeutic strategies for regenerating the enthesis has been hampered by an incomplete understanding of enthesis development. In particular, it remains unclear how a spatial gradient in cell phenotypes across the enthesis drives the formation of a mineral gradient from tendon to bone. With the maturity of single-cell RNA sequencing (scRNA-seq) technology, it is now possible to evaluate the transcriptional signatures of the cell phenotypes across the enthesis at single-cell resolution.
Resident stem cells have been identified for bone (i.e., bone-marrow-derived mesenchymal stem cells [MSCs]) and tendon, but not for the enthesis. Bone-marrow-derived MSCs have been studied for many decades.10–13 More recently, tendon stem cells have been isolated and characterized, demonstrating typical stem cell features, including self-renewal capacity, clonogenicity, and multipotency.14 Due to a lack of distinct and reliable markers to identify tendon stem cells, their in vivo identity, contribution to tendon pathology, and translational application remain elusive.15 Cells expressing Gli1 (glioma-associated oncogene homolog 1, indicative of activated hedgehog signaling), have been proposed to function as progenitors residing in the tendon enthesis and in the epitenon.16,17 Our previous lineage-tracing experiments demonstrated that Gli1-lineage (Gli1+) cells build the tendon enthesis, and their ablation at early postnatal time points led to defects in enthesis mineralization and impaired biomechanical function.18 Furthermore, neonatal enthesis injuries showed excellent capacity to heal, and this process involved Gli1+ enthesis cells from the early postnatal period.19 Consistent with these findings, multiple studies have also demonstrated that Gli1+ cells form an essential niche in the colon by renewing stem cells, drive bone marrow fibrosis by activating cell expansion and myofibroblast differentiation, and regulate bone formation and fracture repair by differentiating into chondrocytes and osteoblasts.20–24 Gli1 therefore serves as a putative stem cell/progenitor marker with particular relevance to the enthesis. However, the characteristics of enthesis Gli1-expressing progenitors and their therapeutic potential have not been explored.
Herein, we revealed mouse enthesis cell heterogeneity and identified six cell subpopulations using scRNA-seq. We used two different algorithms for scRNA-seq analysis to infer cell differentiation trajectories for enthesis progenitors differentiating into mineralizing chondrocytes. A gene regulatory network analysis and fluorescence in situ hybridization (FISH) were then used to identify a number of transcription factors coordinating tenogenesis, chondrogenesis, and osteogenesis to form an enthesis with spatially graded mineralization. To further define the enthesis progenitor population, mouse enthesis Gli1+ cells were isolated, and their transcriptomes were characterized at single-cell resolution. These Gli1+ cells were shown to have colony formation capacity and multipotency. Finally, enthesis Gli1+ cells were transplanted into injured entheses and shown to promote more extracellular matrix deposition and increased mineralization than bone Gli1+ cells, demonstrating the specificity of enthesis Gli1-expressing progenitors and a promising therapeutic strategy for enthesis regeneration.
RESULTS
Single-cell transcriptomes of enthesis mesenchymal cells identify six distinct cell phenotypes
To capture single-cell transcriptomes of enthesis cells during the critical postnatal mineralization period, we isolated mouse supraspinatus tendon (SST) entheses from shoulders of C57BL/J6 mice at postnatal day 7 (P7), P18, and P56 and dissociated the enthesis cells for scRNA-seq analysis using the 10x Genomics platform (Figures S1A and S1B). After the elimination of doublets, dead, and apoptotic cells, 3,000–5,000 single cells with 61,990–106,444 reads/cell and 1,901–3,154 genes/cell for each time point passed quality control and were processed for downstream evaluation (Figure S1C). After data integration of different time points, dimensional reduction, and uniform manifold approximation and projection (UMAP) visualization using the Seurat V3 package, 7 distinct cell clusters were manually annotated according to differentially expressed genes and a set of marker genes (Figures 1A and S1D). Similarly, enthesis mesenchymal cells were selected and clustered with high resolution, and cell subpopulations were annotated as enthesis progenitors, pre-enthesoblasts, enthesoblasts, mineralizing chondrocytes, tenoblasts/tendon sheath cells, and osteocytes (Figure 1B). Tenoblasts/tendon sheath cells were defined based on their expression of Scx, Tnmd, Col1a1, and Bglap. A population of Bglap-expressing cells have been demonstrated to exist in the tendon sheath and contribute to tendon healing.17 Strikingly, the greatest percentage of mineralizing chondrocytes (normalized by the number of enthesis stromal cells) was observed at P18 compared with P11 and P56 (Figure 1C). This observation is consistent with previous research, which revealed active enthesis mineralization between P14 and P28.18,25,26 In contrast, the proportion of the other cell subpopulations remained steady across developmental stages (Figures 1C and S2A).
Figure 1. Categorization and transcriptomes of SST enthesis cells by scRNA-seq.
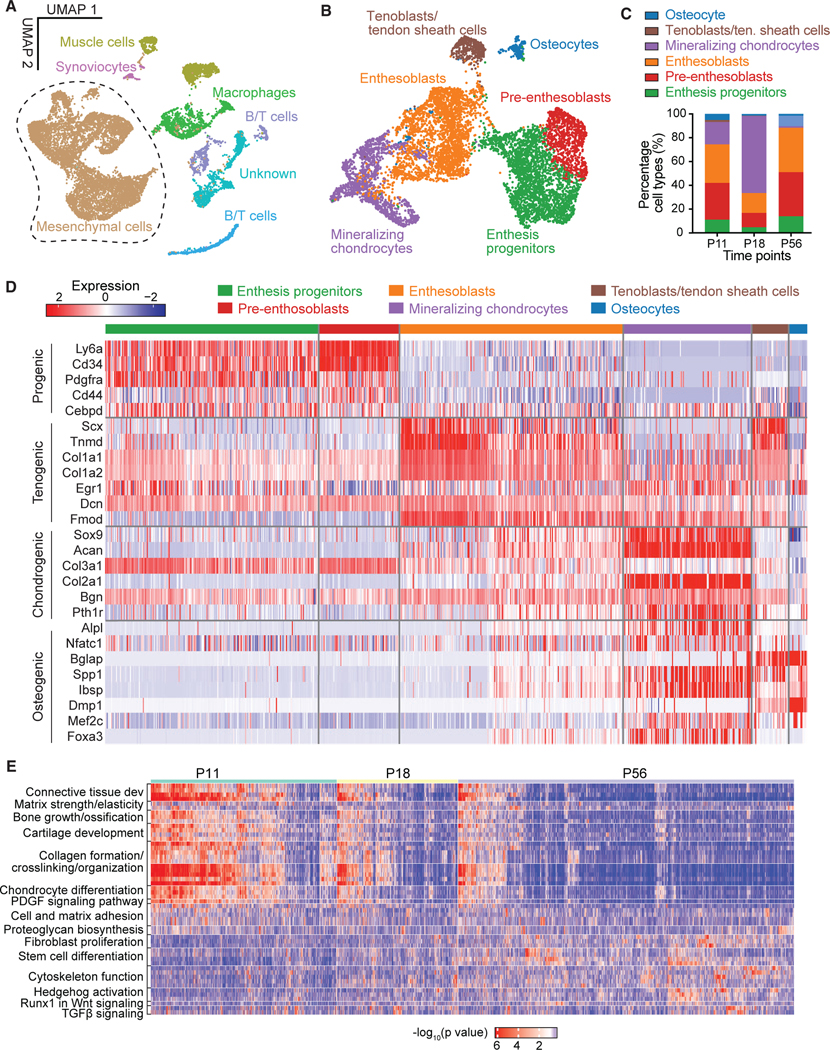
(A) UMAP plot of all cells integrated from tendon entheses at postnatal day 11 (P11), P18, and P56.
(B) Subsetting and further clustering of enthesis mesenchymal cells indicated by dashed outline in (A). Only this subset of enthesis cells was used for the subsequent analyses.
(C) Percentage of cell types for P11, P18, and P56. Tenoblasts/ten. sheath cells, tenoblasts/tendon sheath cells.
(D) Heatmap of enthesis mesenchymal cells, integrated from P11, P18, and P56, with columns representing each cell subpopulation and rows representing established maker genes for the particular cell types indicated on the left.
(E) Heatmap of biological processes at different time points.
Enthesis progenitors had relatively high expression of Ly6a, Cd34, Cd44, and Pdgfrα, in agreement with fibro-adipogenic progenitors previously found in tendon, bone marrow, muscle, and colon (Figures 1D and S2B).20,27–29 Pre-enthesoblasts were identified and defined based on their clear stem cell transcriptional signatures but at depressed levels relative to enthesis progenitors, particularly for stem cell maintenance and activated differentiation and transition (Figure S2D). A cell subpopulation co-expressing tenogenic (e.g., Scx, Col1a1) and chondrogenic markers (e.g., Sox9, Acan), consistent with previous reports of late fetal enthesis cells,30 were defined as enthesoblasts. We also identified signature profiles of mineralizing chondrocytes (e.g., Sox9, Acan, Col2a1, Alpl, Spp1, Ibsp), tenoblasts/tendon sheath cells (e.g., Scx, Tnmd, Col1a1, Nfatc1, Bglap), and osteocytes (e.g., Nfatc1, Bglap, Spp1, Dmp1). All cell subpopulations were actively expressing their corresponding signature genes and deactivating other listed gene sets at P18 (Figure S2B). To determine cellular functions across varied cell subpopulations or development stages, we then performed single-sample gene set enrichment analysis (ssGSEA). The biological processes matrix strength, bone growth, cartilage development, collagen formation, and chondrocyte differentiation were significantly more enriched at P11 and P18 compared to P56 (Figure 1E). The biological processes fibroblast proliferation, cytoskeleton function, stem cell differentiation, and Runx1 in Wnt signaling were significantly more enriched at P56 compared to the earlier time points. Enthesoblasts had the most enriched profiles of matrix deposition and tissue development (Figure S2E). These findings demonstrate six distinct enthesis cell populations in all enthesis mesenchymal cells at early postnatal time points that activate several biological processes to build and mineralize the enthesis.
Candidate regulators for enthesis progenitor cell differentiation and mineralization defined by SCENIC, FISH, and IHC
To determine the gene regulatory network that defines enthesis maturity and cell fate, we applied single-cell regulatory network inference and clustering (SCENIC),a gene regulatory network analysis, to the enthesis mesenchymal single-cell data.31 This analysis revealed that P11 and P18 enthesis cells had enriched transcription factor regulons related to tissue mineralization compared to P56 enthesis cells (i.e., Sox9, Runx2, Mef2a, Mef3c, Foxa3, and Nfatc1 regulons; Figure 2A). Consistent with this finding, expression of the master transcription factors for these regulons, such as Sox9, Mef2a, Mef2c, and Foxa3, were upregulated in mineralizing chondrocytes, particularly compared to tenoblasts/tendon sheath cells and osteocytes (Figure S2C), implying that the mineralizing chondrocytes were the major cell subpopulation responsible for enthesis mineralization. Interestingly, Cebpd and Myc regulons were upregulated at P56 compared with the earlier time points, implying their possible roles in driving enthesis maturity. The regulons and associated master transcription factors specific for stem cell maintenance and differentiation (i.e., Creb5, Bcl3, Egr1, Tcf4, and Creb3l1) were generally enriched for enthesis progenitors, pre-enthesoblasts, and enthesoblasts (Figures 2A, 2B, and S2C). The Creb3l1 regulon was enriched only in enthesoblasts, revealing a putative factor specific to enthesis development. This Creb3l1 regulon includes potential tenogenic target genes (e.g., Scx, Mkx, Tnc, Col1a1, Fmod) as binding sites for Creb3l1 (Figure 2B). Finally, SCENIC analysis also detected enriched Sox9 and Runx2 regulons underlying enthesis development and mineralization, in line with previous reports demonstrating essential roles for Sox9 and Runx2 in cartilage and bone development, respectively.32 The identification of the master regulators driving enthesis mineralization and maturity provides a rich set of hypothesis-generating results for future study. To corroborate the scRNA-seq findings and evaluate spatiotemporal expression levels of key representative genes in the enthesis, we performed FISH to examine mRNA of progenitor markers (i.e., Cebpd, Ly6a, Cd34) and osteogenic markers (i.e., Nfatc1, Mef2a, Runx2, Foxa3). Tendon enthesis sections were analyzed at P7, P18, and P56. Consistent with scRNA-seq results (Figure 2C), FISH demonstrated positive expression of these genes and revealed their spatial expression patterns (Figures 2D and S4). Cebpd expression was greater in the enthesis at P18 than at P7 and P56. In contrast, Ly6a expression showed low levels of expression across all three time points, whereas Cd34 expression increased with time. This contrasts with scRNA-seq analysis, which showed similar expression levels for Cd34, Ly6a, and Cebpd in enthesis progenitors and pre-enthesoblasts across time points. This may be due to the different approaches and normalization schemes; for FISH analysis, cell numbers positive for expression were normalized by the total number of enthesis cells, whereas scRNA-seq analysis compared gene expression levels for each cell subpopulation. Additionally, expression patterns of these progenitor markers were not dependent on enthesis region. For osteogenic markers, Nfatc1 expression was consistent across all time points, whereas Foxa3 expression increased with enthesis maturity. Of note, Mef2a and Runx2 expressions were more abundant at P18 than at P7 and P56, consistent with the greatest number of mineralizing chondrocytes at P18 (Figure 1C). As expected, osteogenic markers, such as Mef2a, Runx2, and Foxa3, were more highly expressed at the zones of mineralized fibrocartilage and bone than tendon. Consistent with FISH, immunohistochemistry (IHC) revealed that these cell populations were found at the SST enthesis, Achilles tendon (AT) enthesis, medial collateral ligament (MCL) femur enthesis, and MCL tibia enthesis (Figure S3). These entheses include a variety of anatomies and tissues: direct fibrocartilaginous SST, AT, and MCL femur entheses and indirect fibrous MCL tibia entheses. Notably, the MCL tibia enthesis, which is fibrous and distinct from the fibrocartilaginous entheses, showed higher expression of Scx and Runx2, implying different aspects of fibrous compared to fibrocartilaginous entheses.
Figure 2. Identification of candidate regulators for enthesis development and mineralization using single-cell network inference and FISH.
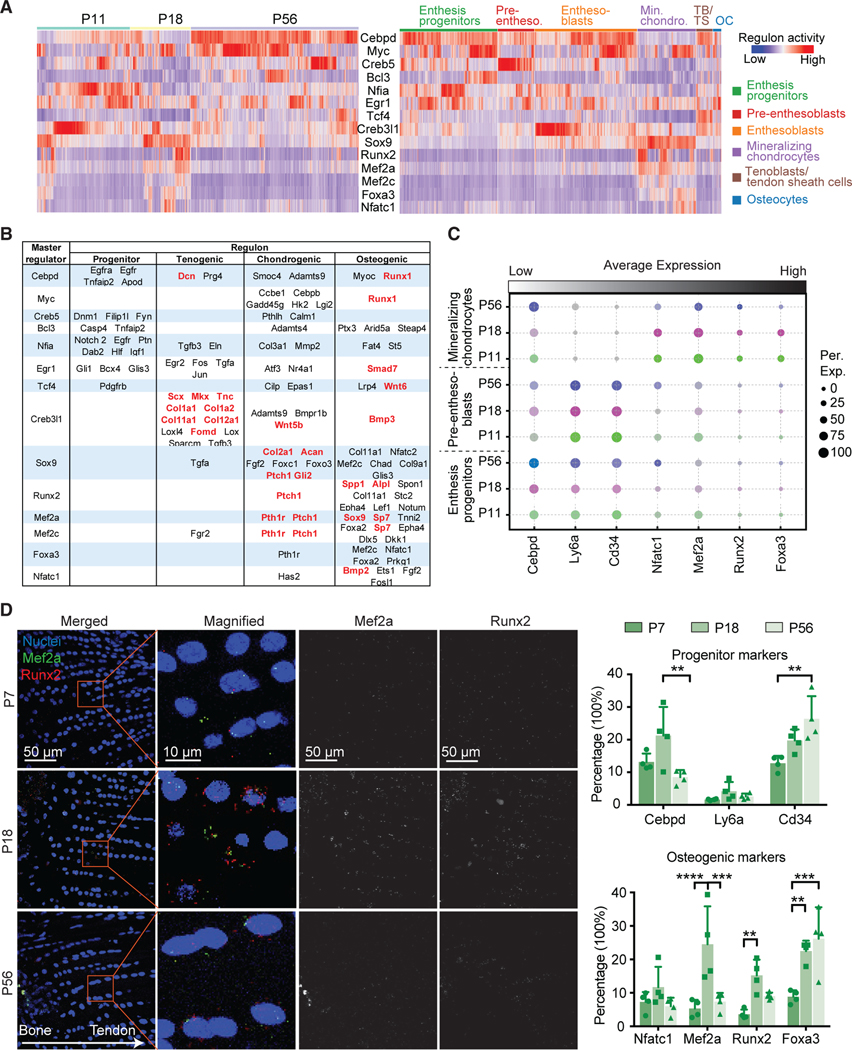
(A) The activities of selected top regulons (rows) presented by time point (left) and cell type (right), as detected by SCENIC analysis. Pre-entheso., pre-enthesoblasts; Min. chondro., mineralizing chondrocytes; TB/TS, tenoblasts/tendon sheath cells; OC, osteocytes.
(B) Summary of putative transcription factor regulons (rows) mediating progenitor function, tenogenesis, and chondrogenesis.
(C) Average expression levels of transcription factors identified in (A) and (B) for enthesis progenitors, pre-enthesoblasts, and mineralizing chondrocytes at P11, P18, and P56. The color represents different time points; the brightness of each dot represents the average expression level from low (light) to high (dark), and the size of each dot represents the percentage of positive cells for each gene.
(D) Representative FISH images (left) of transcription factors at the tendon enthesis identified at different time points and semi-quantitative histomorphometric analysis of expression of these transcription factors (percentage of cells with positive staining; right; n = 3/group). The panels in the second column (left) are magnified images corresponding to the red rectangles. *p < 0.05, **p < 0.01, ***p < 0.001. All data are presented as mean ± standard deviation.
Enthesis stem cell differentiation trajectories reveal a path from enthesis progenitors to mineralizing chondrocytes
To explore the origin and lineage trajectories of enthesis mesenchymal cells, we applied Monocle 333 and scVelo34 algorithms to the scRNA-seq data to infer differentiation paths. Monocle 3 uses an unsupervised algorithm, without prior knowledge, to order whole-transcriptome profiles of single cells. The RNA velocity algorithm,34 on the other hand, predicts future cell states based on the time derivative of the gene expression pattern. Cross-referred results from the two algorithms therefore provide a robust approach for determining differentiation trajectories. Partition-based graph abstraction (PAGA) maps from scVelo analysis suggested that both pre-enthesoblasts and enthesoblasts originated from enthesis progenitors, and enthesoblasts had a greater chance to branch into mineralizing chondrocytes and tenoblasts/tendon sheath cells than osteocytes (Figure 3A). Strikingly, projection of all cells along the latent time of RNA velocity revealed a clear separation of P56 enthesis cells from P11 and P18 enthesis cells (Figures 3B and S5A). This demonstrates a strong connection between P11 and P18 enthesis cell RNA velocities, whereas P56 enthesis cells may have reached homeostasis, and their expression profiles are distinct from the earlier postnatal stages. Ly6a and Cd34, considered progenitor markers, had relatively higher expression levels and RNA velocities in enthesis progenitors (Figures 3C and S5B). Similarly, tenogenic markers (i.e., Scx, Tnmd), chondrogenic makers (i.e., Sox9, Col X), and osteogenic markers (i.e., Runx2, Ibsp, Foxa3) were enriched in corresponding cell subpopulations with respect to gene expression levels and RNA velocities (Figures 3C, S5B, and S5C). Enthesoblasts, tenoblasts/tendon sheath cells, mineralizing chondrocytes, and osteocytes were selected to estimate trajectories of enthesis mesenchymal cell differentiation using RNA velocity (Figure 3D). Mineralizing chondrocytes, tenoblasts/tendon sheath cells, and osteocytes were rooted in enthesoblasts. Consistent with this scVelo analysis, Monocle analysis also inferred that enthesis progenitors were the original cell population leading to pre-enthesoblasts and enthesoblasts, which then branched into either mineralizing chondrocytes, tenoblasts/tendon sheath cells, or enthesoblasts (Figure 3E). Integration of data from all three time points and ordered along pseudotime by Monocle revealed a clear temporal trajectory from enthesis progenitors to pre-enthesoblasts, then enthesoblasts, and finally mineralizing chondrocytes (Figure 3E). Overall, comparison of trajectory analyses from Monocle and RNA velocity revealed clear lineage trajectories of enthesis mesenchymal cells originating from enthesis progenitors.
Figure 3. Cell differentiation trajectories of tendon enthesis cells predicted by scVelo and Monocle.

(A) Trajectory model of scVelo predicts cell-type transitions with single-cell embedding, colored by annotated cell types. Thicker and solid lines indicate stronger correlations between cell types; the size of nodes indicates the percentage of each cell type.
(B) Latent time plot from scVelo analysis captures the temporal dynamics of enthesis transcriptional profiles at different time points.
(C) Expression levels and velocities of representative gene markers, evaluated by scVelo.
(D) RNA velocity stream of a subset of enthesis differentiated cells (i.e., enthesoblasts, mineralizing chondrocytes, tenoblasts/TS [tendon sheath] cells, and osteocytes) overlaid with UMAP embedding. Each arrow indicates the direction and speed of cell movement.
(E) Differentiation trajectories of enthesis mesenchymal cells ordered along pseudotime using Monocle, colored by cell type (top) and pseudotime (bottom). The gray arrows show two main different differentiation paths.
Enthesis Gli1+ progenitors demonstrate clonogenicity and multipotency
In our previous work, we described a distinctive subpopulation of Gli1+ cells that originated in utero and were distinct from tendon fibroblasts and epiphyseal chondrocytes.18 These cells were responsible for building and mineralizing the enthesis and were maintained in the mature enthesis. Furthermore, we found that Gli1+ cells were actively involved in healing neonatal and, to a lesser extent, mature enthesis injuries.19 Motivated by these prior studies and the scRNA-seq analysis of enthesis mesenchymal cells identifying enthesis progenitors, we explored the nature of enthesis-specific Gli1+ cells as a putative resident source of enthesis progenitors. Gli1+ cells were isolated from Gli1CreERT2;Ai14 entheses using fluorescence-activated cell sorting (FACS), analysed using scRNA-seq, and evaluated by in vitro clonogenicity and multipotency assays. Integration of scRNA-seq data of Gli1+ cells from seven time points spanning the range from neonatal enthesis development to maturity revealed that Gli1+ cells had abundant expression of progenitor markers, including Ly6a, Cd44, Cd34, and Pdgfrα (Figure 4A). Due to the fact that the scRNA-seq technique is limited by the inherently low transcript capture rates of some genes with low expression (such as Gli1), it was challenging to identify enthesis progenitors as the cells expressing higher Gli1.35,36 Therefore, to evaluate whether Gli1+ cells were the source of mesenchymal cells at the enthesis, scRNA-seq data of isolated Gli1+ cells were integrated with data from all enthesis mesenchymal cells. Gli1+ cells were distributed across the entire UMAP of all enthesis mesenchymal cells, suggesting that Gli1+ cells have the capacity to differentiate into all enthesis cell phenotypes (Figure 4B). Clonogenicity was then compared among Gli1+ cells, Gli1+ Ly6a+ Cd44+ cells (Gli1+ cells further sorted by FACS for these two progenitor markers; Figures 4C and 4D), and tendon ScxGFP cells (i.e., mature tenocytes, considered a negative control). Gli1+ cells had better capacity to form colonies compared with ScxGFP cells (Figure 4D). Remarkably, Gli1+ progenitors with expression of Ly6a and Cd44 were seven times as clonogenic as ScxGFP cells and twice as clonogenic as the total Gli1+ cells. To examine multipotency, Gli1+ cells, bone-marrow-derived MSCs (positive control), and tendon ScxGFP cells (negative control) were cultured under adipogenic, osteogenic, and chondrogenic conditions (Figure 4E). Like MSCs, Gli1+ cells had both osteogenic and chondrogenic potentials. However, they did not show adipogenic capacity. The enthesis-specific niche of these cells possibly primes their irreversible differentiation potential.28 Importantly, differentiated chondrocyte pellets from Gli1+ cells, but not MSCs and ScxGFP cells, had the morphology, lacunae, and deposited surrounding matrix similar to that of tendon enthesis, suggesting that Gli1+ cells could serve as a source for enhanced enthesis healing (Figure 4E). The ability for Gli1+ cells to form colonies decreased with age: Gli1+ cells from P11 formed more colonies than Gli1+ cells from P28. Although Gli1+ cells from both P11 and P28 had differentiation capacity for chondrogenesis and osteogenesis, more obvious hypertrophic chondrocytes with lacunae were observed after chondrogenic differentiation of Gli1+ cells from P11 entheses.
Figure 4. Enthesis progenitors demonstrate clonogenicity and multipotency.

(A) UMAP plots of expression levels of progenitor makers Ly6a, Cd34, Cd44, and Pdgfrα for enthesis Gli1-lineage (Gli1+) progenitor cells.
(B) UMAP plot of Gli1+ cells from all experiments (Gli1+ cells from P11, P14, P18, P21, P28, and P42 and enthesis mesenchymal cells from P11, P18, and P56).
(C) Study design for cell isolation and assays.
(D) Gli1+ progenitors, labeled for progenitor markers Ly6a and Cd44 and subjected to FACS, had the highest clonogenicity (n = 3–5/group). Gli1+ cells as the total Gli1-lineage cells; *p < 0.05, **p < 0.01, ***p < 0.001, ****p < 0.0001. All data are presented as mean ± standard deviation.
(E) Enthesis Gli1+ cells showed the capacity for osteogenesis and chondrogenesis, but not for adipogenesis (n = 3/group).
Enthesis Gli1-lineage cells have a linear differentiation trajectory
A lineage-tracing approach was taken to characterize the path of enthesis cells from progenitor through mature phenotypes. Gli1+ enthesis cells were tracked by injecting Gli1CreERT2;Ai14 mice with tamoxifen at P5 and P7 (Figure 5A). Our prior work demonstrated that this approach is effective in identifying enthesis lineage cells through skeletally mature stages.18,19 Gli1+ cells were isolated from micro-dissected entheses and sorted by FACS. After quality control and filtering, as described in the STAR Methods, Gli1+ cells from seven time points were integrated and grouped into five clusters (Figure 5B). Gli1+ cells had a significant cluster of enthesis progenitors marked by Ly6a and Cd34, concordantly with the previous analysis of all enthesis cells (Figures 1D and 2C). The composition of the cell clusters did not change over time, indicating that descendants of Gli1+ cells with different phenotypes were evenly distributed across the enthesis (Figures 5C and S6A). As expected, each Gli1+ cell cluster expressed the expected markers: progenitor (i.e., Ly6a, Cd34), tenogenic (i.e., Scx, Tnmd), chondrogenic (i.e., Sox9, Acan), and osteogenic (i.e., Nfatc1, Lbsp) (Figure 5D). The pseudotime trajectory of Gli1+ cells by Monocle 3 analysis revealed a linear lineage progression from enthesis progenitors to pre-enthesoblasts, enthesoblasts, chondrocytes, and finally mineralizing chondrocytes (Figure 5E). The trajectory analysis was further corroborated by enriched expression of Ly6a only in enthesis progenitors, Col1a1 and Fmod only in enthesoblasts, and Col2a1 and Sox9 only in chondrocytes and mineralizing chondrocytes (Figure 5F).
Figure 5. Enthesis Gli1+ cells demonstrate a linear differentiation trajectory.

(A) Experimental design for scRNA-seq analysis of enthesis Gli1+ cells from P7, P11, P14, P18, P21, P28, and P42.
(B) UMAP plot of Gli1+ cells from GliCreERT2;Ai14 mice colored by cell type.
(C) Composition of each cell cluster of Gli1+ cells across different time points.
(D) Violin plots of gene expression of established markers for annotating cell clusters.
(E) A linear trajectory of enthesis Gli1+ cells along pseudotime was identified by Monocle, colored by cell type (top) and pseudotime (bottom).
(F) Scatterplots of expression levels of representative genes ordered along pseudotime.
Chondrocytes and mineralizing chondrocytes are involved in enthesis formation and maturity
To more deeply evaluate the biological processes driving Gli1+ cell differentiation at the single-cell scale, ssGSEA was performed.37 Among the five clusters of Gli1+ cells, chondrocytes and mineralizing chondrocytes showed the highest activity, particularly for processes related to bone growth and ossification, cartilage development, collagen formation, and chondrocyte differentiation (Figure 6A). This suggests that chondrocytes and mineralizing chondrocytes are the key contributors to extracellular matrix deposition and mineralization. We then performed SCENIC analysis on this dataset to explore transcription factor regulons responsible for mediating Gli1+ cell differentiation and focused on transcription factor regulons related with phenotype shifts and maintenance of enthesis progenitors and mineralizing chondrocytes (Figure 6B). Cebpd expression and regulons were more enriched in enthesis progenitors than in the other cell clusters (Figures 6B and 6C). Jun and Egr1 regulons were also more activated in enthesis progenitors. Distinct from the Egr1 regulon, downstream genes of Cebpd regulons were related to progenitor function and tenogenesis (Figure S6C). Although Pou3f3 had relatively low gene expression, the Pou3f3 regulon was highly activated in chondrocytes and mineralizing chondrocytes (Figures 6B and 6C). As shown by the scRNA-seq analysis of all enthesis cells, both expression and regulon activities of Nfatc1 and Foxa3 were enriched in chondrocytes and mineralizing chondrocytes. Expression patterns of progenitor and osteogenic markers were confirmed across development stages (Figure 6D). Progenitor markers, such as Cd34, Ly6a, and Cebpd, were downregulated at P7 compared to late postnatal time points in progenitors. This was also the case for osteogenic markers Foxa3, Mef2a, and Nfatc1. Of note, the expression of Mef2a, which has been reported to regulate bone formation by controlling SOST in osteocytes,38 increased with enthesis maturity from P7 to P42.
Figure 6. Transcriptional regulation of Gli1+ cells.
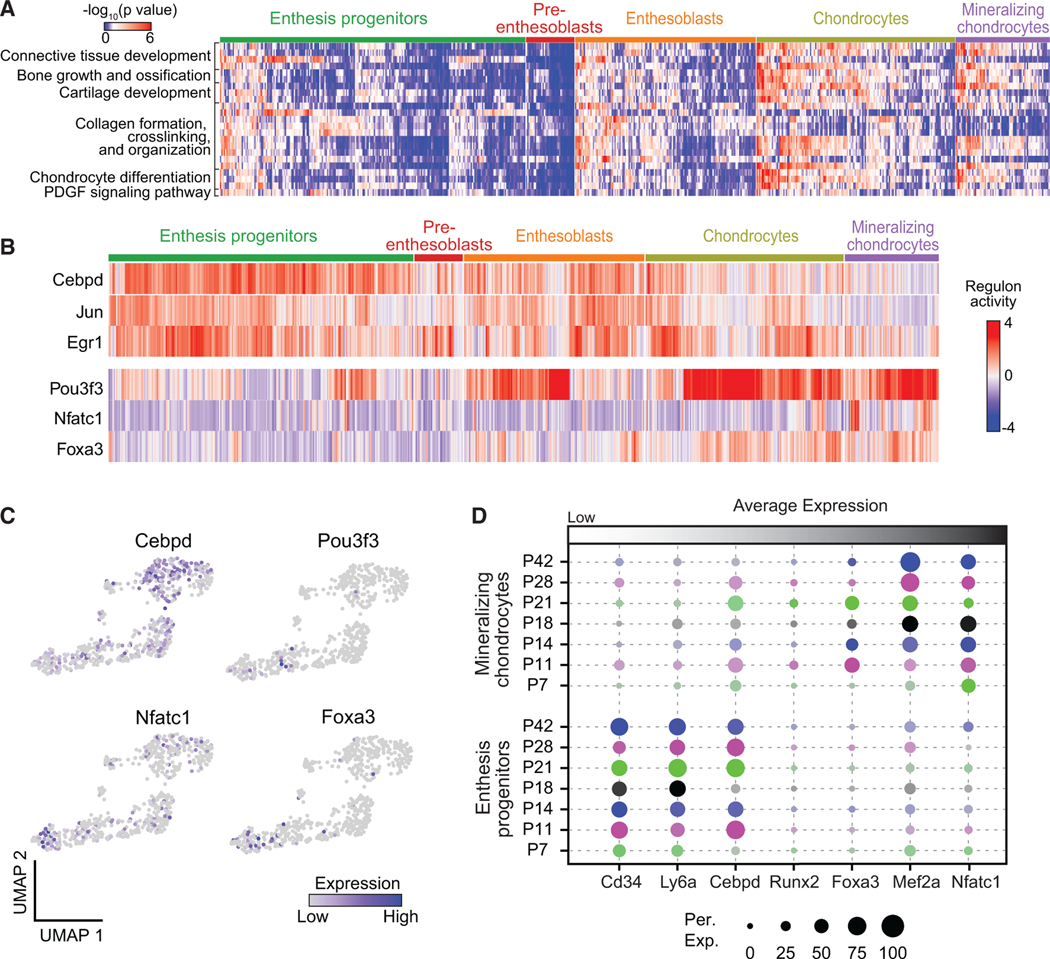
(A) Heatmap of biological processes of Gli1+ cells grouped by cell clusters.
(B) Activities of selected top regulons for Gli1+ cells organized by cell clusters, as identified by SCENIC analysis.
(C) UMAP plots of expression levels of identified transcription factors for Gli1+ cells.
(D) Average expression levels of representative gene makers for enthesis progenitors and mineralizing chondrocytes of Gli1+ cells at different time points. The color represents different time points; the brightness of each dot represents the average expression level from low (light) to high (dark); the size of each dot represents the percentage of positive cells.
Therapeutic potential of enthesis-specific Gli1+ progenitors for enthesis healing
Gli1 stem/progenitor cells are necessary to build the enthesis, express progenitor cell markers, and show multipotency and clonogenicity in vitro. We therefore explored the therapeutic potential of Gli1+ cells to enhance enthesis healing, with the long-term goal of developing a stem cell-based treatment for enthesis regeneration. Gli1+ cells were sorted from mouse entheses, expanded in vitro, and transplanted to injured entheses.19 Gli1+ cells engrafted onto the injury site and were retained from post-operative day 1 (POD1) to POD7 (Figure S7D). Enthesis injury defects became smaller with time, with deposition of more extracellular matrix (Figure 7A). Enthesis injuries treated with Gli1+ cells had smaller gaps and greater mineralization than untreated enthesis injuries (Figures 7A and 7B). Quantification of microCT data showed that bone density and volume of injured regions increased with time and were significantly greater in injuries treated with Gli1+ compared to control, particularly at POD28 (Figures 7C and S7C). Histologically, collagen fiber alignment improved and cell density decreased with time (Figure 7A). More extracellular matrix (including cartilaginous tissue) was deposited at the injured region in the Gli1+ cell-treated group than control, especially at POD28. Semi-quantitative analysis of histology images showed that there was a progressive reduction in histological score toward normal, with significantly better healing in the Gli1+ cell-treated group (Figures 7D and S7F; Table S1). IHC demonstrated that only a limited number of cells expressed collagen X (hypertrophic chondrocytes), osterix (osteoblasts), or scleraxis (tenoblasts) in the healing regions after injury without cell treatment (Figures 7E and S7I). In contrast, injured entheses with Gli1+ cell treatment expressed more chondrocyte marker collagen X and osteoblast marker osterix at POD28, indicating a positive role for transplanted Gli1+ cells during enthesis healing (Figures 7E and S7I). These mineralization and matrix changes from transplantation of enthesis-specific Gli1+ cells significantly increased mechanical properties of healing enthesis at POD28 (Figures 7F and S7J).
Figure 7. Transplanted enthesis Gli1+ cells enhance enthesis healing.

(A) Representative μCT sections (left) and histological images (right) of injured entheses at different post-operative days (POD, n = 6–8/group). The white rectangles in the μCT images identify the injured enthesis regions; the black and yellow rectangles in the histological images show injured and intact enthesis regions, respectively; the color bar shows bone density from low to high. The histology sections are stained with safranin O. Control, only collagen gel delivered; Gli1, Gli1+ cells delivered via collagen gel; POD7, post-operative day 7.
(B) Representative 3D μCT images of the humeral head bone at POD28 (top), with the injured enthesis outlined with a dashed white circle (n = 6–8/group). The percentage of samples with ectopically calcified tissues near the enthesis, normalized by sample size of each group, is shown on the bottom. The white arrow points a region with HO (heterotopic ossification). “None” denotes no or negligible HO tissue formed close to enthesis; “Small” denotes relatively small HO tissue formed; “Large” denotes relatively large (length > 20 μm) HO tissue formed; Ctrl, control with no cell treatment.
(C) Bone quality of the injured regions, including bone mineral density (BMD) and bone volume, quantified from μCT data (n = 6–8/group). #p < 0.10, *p < 0.05, **p < 0.01, ***p < 0.001, ****p < 0.0001. Control, no cell treatment; Enthesis Gli1, treatment with enthesis-derived Gli1+ cells; Bone Gli1, treatment with bone-derived Gli1+ cells. All data are presented as mean ± standard deviation.
(D) Histological scoring, as determined from blinded evaluation of histological images (n = 6–8/group).
(E) Immunohistochemical staining for collagen X and osterix at the healing enthesis at POD28 for control and enthesis-derived Gli1+ cell treatment (n = 6–8/group).
(F) Biomechanical properties of healing enthesis at POD28 for control and enthesis-derived Gli1+ cell treatment (n = 7/group).
(G) Density plots of expression levels of HO-related genes for all enthesis Gli1+ cells integrated from P7, P11, P14, P18, P21, P28, and P42.
To verify that the positive effects of Gli1+ cell treatment was due to their enthesis progenitor cell nature, we delivered Gli1+ cells derived from bone and ScxGFP cells derived from adult tendons (which do not show the progenitor characteristics of enthesis-derived Gli1+ cells, Figures 4D and 4E) to the injury site in a separate group of animals. Treatment with bone-derived Gli1+ cells had lower mineral density and mineralized tissue volume at the healing enthesis and higher histology scores (indicating worse healing), compared with enthesis-derived Gli1+ cell treatment (Figures 7C, 7D, S7E, and S7H). Treatment with ScxGFP tendon cells showed less organized collagen fibers and decreased cartilaginous tissue at POD11 relative to Gli1+ cell-treated injuries (Figure S7G). These results demonstrate the specificity and regenerative capacity of enthesis-specific Gli1+ cells for tendon enthesis injuries.
Heterotopic ossification (HO) was also found adjacent to injured entheses in many cases (Figures 7B and S7A). More and larger ossified tissues were identified at Gli1+ cell-treated injuries at POD14 and POD28 compared with the control group. To explore the mechanisms driving HO, we correlated the scRNA-seq data of enthesis Gli1+ cells with a list of known gene markers for HO. Prg4 and Ctsk are associated with osteogenic differentiation at subchondral bone, ligament, and tendon.39,40 Gnas, an osteochondral progenitor gene, is associated with osteogenic differentiation through Wnt signaling.41 Mutation of Mkx has been reported to cause aberrant differentiation of tendon progenitors, leading to tendon ossification.42 In the current study, expression of Prg4, Ctsk, Gnas1, and Mkx were more abundant in enthesoblasts than in the other cell clusters, implying a possible role for enthesoblasts in tendon HO. Although further study is needed to verify a role for enthesoblasts, these results reveal a potential target for inhibiting tendon HO in pathologic settings.
DISCUSSION
The enthesis serves a critical function in the musculoskeletal system: transferring muscle forces from tendon to bone to achieve joint motion. Prior work has focused on understanding tendon enthesis structure, function, and pathology, but the nature and phenotype shift of enthesis progenitors has remained elusive. Here, we reported a detailed transcriptional profile of enthesis mesenchymal cells, including characterization of cell types, exploration of the underlying gene regulatory network, and differentiation paths of enthesis progenitor cells to mature enthesis cells. A set of transcription factor regulons, defined by analysis of single-cell transcriptome data and localized to the enthesis by FISH, was identified, specifically for progenitor function, enthesis mineralization, chondrogenesis, tenogenesis, and osteogenesis. Importantly, enthesis progenitors were identified, demonstrating expression of Gli1, Cd34, Cd44, and Ly6a and in vitro clonogenicity and multipotency. These currently identified enthesis stem/progenitor cells demonstrated therapeutic potential for improving enthesis healing.
The development of effective treatments for the tendon enthesis requires a deeper understanding of enthesis cell biology, especially regarding the spatial gradient in cell phenotypes from unmineralized to mineralized tissue.43 Fibroblast-like stromal cells, typically denoted as “tenocytes,” have been reported as the main cell type in healthy tendon.15,44 These spindle-shaped cells are dispersed along collagen fibers and are responsible for maintaining tendon extracellular matrix.45,46 The tendon surface contains an additional resident cell population, αSMA-positive myofibroblasts, which respond to injury and infiltrate the torn region.17,47 Additionally, various immune cell subtypes, whether resident or recruited, are involved in the initiation and progression of tendon degeneration and injury, but the role of this immune cell subpopulation is controversial for healthy and homeostatic tissues.43 Notably, resident tendon stem/progenitor cells have been identified and isolated based on their in vitro behavior.14 Although the use of tendon stem cells or stem cell-derived exosomes in animal models is attractive, the lack of determined stem cell markers and knowledge about molecular mechanisms driving their behavior and function hinders their translational application.15 To explore these concepts in the enthesis, we used whole transcriptomic profiles to define six cell subpopulations in mouse SST entheses according to gene markers related to stem cells, tenogenesis, chondrogenesis, and osteogenesis. Enthesis progenitors shared similar markers with fibro-adipogenic progenitors found in tendon,28 bone marrow,48 and muscle.27 Different from progenitors, pre-entheoblasts had a transitional expressing profile with upregulated genes involved in cell differentiation and downregulated genes attributed to maintenance of progenitor status. An interesting cell subpopulation possessing expression patterns of both tenogenesis and chondrogenesis were labeled as enthesoblasts. This is consistent with previous reports that a distinct cell pool, which expresses both the tenogenic marker Scx and the chondrogenic marker Sox9 (and are not derived from chondrocytes), is found at the enthesis during pre-mineralization fetal time points.30,49 We suggest that another cell subtype, which we termed “mineralizing chondrocytes,” is responsible for the graded structure of enthesis from unmineralized to mineralized fibrocartilage, as it showed activated expression profiles of both chondrogenic and osteogenic markers and clearly played an essential role in enthesis mineralization.
The experimental design included isolation of all enthesis cells in one dataset and only Gli1+ cells in a second dataset. The complete set of enthesis mesenchymal cells included progenitors, pre-enthesoblasts, enthesoblasts, mineralizing chondrocytes, osteocytes, and tenoblasts/tendon sheath cells; however, the dataset with only Gli1+ cells did not include osteoblasts and tenoblast/tendon sheath cells. Enthesis Gli1+ cells are therefore a subpopulation of all enthesis cells and a population that was previously shown to drive the formation of unmineralized and mineralized fibrocartilage.18 Differences in cell clustering among the two datasets may also be attributed to differences in resolution. For example, chondrocytes were defined in the scRNA-seq analysis of Gli1+ cells, but not in the analysis of all enthesis mesenchymal cells. This may be due to clustering of Gli1+ cells with high resolution and clustering all enthesis mesenchymal progenitors with low resolution, resulting in incorporation of chondrocytes and mineralizing chondrocytes into one cluster.
Systematic examination of the gene regulatory network defining enthesis cell phenotypes revealed a group of undefined transcription factors that regulate lineage progression from progenitor to mature enthesis cell. Further in vitro screening and in vivo animal models are needed to show whether these factors are necessary and sufficient to drive enthesis progenitor cell differentiation. Nevertheless, a set of gene markers was identified for the various cell subtypes in the tendon enthesis. These markers will allow for examination of cell phenotype shifts in degenerated or diseased conditions, e.g., toward fibrous, cartilaginous, and/or ossified tissues in tendon and enthesis. Corroborating with the literature that Sox9 is required for chondrogenesis, including at the mineralizing growth plate,50–52 Sox9 was confirmed in our data as a downstream target gene contributing to enthesis chondrogenesis and osteogenesis. Similarly, Runx2 is known as the earliest determinant of osteoblast differentiation53 and was also found here to be highly activated in enthesis mineralizing chondrocytes and osteoblasts. Our work further highlighted that Cebpd, Nfia, and Egr play a role in mediating downstream genes ranging from progenitor to osteogenic markers. Egr1 has been shown to coordinate matrix production and further mediate musculoskeletal tissue formation,54,55 but the roles of Cebpd and Nfia in musculoskeletal tissues are not clear. Nfia has been suggested to be expressed in the tendon enthesis and to safeguard stem cell identity in hair follicles.56,57 The gene regulatory network analysis identified six typical tenocyte markers (e.g., Scx, Mkx, Tnc, Col1a1, Col1a2, Fmod) regulated by Creb3l1 whose role has not been previously reported for tendon development, with only limited evidence suggesting its involvement in collagen metabolic process via TGFβ signaling.58,59 Finally, Runx2, Mef2a, Mef2c, Foxa3, and Nfatc1 were inferred here by SCENIC analysis to regulate downstream target cofactors required for enthesis chondrogenesis and osteogenesis, consistent with prior literature.38,60,61 Additional experiments (e.g., ChIP-seq, gain- and loss-of-function transgenic mouse models) are needed to determine the interactions of the putative transcription factors with their downstream targets and their roles for regulating enthesis formation and maintenance. These experiments will define how these currently identified putative enthesis transcription factors and their downstream cofactors are temporospatially coordinated to drive enthesis progenitor cell fates to produce a spatially graded mineralized structure at the tendon-bone interface.
Gli1+ cells have been identified in stem cell niches of a wide range of tissues. These cells function as stem/progenitor cells responsible for formation and homeostasis of tissues such as bone, teeth, tendon, colon, kidney, and heart.20–23,62,63 The current work demonstrated that Gli1+ cells were also a specialized pool of resident enthesis progenitor cells and had better regenerative capacity compared to Gli1+ cells from other sources. This finding has significant implications for the treatment of enthesis disorders and holds great promise for enhancing tendon-to-bone repair. Enthesis Gli1+ progenitors share similar transcriptional signatures with MSCs, such as enriched Ly6a, Cd34, and Pdgfrα, and have the capacity to differentiate into multiple cell types. In the context of enthesis development, Gli1+ progenitors have a linear lineage trajectory from progenitor to mature enthesis cell and populate all enthesis cell subtypes across the transition from tendon to bone. Although the overlap of transcriptional and epigenetic profiles of Gli1+ progenitors from various tissues remains unknown, their resident environment might dictate a limited range of phenotypes specific to the particular tissue. For the enthesis, Gli1+ progenitors were only capable of in vitro differentiation into chondrocytes and osteoblasts, but not adipocytes. Additionally, the ability for Gli1+ cells to form colonies decreased with age and Gli1+ cells from mature enthesis had inferior chondrogenic potential than those from early postnatal enthesis. Consistent with our previous reports, these findings support the conclusion that Gli1+ cell population at early (pre-mineralization) postnatal time points have higher regenerative capacity than Gli1+ cell population from late (post-mineralization) postnatal time points.19 This may partially explain the improved healing responses of immature enthesis compared with mature enthesis in prior reports, but further work should be performed to better evaluate the contribution of tissue niches and whether the cells function during healing via a cell-autonomous versus non-cell-autonomous mechanism.
Development of therapeutic strategies focused on Gli1-expressing progenitor cells may have a wide application to various enthesis injury and degeneration scenarios. For enthesitis, suppression of these cells may mitigate the formation of osteophytes. For tendon-to-bone repair, promotion (or delivery) of these cells may lead to regeneration of a functionally graded enthesis. However, several challenges exist for implementing these strategies. Due to the difficulties involved in harvesting sufficient Gli1+ progenitors from tissues, the decrease in Gli1+ cells with age, and the need to expand cells in vitro prior for transplantation (with potential loss of cell phenotype), the therapeutic use of primary Gli1+ progenitor cells will be difficult. It may be necessary to use MSCs from another source, or induced pluripotent stem cells, differentiated into enthesis-specific Gli1+ progenitors.64 Furthermore, careful design of a cell delivery system is necessary to maintain progenitor cell features after transplantation, engraft cells to the injured region, and promote cell integration and direct differentiation. As presented in our study, Gli1+ cell transplantation can increase matrix deposition and mineralization of injured enthesis but can also cause HO; this was attributed to the limited ability of the collagen gel carrier to retain cells at the injured site. These results also imply that undesired differentiation of Gli1+ progenitors during tendon and kidney calcification and bone marrow fibrosis might be inhibited by preventing proliferation and differentiation of these cells.21,22,62 This can be realized by inactivating molecular signals such as the transcription factors identified in the current study, e.g., by regulating hedgehog signaling components such as Ptch1 and Gli1 or using antagonists or agonists.65
Limitations of the study
Enthesis cells reside within a dense extracellular matrix, much of it mineralized. Therefore, extraction of cells for FACS and scRNA-seq requires a relatively harsh digestion protocol. The digestion environment and mechanical perturbation by sorting could cause a change in the expression profiles of the cells.66 However, we demonstrated that the application of chemical digestion and FACS resulted in more than75% viability of cells from the enthesis. Furthermore, cells from all isolation time points were dissociated using the same protocol so that comparison of their transcriptomes is valid. Future work will include spatial transcriptomics to address possible dissociation artifacts and gain spatial information. A second limitation in the study was that delivery of Gli1+ cells to the injured enthesis led to HO in some cases. This was likely due to the delivery system used, which did not retain all cells at the repair site post-implantation. To avoid HO in tendon, future experiments will use an adherant material to localize and retain the cells to the injury site.67
STAR★METHODS
RESOURCE AVAILABILITY
Lead contact
Further information and requests for resources and reagents should be directed to and will be fulfilled by the Lead Contact, Stavros Thomopoulos (sat2@columbia.edu).
Materials availability
This work did not generate new reagents or materials.
Data and code availability
All single-cell datasets created during this study have been deposited in the Gene Expression Omnibus (GEO) and are publicly available at NCBI GEO: GSE182997. This paper does not report original code. Any additional information required to re-analyze the data in the paper is available from the lead contact upon request.
EXPERIMENTAL MODEL AND SUBJECT DETAILS
Animal models
All animal procedures were approved by the Columbia University’s institutional Animal Care and Use Committee. Wild-type animals used for 10x Genomics Chromium 3′ Single Cell RNA-seq (scRNA-seq) analysis and injury models were C57BL/6J mice purchased from the Jackson Laboratory. To harvest Gli1-lineage cells for pooled 3′ End scRNA-seq in 96-well plates, in vitro experiment, and cell transplantation for injured models, Gli1CreERT2 mice18 were crossed with Ai14 mice from the Jackson Laboratory. Gli1CreERT2;Ai14 mice were further crossed with ScxGFP mice. Both Gli1CreERT2;Ai14 mice and Gli1CreERT2;Ai14;ScxGFP mice were injected with tamoxifen at P5 and P7 and used in our study. Mice were maintained in standard cages under a standard 12 h light/dark cycle with ad libitum access to food and water.
Primary cell culture
Gli1-lineage cells were dissected, dissociated (described below), sorted by FACS, and then cultured in growth medium containing αMEM medium, 10% fetal bovine serum, and 1% penicillin/streptomycin. Cells were subsequently harvested at passage three for in vitro differentiation assays and transplantation in injured mice.
METHOD DETAILS
Single-cell isolation for 10x Genomics Chromium
Tendon entheses (n = 12–16/time point for 10x Genomics) from P11, P18, and P56 C57BL/6J mice were dissected under surgical microscope and pooled together (Figures S1A and S1B). They were digested in HBSS solution with 300 mg/mL liberase, 20 ng/mL Dnase, 5% FBS, and 100 mg/mL HEPES for 1.5 h at 37°C. The samples were filtered through a 40 μm strain, resuspended in the RBC lysis buffer for 5 min at room temperature to lyse erythrocytes and stained with Cd45 in 200 μL PBS with 5% FBS for 45 min at 4°C to exclude hematopoietic cells. Then, the samples were washed with PBS three times, resuspended in 500 μL PBS with 1 μg/ml DAPI and 5% FBS, and filtered into polypropylene FACS tubes. Single cells without Cd45 and DAPI staining were index sorted by a BD Influx Sorter and collected into a microcentrifuge tube for scRNA-seq 10x Genomics experiments.
Single cell isolation for single-cell RNA sequencing in 96-well plates
For experiments of 3′ End scRNA-seq in 96-well plates, tendon entheses (n = 3/time point) of GliCreERT2;Ai14 mice of P7, P11, P18, P21, P28, and P42 were dissected, pooled together, and digested in the aforementioned solution under the same condition discussed above. All cells were stained with 1 μg/ml DAPI and cells with red fluorescence and without DAPI staining (live Gli1+ cells) were index sorted by a BD Influx Sorter. Single cells with red fluorescence and without DAPI staining were collected into 96-well plates, prefilled with lysis buffer for scRNA-seq analysis.
Fluorescence in situ hybridization (FISH)
Tendon-bone samples of C57BL/6J mice at P7, P18, and P56 (n = 4/time point) were fixed in 10% formaldehyde for 3 h, permeabilized in 30% sucrose for 1 h, embedded in optimal cutting temperature (OCT) compound, and cryosectioned into 10 μm-thick tissue slices. Tissue slices were treated with 5 μg/mL Proteinase K for 10 min and RNA FISH of these slices was performed using RNAscope FISH techniques according to the manufacturer’s instructions.72 To visualize the mRNA spatiotemporal expression pattern, in situ hybridization was conducted using the positive and negative probes as control and also the probes against Cebpd, Cd34, Foxa3, Ly6a, Mef2a, Nfatc1, and Runx2. After hybridization, tissue slices were counterstained with DAPI and mounted for images. All FISH image stacks were collected on a Nikon TI Eclipse inverted microscope with 20× and 60× oil objectives for visualization. All imaging parameters of confocal microscope were maintained consistently for FISH. ImageJ software (National Institute of Health) was used to equally perform post-imaging manipulation and quantify percentage of cells with positive staining normalized by the total cell number from histological sections. Maximal projection of image stacks was presented as representative FISH images.
Colony formation assay
GliCreERT2;Ai14;ScxGFP mice were injected with tamoxifen at P5 and P7. Tendon entheses and partial tendons of three GliCreERT2;Ai14;ScxGFP mice at P11 and P28 were pooled and digested for harvesting cells. All cells were stained with antibody cocktails of Cd44 and Ly6a in PBS for 45 min at 4°C, washed three times, and then stained with 1 μg/ml DAPI for sorting. We aimed to sort out four types of cells (n = 3–5/each type): Gli1+ Ly6a+ Cd44+ DAPI- enthesis cells (Gli1 progenitors) at P11; Gli1+ DAPI- cells (Gli1+ cells) at P11; Gli1+ DAPI- cells (Gli1+ cells) at P28; ScxGFP+ Gli1- DAPI- cells (ScxGFP cells) at P56. Single cells of four types were sorted in 96-well plates and cultured in αMEM medium, 10% fetal bovine serum, and 1% penicillin/streptomycin for 1 month. All were incubated with 0.5% crystal violet staining solution for 20 min. The wells with more than 100 cells were considered to have colonies. The percentage of colony formation was calculated by normalizing the number of colonies by 96, the total well number.
In vitro multipotential differentiation assays
Tendon entheses of GliCreERT2;Ai14;ScxGFP mice at P11 and P28 (n = 4–6/time point) with tamoxifen injected at P5 and P7 were pooled together and digested. Gli1+ cells and Gli1- ScxGFP+ cells were collected for culture. Mouse bone marrow mesenchymal stem cells were harvested as positive control in parallel. All cells were expanded in αMEM medium, 10% fetal bovine serum, and 1% penicillin/streptomycin. After achieving 80% confluency, cells were trypsinized and separated for adipogenesis, osteogenesis, and chondrogenesis assays.
Cells were seeded on 6-well plates and incubated in culture medium overnight. Cells were then maintained in adipogenic, osteogenic, or chondrogenic differentiation media (Lonza) following the manufacturer’s instructions. For checking adipogenesis, cells after culturing in two weeks were fixed in 10% formaldehyde and stained with Oil Red O. For osteogenesis evaluation, cells after maintaining in differentiation medium for 21 days were fixed and stained with 2% Alizarin Red S pH = 4.2. For determining chondrogenesis, cells differentiated for 28 days were stained with Alcian blue pH = 1.2.
Cell preparation for transplantation
Gli1+ cells were isolated sepaeately from tendon entheses and tibia bones of GliCreERT2;Ai14;ScxGFP mice at P11 as described above. Gli1+ cells from entheses and bones were collected, cultured in the growth medium, and expanded until passage 3 for treatment of enthesis injuries. To check the retention of Gli1+ cells at post-operative day (POD) 1, 3, and 7, cells were released from culturing dishes and incubated in Qtracker 705 Cell Labeling Kit for 1 h prior to implantation. Gli1+ cells from bones and entheses were suspended in sterile 4 mg/ml collagen type I solution from rat tail at a concentration of 2×10⁷ cells/ml for transplantation.
Needle punch enthesis injury and cell transplantation
Enthesis injury protocols were adapted from our previous study.19 After injection with buprenorphine SR and then isoflurane anesthesia, nine to ten-week-old C57BL/6J mice (n = 6–8 with females and males for each group of post-operative day sacrifice) were placed in a lateral decubitus position. The upper limb was externally rotated to bring the forearm in supination and secured. An incision was made in the skin to visualize the deltoid. The deltoid was cut to expose the supraspinatus enthesis and humerus head. For the injured right shoulder treated with Gli1+ cells from entheses or bones, 1×10⁶ cells in 50 μL collagen type I solution was pumped into a syringe with a 28G needle. The needle was inserted into the tendon enthesis (close to the humeral head) to create a punch defect until the enthesis was completely bisected into the marrow cavity. The cells were gradually released from the syringe to fill the punched hole. For the contralateral left shoulder as control, only the punch injury was created with no cells delivered. 5–0 PROLENE suture was used to ligate the deltoid back over the humerus and close the skin. After injury, mice were allowed free cage activity and were euthanized at post-operative day 7, 14, and 28 for μCT scanning, histology, IHC, and mechanical testing.
Single-cell RNA sequencing
For 10x Genomics Chromium 3′ solution, the cells were centrifuged at 500g for 5 min, counted by a hemocytometer, and resuspended in PBS with 10% FBS. Approximately 5,000 cells were captured for each sample. The sorted cells were loaded into 10x Chromium Controller using the Chromium Single Cell 3′ v3 reagents and prepared as droplets for lysis and reverse transcription. The resulting pooled, 3′-end libraries were sequenced on an Illumina NovaSeq 6000 Sequencer. The data presented in Figures 1, 2, and 3 were derived from 10x Genomics based sequencing.
For scRNA-seq in 96-well plates, 96-well plates with cells in lysis buffer were spun down and processed with automated liquid handling robot. Adapter-linked oligo(dT) primers including both cell- and molecule-specific barcodes were used to complete template-switching reverse transcription. Pooled 3′-end sequencing libraries were finally sequenced on an IIlumina NextSeq 500. The data presented in Figures 5 and 6 were derived from 96-well plate-based sequencing.
Single-cell RNA sequencing data analysis
Cell Ranger was used to demultiplex raw data for creating Fastq files. Following alignment and filtering, gene-level unique molecular identifier counts (UMIs) and gene expression matrix were obtained for downstream analysis. The R package Seurat was used as a first analytical tool to load data and build Seurat objects, which were processed for controlling data quality, filtering, clustering, visualizing data, and examining differential expression analysis. Specifically, cells with genes expressed in less than 2 cells, with UMIs<1000, with UMIs mapped to mitochondrial genes>20%, or with genes<200 were removed. After normalization of cells by the total UMI read counts, unsupervised shared nearest neighbor clustering with an adjusted resolution were performed and displayed in UMAP. Clusters were subset and identified by representative marker genes related with, for example, tenogenesis and chondrogenesis. Datasets at different time points were integrated via canonical correlation analysis (CCA) and visualized in UMAP atlas. Shared patterns of transcriptional profile were highlighted by CCA analysis and shown by heatmaps and dot plots.
Gene regulatory network analysis
For single cell regulatory network analysis, the SCENIC package (V1.2.2) was used with default settings to identify master regulator and transcriptional regulatory networks. First, the GENIE3 module was used to identify target genes that were significantly co-expressed with a certain transcription factor. Next, the RcisTarget module was used to predict the target genes by screening the enriched cis-regulatory motifs of candidate transcription factors. Lastly, the AUCell algorithm was used to score the activity of each regulon. To show the master regulators of each single cell, regulon activities were plotted using heatmaps.
Gene set enrichment analysis
Single-sample gene set enrichment analysis (ssGSEA), which identified the enriched gene sets at a single cell level, was used as previously described.33 In brief, we computed enrichment scores of a certain gene set for both the experimental dataset and a random permutated dataset of 1000 cells. The normalized gene expression matrix from Seurat analysis and gene sets of interest (from GSEA Molecular Signatures Database v7.2) were used as inputs. p values of each gene set were computed by comparing our dataset to the permutated dataset. The heatmaps showed −log10(p values) of enriched gene sets using the ComplexHeatmap package.68
Cell lineage trajectory analysis
Following the instructed tutorial of Monocle 3 package with the default settings, detailed pseudotime for tendon enthesis resident cells over different time points were generated.69 Cell clusters were also arranged along the pseudotime to represent the lineage trajectory. For RNA velocity, a loom file of spliced and unspliced mRNAs from aligned bam file using Velocyto package (V0.17.16) in Python (V3.6) was created. Then RNA velocity was computed based on both steady state and dynamic models using scVelo package.34 The scVelo algorithm used raw read counts from sequencing and was insensitive to library size normalization.
Microcomputed tomography
SST-humeral bone samples from injured mice were dissected for bone morphometry analysis.25 Microcomputed tomography (μCT, Bruker Skyscan 1272) with an energy of 55 kV peaks, an intensity of 145 μA, and a standard resolution of 5 μm was used to scan samples. After image reconstruction, region of interest around the injury region was selected by a rectangle with a fixed dimension (Figure S7B). Bone volume (mm3), BMD (bone mineral density), Tb.Th (bone thickness) in the region of interest were measured directly with CTAn (Bruker). For 3D visualization, the reconstructed images were imported into CTVOX (Bruker).
Histology and immunohistochemistry
Tendon-bone samples after μCT scanning were fixed in 10% formaldehyde overnight. Following this, tendon-bone samples were decalcified in Buffered Versenate for two weeks. Subsequently, the samples were embedded in OCT compound, cryosectioned into 10 μm-thick slices, and stained with safranin O according to the standard protocol. All images were collected on a Zeiss Axiovert microscope for visualization and semi-quantified according to Table S1. Similarly, tissue sections of injured enthesis at POD7 to track the retention of Gli1+ cells were prepared. Tissue slices were counterstained with DAPI and mounted for imaging by using a Nikon TI Eclipse inverted microscope with 20× and 60× oil objectives discussed above. To evaluate the differentiation of transplanted Gli1+ cells, the 10 μm-thickness cryosections were predigested in 2 mg/mL hyaluronidase, washed in 0.5% Triton X-100/PBS, blocked in 15% goat serum/PBS, and incubated with primary antibodies at 4°C overnight and appropriate secondary antibodies for 1 h at room temperature.25 Nikon Ti Eclipse inverted microscope was used to image the stained cryosections. ImageJ software (National Institute of Health) was used to equally perform post-imaging manipulation and project image stacks maximally for presentation in figures.
Tendon enthesis biomechanics
Tendon-bone samples were dissected from injured right shoulders with enthesis Gli1+ cells and contralateral injured shoulders with no cell transplantation at post-operative day 28. Following our established testing protocol,18,67 samples were gripped in a customized 3D-printed fixtures and mounted on a testing frame (44.5 N load cell; ElectroPuls 1000, Instron Corp.). The samples were preconditioned and then pulled in tensoin to failure. The previously constructed μCT images were used to calculate the tendon enthesis cross-sectional area. The force-displacement data were recorded to evaluate tendon enthesis structural and material properties (e.g., maximum force, stiffness, maximum stress/strength, toughness).
QUANTIFICATION AND STATISTICAL ANALYSIS
GraphPad Prism 7 was used to conduct statistical analysis. Results are shown as mean ± standard deviation (SD). Both male and female mice from at least two independent litters were used for all experiments. All data analysis were conducted blindly. When a comparison was applied between two groups, an unpaired or paired (when appropriate) Student’s t test was used. When a comparison was applied among multiple groups or two factors, ANOVA was performed with post hoc Tukey correction. #p < 0.1, *p < 0.05; **p < 0.01; ***p < 0.001; ****p < 0.0001 are shown to indicate p values in the figures. The exact numbers of repeated samples for each experiment are indicated in the corresponding figure legends.
Supplementary Material
KEY RESOURCES TABLE
| REAGENT or RESOURCE | SOURCE | IDENTIFIER |
|---|---|---|
| Antibodies | ||
|
| ||
| Brilliant Violet 711 Anti-Mouse/Human CD44 Antibody | BioLegend | Cat #103057; RRID: AB_2564214 |
| Ly-6A/E (Sca-1) Monoclonal Antibody | Invitrogen | Cat #17-5981-82; RRID: AB_469487 |
| Purified Anti-mouse CD45 Antibody | BioLegend | Cat #103101; RRID: AB_312966 |
| CD16/CD32 Monoclonal Antibody | eBioscience | Cat #14-0161-82; RRID: AB_2313773 |
| Anti-ScxA Antibody | Abcam | Cat #ab58655; RRID: AB_882467 |
| Collagen X Monoclonal Antibody | Invitrogen | Cat #41-9771-82; RRID: AB_2313773 |
| Osterix Antibody | Abcam | Cat #EPR21034; RRID: AB_2313773 |
| Rabbit Anti-Mouse IgG (H + L) Cross-Adsorbed Secondary Antibody, Alexa Fluor 488 | Invitrogen | Cat #A-11059; RRID: AB_2313773 |
| Rabbit Anti-Mouse IgG (H+L) Cross-Adsorbed Secondary Antibody, Alexa Fluor 647 | Invitrogen | Cat #A-21239; RRID: AB_2313773 |
|
| ||
| Chemicals, peptides, and recombinant proteins | ||
|
| ||
| Acetic Acid | MilliporeSigma | Cat #695092 |
| Alcian Blue | MilliporeSigma | Cat #A3157 |
| Alizarin Red S | MilliporeSigma | Cat #A5533 |
| Alpha-MEM | Gibco | Cat #12571603 |
| BenchMark™ Fetal Bovine Serum | GeminiBio | Cat #100-106 |
| Buffered Versenate | StatLab | Cat #DCV0150 |
| Collagen, Type I Solution from Rat Tail | MilliporeSigma | Cat #C3867-1VL |
| Crystal Violet | MilliporeSigma | Cat #C0775 |
| DAPI (4′,6-diamidino-2-phenylindole) | ThermoFisher Scientific | Cat #62248 |
| DNase I, RNase & Protease Free, Solution | Worthington Biochemical Corporation | Cat #LS006342 |
| HBSS, No Calcium, No Magnesium | Gibco | Cat #14170112 |
| Hydrochloric Acid | MilliporeSigma | Cat #H1758 |
| HEPES Solution | MilliporeSigma | Cat #5401020001 |
| Isopropanol | MilliporeSigma | Cat #I9516 |
| Liberase TL Research Grade | MilliporeSigma | Cat #H0887 |
| Marcaine | Astra Zeneca | Cat #2209748 |
| Methanol | MilloporeSigma | Cat #179337 |
| Mounting Medium with DAPI | Abcam | Cat #ab104139 |
| Oil Red O | Cat #O0625 | |
| PBS (10X), pH 7.4 | Gibco | Cat #70011044 |
| Penicillin-Streptomycin-Glutamine (100X) | Gibco | Cat #10378016 |
| Pierce™ 16% Formaldehyde (w/v), Methanol-free | ThermoFisher Scientific | Cat #28906 |
| Proteinase K, Recombinant, PCR grade | ThermoFisher Scientific | Cat #EO0491 |
| RNase AWAY Decontamination Reagent | Invitrogen | Cat #10328011 |
| Sucrose | MilliporeSigma | Cat #S0389 |
| Tamoxifen | MilliporeSigma | Cat #T5648 |
| Trypsin-EDTA (0.05%), Phenol Red | Gibco | Cat #25300054 |
| UltraPure DNase/RNase-Free Distilled Water | Invitrogen | Cat #AM9920 |
| 2-Propanol | MilliporeSigma | Cat #I9516 |
| 10X RBC Lysis Buffer | eBioscience | Cat #00430054 |
|
| ||
| Critical commercial assays | ||
|
| ||
| Human Mesenchymal Stem Cell (hMSC) Chondrogenic Differentiation Medium BulletKit | Lonza | Cat #PT-3003 |
| Human Mesenchymal Stem Cell (hMSC) Osteogenic Differentiation Medium BulletKit | Lonza | Cat #PT-3002 |
| Human Mesenchymal Stem Cell (hMSC) Adipogenic Differentiation Medium BulletKit | Lonza | Cat #PT-3004 |
| Qtracker 705 Cell Labeling Kit | Invitrogen | Cat #Q25061MP |
| RNAscope Fluorescent Multiplex Reagent Kit | ACDBio | Cat #320850 |
| Safranin O Cartilage Stain Kit | StatLab | Cat #KTSFO |
| TGF Beta 3 for hMSC Chondrogenic Differentiation Kit | Lonza | Cat #PT-4124 |
|
| ||
| Deposited data | ||
|
| ||
| GSEA (Gene Set Enrichment Analysis) | N/A | http://www.gsea-msigdb.org/gsea/msigdb/collections.jsp |
| Mouse Genome Database | The Jackson Laboratory | http://www.informatics.jax.org/ |
| Mouse Genome Database | The Jackson Laboratory | http://www.informatics.jax.org/ |
| ScRNA-seq Data (10x Genomics) | This paper | GEO: GSE182997 |
| ScRNA-seq Data (96-well Plates) | This paper | GEO: GSE182997 |
|
| ||
| Experimental models: Organisms/strains | ||
|
| ||
| Mouse: B6. Cg-Gt(ROSA)26Sortm14(CAG-tdTomato)Hze/J | The Jackson Laboratory | Strain: B6.Cg-Gt(ROSA)26Sortm14 (CAG-tdTomato)Hze/J JAX: 007,914 |
| Mouse: C57BL/6J | The Jackson Laboratory | JAX: 000,664 |
| Mouse: Gli1-CreERT | The Jackson Laboratory | Strain: Gli1tm3(cre/ERT2)Alj/J JAX: 007,913 |
| Mouse: Tg(Scx-GFP)1Stzr | Tan et al., 202059 | MGI:3717419 |
|
| ||
| Software and algorithms | ||
|
| ||
| Adobe Illustrator CC2018 | Adobe Systems Inc. | RRID: SCR_014199 |
| Bruker CTAn MicroCT | N/A | Bruker Software |
| Cellranger | 10x Genomics | https://support.10xgenomics.com/single-cell-gene-expression/software/pipelines/latest/what-is-cell-ranger |
| Colaboratory (Colab) | N/A | https://colab.research.google.com/ |
| ComplexHeatmap V2.5.6 | Gu et al., 201668 | https://jokergoo.github.io/ComplexHeatmap-reference/book/ |
| CTVOX | N/A | Bruker Software |
| DataViewer | N/A | Bruker Software |
| FCS Express™ 7 | N/A | De Novo Software |
| ggplot2 | N/A | https://ggplot2.tidyverse.org/ |
| ImageJ | N/A | https://imagej.nih.gov/ij/ |
| Monocle | Trapnell et al., 201469 | http://cole-trapnell-lab.github.io/monocle-release/ |
| Prism-GraphPad | N/A | GraphPad Software |
| Python | Python Software Foundation | https://www.python.org/ |
| R version 3.6.3 | The R Foundation | https://www.r-project.org |
| SCENIC | Aibar et al., 201731 | https://github.com/aertslab/SCENIC |
| scVelo | Bergen et al. 202034 | https://github.com/theislab/scvelo |
| Seurat v3.1.0 | Butler et al., 2018 70 | https://satijalab.org/seurat/ |
| ssGSEA | Wang et al., 201733 | https://www.sciencedirect.com/science/article/pii/S1535610817302532#mmc9 |
| SkyScan’s Volumetric NRecon Reconstruction Software | N/A | Bruker Software |
| Velocyto v0.17.16 | La Manno et al., 201871 | http://velocyto.org/ |
|
| ||
| Other | ||
|
| ||
| RNAscope Probe- Mm-Cebpd | ACDbio | Cat #556661 |
| RNAscope Probe- Mm-Cd34-C3 | ACDbio | Cat #319161-C3 |
| RNAscope Probe- Mm-Foxa3 | ACDbio | Cat #573031 |
| RNAscope Probe- Mm-Ly6a-C2 | ACDbio | Cat #427571-C2 |
| RNAscope Probe- Mm-Mef2a | ACDbio | Cat #443911 |
| RNAscope Probe- Mm-Nfatc1-C3 | ACDbio | Cat #436161-C3 |
| RNAscope Probe- Mm-Runx2-C3 | ACDbio | Cat #414021-C3 |
| Tap Windows | Electron Microscopy Sciences | Cat #62800-72 |
Highlights.
Enthesis cell transcriptomes were defined at single-cell resolution
Transcription factor regulons were identified for enthesis cell differentiation
Enthesis Gli1+ progenitors showed clonogenicity and multipotency
Gli1+ progenitors transplanted to enthesis injuries improved healing
ACKNOWLEDGMENTS
This work was funded in part by NIH R01 AR055580. We would like to thank Caisheng Lu and Chingyuan Chen from Flow Cytometry Core at Columbia Center for Translational Immunology for helping with FACS. The scRNA-seq experiments were conducted at the Single Cell Analysis Core of Columbia Genome Center and the Biomedical Informatics Resources at Columbia University, supported by the National Center for Advancing Translational Sciences through NIH UL1 TR001873. Confocal imaging was performed at the Confocal and Specialized Microscopy Shared Resource of the Herbert Irving Comprehensive Cancer Center at Columbia University, supported by NIH P30 CA013696 (National Cancer Institute). The authors thank Siyu He for scientific discussions on RNA velocity analysis.
Footnotes
SUPPLEMENTAL INFORMATION
Supplemental information can be found online at https://doi.org/10.1016/j.stem.2022.11.007.
DECLARATION OF INTERESTS
The authors declare no competing interests.
REFERENCES
- 1.Lu HH, and Thomopoulos S. (2013). Functional attachment of soft tissues to bone: development, healing, and tissue engineering. Annu. Rev. Biomed. Eng 15, 201–226. 10.1146/annurev-bioeng-071910-124656. [DOI] [PMC free article] [PubMed] [Google Scholar]
- 2.Schett G, Lories RJ, D’Agostino MA, Elewaut D, Kirkham B, Soriano ER, and McGonagle D. (2017). Enthesitis: from pathophysiology to treatment. Nat. Rev. Rheumatol 13, 731–741. 10.1038/nrrheum.2017.188. [DOI] [PubMed] [Google Scholar]
- 3.Derwin KA, Galatz LM, Ratcliffe A, and Thomopoulos S. (2018). Enthesis repair: challenges and opportunities for effective tendon-to-bone healing. The Journal of bone and joint surgery. J. Bone Joint Surg. Am 100, e109. 10.2106/jbjs.18.00200. [DOI] [PMC free article] [PubMed] [Google Scholar]
- 4.Thomopoulos S, Genin GM, and Galatz LM (2010). The development and morphogenesis of the tendon-to-bone insertion What development can teach us about healing. J. Musculoskelet. Neuronal Interact 10, 35–45. [PMC free article] [PubMed] [Google Scholar]
- 5.Genin GM, Kent A, Birman V, Wopenka B, Pasteris JD, Marquez PJ, and Thomopoulos S. (2009). Functional grading of mineral and collagen in the attachment of tendon to bone. Biophys. J 97, 976–985. 10.1016/j.bpj.2009.05.043. [DOI] [PMC free article] [PubMed] [Google Scholar]
- 6.Carpenter J, Thomopoulos S, Flanagan C, DeBano C, and Soslowsky L. (1998). Rotator cuff defect healing: a biomechanical and histologic analysis in an animal model. J. Shoulder Elbow Surg 7, 599–605. 10.1016/s1058-2746(98)90007-6. [DOI] [PubMed] [Google Scholar]
- 7.Thomopoulos S, Williams GR, Gimbel JA, Favata M, and Soslowsky LJ (2003). Variation of biomechanical, structural, and compositional properties along the tendon to bone insertion site. J. Orthop. Res 21, 413–419. 10.1016/s0736-0266(03)0057-3. [DOI] [PubMed] [Google Scholar]
- 8.Harryman DT, Hettrich CM, Smith KL, Campbell B, Sidles JA, and Matsen FA III (2003). A prospective multipractice investigation of patients with full-thickness rotator cuff tears: the importance of comorbidities, practice, and other covariables on self-assessed shoulder function and health status. J. Bone Joint Surg. Am 85, 690–696. 10.2106/00004623-200304000-00016. [DOI] [PubMed] [Google Scholar]
- 9.Galatz LM, Ball CM, Teefey SA, Middleton WD, and Yamaguchi K(2004). The outcome and repair integrity of completely arthroscopically repaired large and massive rotator cuff tears. J. Bone Joint Surg. Am 86, 219–224. 10.2106/00004623-200402000-00002. [DOI] [PubMed] [Google Scholar]
- 10.Alvarez-Dolado M, Pardal R, Garcia-Verdugo JM, Fike JR, Lee HO, Pfeffer K, Lois C, Morrison SJ, and Alvarez-Buylla A. (2003). Fusion of bone-marrow-derived cells with Purkinje neurons, cardiomyocytes and hepatocytes. Nature 425, 968–973. 10.1038/nature02069. [DOI] [PubMed] [Google Scholar]
- 11.Jiang Y, Jahagirdar BN, Reinhardt RL, Schwartz RE, Keene CD, Ortiz-Gonzalez XR, Reyes M, Lenvik T, Lund T, Blackstad M, et al. (2002). Pluripotency of mesenchymal stem cells derived from adult marrow. Nature 418, 41–49. 10.1038/nature00870. [DOI] [PubMed] [Google Scholar]
- 12.Graham GJ, Wright EG, Hewick R, Wolpe SD, Wilkie NM, Donaldson D, Lorimore S, and Pragnell IB (1990). Identification and characterization of an inhibitor of haemopoietic stem cell proliferation. Nature 344, 442–444. 10.1038/344442a0. [DOI] [PubMed] [Google Scholar]
- 13.Chan CK, Gulati GS, Sinha R, Tompkins JV, Lopez M, Carter AC, Ransom RC, Reinisch A, Wearda T, Murphy M, et al. (2018). Identification of the human skeletal stem cell. Cell 175, 43–56.e21. 10.1016/j.cell.2018.07.029. [DOI] [PMC free article] [PubMed] [Google Scholar]
- 14.Bi Y, Ehirchiou D, Kilts TM, Inkson CA, Embree MC, Sonoyama W, Li L, Leet AI, Seo BM, Zhang L, et al. (2007). Identification of tendon stem/progenitor cells and the role of the extracellular matrix in their niche. Nat. Med 13, 1219–1227. 10.1038/nm1630. [DOI] [PubMed] [Google Scholar]
- 15.Millar NL, Silbernagel KG, Thorborg K, Kirwan PD, Galatz LM, Abrams GD, Murrell GAC, McInnes IB, and Rodeo SA (2021). Tendinopathy. Nat. Rev. Dis. Primers 7, 1. 10.1038/s41572-020-00234-1. [DOI] [PubMed] [Google Scholar]
- 16.Felsenthal N, Rubin S, Stern T, Krief S, Pal D, Pryce BA, Schweitzer R, and Zelzer E. (2018). Development of migrating tendon-bone attachments involves replacement of progenitor populations. Development 145, dev165381. 10.1242/dev.165381. [DOI] [PMC free article] [PubMed] [Google Scholar]
- 17.Wang Y, Zhang X, Huang H, Xia Y, Yao Y, Mak AFT, Yung PSH, Chan KM, Wang L, Zhang C, et al. (2017). Osteocalcin expressing cells from tendon sheaths in mice contribute to tendon repair by activating Hedgehog signaling. Elife 6, e30474. 10.7554/eLife.30474. [DOI] [PMC free article] [PubMed] [Google Scholar]
- 18.Schwartz AG, Long F, and Thomopoulos S. (2015). Enthesis fibrocartilage cells originate from a population of Hedgehog-responsive cells modulated by the loading environment. Development 142, 196–206. 10.1242/dev.112714. [DOI] [PMC free article] [PubMed] [Google Scholar]
- 19.Schwartz AG, Galatz LM, and Thomopoulos S. (2017). Enthesis regeneration: a role for Gli1+ progenitor cells. Development 144, 1159–1164. 10.1242/dev.139303. [DOI] [PMC free article] [PubMed] [Google Scholar]
- 20.Degirmenci B, Valenta T, Dimitrieva S, Hausmann G, and Basler K. (2018). GLI1-expressing mesenchymal cells form the essential Wnt-secreting niche for colon stem cells. Nature 558, 449–453. 10.1038/s41586-018-0190-3. [DOI] [PubMed] [Google Scholar]
- 21.Kramann R, Schneider R, DiRocco D, Machado F, Fleig S, Bondzie P, Henderson J, Ebert B, and Humphreys B. (2015). Perivascular Gli1+ progenitors are key contributors to injury-induced organ fibrosis. Cell Stem Cell 16, 51–66. 10.1016/j.stem.2014.11.004. [DOI] [PMC free article] [PubMed] [Google Scholar]
- 22.Schneider RK, Mullally A, Dugourd A, Peisker F, Hoogenboezem R, Van Strien PM, Bindels EM, Heckl D, Busche G, Fleck D, et al. (2017). Gli1(+) Mesenchymal Stromal Cells Are a Key Driver of Bone Marrow Fibrosis and an Important Cellular Therapeutic Target. Cell Stem Cell 20, 785–800.e8. 10.1016/j.stem.2017.03.008. [DOI] [PMC free article] [PubMed] [Google Scholar]
- 23.Shi Y, He G, Lee WC, McKenzie JA, Silva MJ, and Long F. (2017). Gli1 identifies osteogenic progenitors for bone formation and fracture repair. Nat. Commun 8, 2043. 10.1038/s41467-017-02171-2. [DOI] [PMC free article] [PubMed] [Google Scholar]
- 24.Zhao H, Feng J, Seidel K, Shi S, Klein O, Sharpe P, and Chai Y(2014). Secretion of shh by a neurovascular bundle niche supports mesenchymal stem cell homeostasis in the adult mouse incisor. Cell Stem Cell 14, 160–173. 10.1016/j.stem.2013.12.013. [DOI] [PMC free article] [PubMed] [Google Scholar]
- 25.Fang F, Schwartz AG, Moore ER, Sup ME, and Thomopoulos S(2020). Primary cilia as the nexus of biophysical and hedgehog signaling at the tendon enthesis. Sci. Adv 6, eabc1799. 10.1126/sciadv.abc1799. [DOI] [PMC free article] [PubMed] [Google Scholar]
- 26.Schwartz AG, Pasteris JD, Genin GM, Daulton TL, and Thomopoulos S. (2012). Mineral distributions at the developing tendon enthesis. PLoS One 7, e48630. 10.1371/journal.pone.0048630. [DOI] [PMC free article] [PubMed] [Google Scholar]
- 27.De Micheli AJ, Laurilliard EJ, Heinke CL, Ravichandran H, Fraczek P, Soueid-Baumgarten S, De Vlaminck I, Elemento O, and Cosgrove BD (2020). Single-Cell Analysis of the Muscle Stem Cell Hierarchy Identifies Heterotypic Communication Signals Involved in Skeletal Muscle Regeneration. Cell Rep. 30, 3583–3595.e5. 10.1016/j.celrep.2020.02.067. [DOI] [PMC free article] [PubMed] [Google Scholar]
- 28.Harvey T, Flamenco S, and Fan CM (2019). A Tppp3(+)Pdgfra(+) tendon stem cell population contributes to regeneration and reveals a shared role for PDGF signalling in regeneration and fibrosis. Nat. Cell Biol 21, 1490–1503. 10.1038/s41556-019-0417-z. [DOI] [PMC free article] [PubMed] [Google Scholar]
- 29.Tikhonova AN, Dolgalev I, Hu H, Sivaraj KK, Hoxha E, Cuesta-Dominguez A, Pinho S, Akhmetzyanova I, Gao J, Witkowski M, et al. (2019). The bone marrow microenvironment at single-cell resolution. Nature 569, 222–228. 10.1038/s41586-019-1104-8. [DOI] [PMC free article] [PubMed] [Google Scholar]
- 30.Blitz E, Sharir A, Akiyama H, and Zelzer E. (2013). Tendon-bone attachment unit is formed modularly by a distinct pool of Scx-and Sox9-positive progenitors. Development 140, 2680–2690. 10.1242/dev.093906. [DOI] [PubMed] [Google Scholar]
- 31.Aibar S, González-Blas CB, Moerman T, Huynh-Thu VA, Imrichova H, Hulselmans G, Rambow F, Marine JC, Geurts P, Aerts J, et al. (2017). SCENIC: single-cell regulatory network inference and clustering. Nat. Methods 14, 1083–1086. 10.1038/nmeth.4463. [DOI] [PMC free article] [PubMed] [Google Scholar]
- 32.Long F, and Ornitz DM (2013). Development of the endochondral skeleton. Cold Spring Harb. Perspect. Biol 5, a008334. 10.1101/cshperspect.a008334. [DOI] [PMC free article] [PubMed] [Google Scholar]
- 33.Wang Q, Hu B, Hu X, Kim H, Squatrito M, Scarpace L, et al. (2017). Tumor evolution of glioma-intrinsic gene expression subtypes associates with immunological changes in the microenvironment. Cancer Cell 32, 42–56.e6. 10.1016/j.ccell.2017.06.003. [DOI] [PMC free article] [PubMed] [Google Scholar]
- 34.Bergen V, Lange M, Peidli S, Wolf FA, and Theis FJ (2020). Generalizing RNA velocity to transient cell states through dynamical modeling. Nat. Biotechnol 38, 1408–1414. 10.1038/s41587-020-0591-3. [DOI] [PubMed] [Google Scholar]
- 35.Cherry C, Maestas DR, Han J, Andorko JI, Cahan P, Fertig EJ, Garmire LX, and Elisseeff JH (2021). Computational reconstruction of the signalling networks surrounding implanted biomaterials from single-cell transcriptomics. Nat. Biomed. Eng 5, 1228–1238. 10.1038/s41551-021-00770-5. [DOI] [PMC free article] [PubMed] [Google Scholar]
- 36.Stoeckius M, Hafemeister C, Stephenson W, Houck-Loomis B, Chattopadhyay PK, Swerdlow H, Satija R, and Smibert P. (2017). Simultaneous epitope and transcriptome measurement in single cells. Nat. Methods 14, 865–868. 10.1038/nmeth.4380. [DOI] [PMC free article] [PubMed] [Google Scholar]
- 37.Chen Z, Lu Y, Zhang K, Xiao Y, Lu J, and Fan R. (2019). Multiplexed, sequential secretion analysis of the same single cells reveals distinct effector response dynamics dependent on the initial basal state. Adv. Sci 6, 1801361. 10.1002/advs.201801361. [DOI] [PMC free article] [PubMed] [Google Scholar]
- 38.Leupin O, Kramer I, Collette NM, Loots GG, Natt F, Kneissel M, and Keller H. (2007). Control of the SOST bone enhancer by PTH using MEF2 transcription factors. J. Bone Miner. Res 22, 1957–1967. 10.1359/jbmr.070804. [DOI] [PMC free article] [PubMed] [Google Scholar]
- 39.Novince CM, Michalski MN, Koh AJ, Sinder BP, Entezami P, Eber MR, Pettway GJ, Rosol TJ, Wronski TJ, Kozloff KM, and McCauley LK (2012). Proteoglycan 4: a dynamic regulator of skeletogenesis and parathyroid hormone skeletal anabolism. J. Bone Miner. Res 27, 11–25. 10.1002/jbmr.508. [DOI] [PMC free article] [PubMed] [Google Scholar]
- 40.Feng H, Xing W, Han Y, Sun J, Kong M, Gao B, Yang Y, Yin Z, Chen X, Zhao Y, et al. (2020). Tendon-derived cathepsin K–expressing progenitor cells activate Hedgehog signaling to drive heterotopic ossification. J. Clin. Investig 130, 6354–6365. 10.1172/jci132518. [DOI] [PMC free article] [PubMed] [Google Scholar]
- 41.Khan SK, Yadav PS, Elliott G, Hu DZ, Xu R, and Yang Y. (2018). Induced GnasR201H expression from the endogenous Gnas locus causes fibrous dysplasia by up-regulating Wnt/β-catenin signaling. Proc. Natl. Acad. Sci. USA 115, E418–E427. 10.1073/pnas.1714313114. [DOI] [PMC free article] [PubMed] [Google Scholar]
- 42.Liu H, Xu J, and Jiang R. (2019). Mkx-Deficient Mice Exhibit Hedgehog Signaling–Dependent Ectopic Ossification in the Achilles Tendons. J. Bone Miner. Res 34, 557–569. 10.1002/jbmr.3630. [DOI] [PMC free article] [PubMed] [Google Scholar]
- 43.Gracey E, Burssens A, Cambré I, Schett G, Lories R, McInnes IB, Asahara H, and Elewaut D. (2020). Tendon and ligament mechanical loading in the pathogenesis of inflammatory arthritis. Nat. Rev. Rheumatol 16, 193–207. 10.1038/s41584-019-0364-x. [DOI] [PMC free article] [PubMed] [Google Scholar]
- 44.Fang F, and Lake SP (2016). Multiscale mechanical integrity of human supraspinatus tendon in shear after elastin depletion. J. Mech. Behav. Biomed. Mater 63, 443–455. 10.1016/j.jmbbm.2016.06.032. [DOI] [PubMed] [Google Scholar]
- 45.Fang F, and Lake SP (2015). Multiscale strain analysis of tendon subjected to shear and compression demonstrates strain attenuation, fiber sliding, and reorganization. J. Orthop. Res 33, 1704–1712. 10.1002/jor.22955. [DOI] [PubMed] [Google Scholar]
- 46.Fang F, and Lake SP (2017). Multiscale mechanical evaluation of human supraspinatus tendon under shear loading after glycosaminoglycan reduction. J. Biomech. Eng 139, 0710131–0710138. 10.1115/1.4036602. [DOI] [PMC free article] [PubMed] [Google Scholar]
- 47.Best KT, Nichols AEC, Knapp E, Hammert WC, Ketonis C, Jonason JH, Awad HA, and Loiselle AE (2020). NF-kB activation persists into the remodeling phase of tendon healing and promotes myofibroblast survival. Sci. Signal 13, eabb7209. 10.1126/scisignal.abb7209. [DOI] [PMC free article] [PubMed] [Google Scholar]
- 48.Zhong L, Yao L, Tower RJ, Wei Y, Miao Z, Park J, Shrestha R, Wang L, Yu W, Holdreith N, et al. (2020). Single cell transcriptomics identifies a unique adipose lineage cell population that regulates bone marrow environment. Elife 9, e54695. 10.7554/eLife.54695. [DOI] [PMC free article] [PubMed] [Google Scholar]
- 49.Sugimoto Y, Takimoto A, Akiyama H, Kist R, Scherer G, Nakamura T, Hiraki Y, and Shukunami C. (2013). Scx+/Sox9+ progenitors contribute to the establishment of the junction between cartilage and tendon/ligament. Development 140, 2280–2288. 10.1242/dev.096354. [DOI] [PubMed] [Google Scholar]
- 50.Kronenberg HM (2003). Developmental regulation of the growth plate. Nature 423, 332–336. 10.1038/nature01657. [DOI] [PubMed] [Google Scholar]
- 51.Akiyama H, Chaboissier MC, Martin JF, Schedl A, and de Crombrugghe B. (2002). The transcription factor Sox9 has essential roles in successive steps of the chondrocyte differentiation pathway and is required for expression of Sox5 and Sox6. Genes Dev. 16, 2813–2828. 10.1101/gad.1017802. [DOI] [PMC free article] [PubMed] [Google Scholar]
- 52.Harada S.i., and Rodan GA (2003). Control of osteoblast function and regulation of bone mass. Nature 423, 349–355. 10.1038/nature01660. [DOI] [PubMed] [Google Scholar]
- 53.Wei J, Shimazu J, Makinistoglu M, Maurizi A, Kajimura D, Zong H, Takarada T, Iezaki T, Pessin J, Hinoi E, and Karsenty G. (2015). Glucose Uptake and Runx2 Synergize to Orchestrate Osteoblast Differentiation and Bone Formation. Cell 161, 1576–1591. 10.1016/j.cell.2015.05.029. [DOI] [PMC free article] [PubMed] [Google Scholar]
- 54.Havis E, and Duprez D. (2020). EGR1 Transcription Factor is a Multifaceted Regulator of Matrix Production in Tendons and Other Connective Tissues. Int. J. Mol. Sci 21, 1664. 10.3390/ijms21051664. [DOI] [PMC free article] [PubMed] [Google Scholar]
- 55.Lejard V, Blais F, Guerquin MJ, Bonnet A, Bonnin MA, Havis E, Malbouyres M, Bidaud CB, Maro G, Gilardi-Hebenstreit P, et al. (2011). EGR1 and EGR2 involvement in vertebrate tendon differentiation. J. Biol. Chem 286, 5855–5867. 10.1074/jbc.M110.153106. [DOI] [PMC free article] [PubMed] [Google Scholar]
- 56.Adam RC, Yang H, Ge Y, Infarinato NR, Gur-Cohen S, Miao Y, Wang P, Zhao Y, Lu CP, Kim JE, et al. (2020). NFI transcription factors provide chromatin access to maintain stem cell identity while preventing unintended lineage fate choices. Nat. Cell Biol 22, 640–650. 10.1038/s41556-020-0513-0. [DOI] [PMC free article] [PubMed] [Google Scholar]
- 57.Kult S, Olender T, Osterwalder M, Markman S, Leshkowitz D, Krief S, Blecher-Gonen R, Ben-Moshe S, Farack L, Keren-Shaul H, et al. (2021). Bi-fated tendon-to-bone attachment cells are regulated by shared enhancers and KLF transcription factors. Elife 10, e55361. 10.7554/eLife.55361. [DOI] [PMC free article] [PubMed] [Google Scholar]
- 58.Chen Q, Lee CE, Denard B, and Ye J. (2014). Sustained induction of collagen synthesis by TGF-beta requires regulated intramembrane proteolysis of CREB3L1. PLoS One 9, e108528. 10.1371/journal.pone.0108528. [DOI] [PMC free article] [PubMed] [Google Scholar]
- 59.Tan GK, Pryce BA, Stabio A, Brigande JV, Wang C, Xia Z, Tufa SF, Keene DR, and Schweitzer R. (2020). Tgfb signaling is critical for maintenance of the tendon cell fate. Elife 9, e52695. 10.7554/eLife.52695. [DOI] [PMC free article] [PubMed] [Google Scholar]
- 60.Ionescu A, Kozhemyakina E, Nicolae C, Kaestner K, Olsen B, and Lassar A. (2012). FoxA family members are crucial regulators of the hypertrophic chondrocyte differentiation program. Dev. Cell 22, 927–939. 10.1016/j.devcel.2012.03.011. [DOI] [PMC free article] [PubMed] [Google Scholar]
- 61.Asagiri M, Sato K, Usami T, Ochi S, Nishina H, Yoshida H, Morita I, Wagner EF, Mak TW, Serfling E, and Takayanagi H. (2005). Autoamplification of NFATc1 expression determines its essential role in bone homeostasis. J. Exp. Med 202, 1261–1269. 10.1084/jem.20051150. [DOI] [PMC free article] [PubMed] [Google Scholar]
- 62.Kramann R, Goettsch C, Wongboonsin J, Iwata H, Schneider R, Kuppe C, Kaesler N, Chang-Panesso M, Machado F, Gratwohl S, et al. (2016). Adventitial MSC-like Cells Are Progenitors of Vascular Smooth Muscle Cells and Drive Vascular Calcification in Chronic Kidney Disease. Cell Stem Cell 19, 628–642. 10.1016/j.stem.2016.08.001. [DOI] [PMC free article] [PubMed] [Google Scholar]
- 63.Men Y, Wang Y, Yi Y, Jing D, Luo W, Shen B, Stenberg W, Chai Y, Ge WP, Feng JQ, and Zhao H. (2020). Gli1+ Periodontium Stem Cells Are Regulated by Osteocytes and Occlusal Force. Dev. Cell 54, 639–654.e6. 10.1016/j.devcel.2020.06.006. [DOI] [PubMed] [Google Scholar]
- 64.Lindvall O, Kokaia Z, and Martinez-Serrano A. (2004). Stem cell therapy for human neurodegenerative disorders–how to make it work. Nat. Med 10, S42–S50. 10.1038/nm1064. [DOI] [PubMed] [Google Scholar]
- 65.Amakye D, Jagani Z, and Dorsch M. (2013). Unraveling the therapeutic potential of the Hedgehog pathway in cancer. Nat. Med 19, 1410–1422. 10.1038/nm.3389. [DOI] [PubMed] [Google Scholar]
- 66.van den Brink SC, Sage F, Vértesy Á, Spanjaard B, Peterson-Maduro J, Baron CS, Robin C, and Van Oudenaarden A. (2017). Single-cell sequencing reveals dissociation-induced gene expression in tissue subpopulations. Nat. Methods 14, 935–936. 10.1038/nmeth.4437. [DOI] [PubMed] [Google Scholar]
- 67.Fang F, Sup M, Luzzi A, Ferrer X, and Thomopoulos S. (2022). Hedgehog signaling underlying tendon and enthesis development and pathology. Matrix Biol. 105, 87–103. 10.1016/j.matbio.2021.12.001. [DOI] [PMC free article] [PubMed] [Google Scholar]
- 68.Gu Z, Eils R, and Schlesner M. (2016). Complex heatmaps reveal patterns and correlations in multidimensional genomic data. Bioinformatics 32, 2847–2849. 10.1093/bioinformatics/btw313. [DOI] [PubMed] [Google Scholar]
- 69.Trapnell C, Cacchiarelli D, Grimsby J, Pokharel P, Li S, Morse M, et al. (2014). The dynamics and regulators of cell fate decisions are revealed by pseudotemporal ordering of single cells. Nat. Biotechnol 32, 381–386. 10.1038/nbt.2859. [DOI] [PMC free article] [PubMed] [Google Scholar]
- 70.Butler A, Hoffman P, Smibert P, et al. (2018). Integrating single-cell transcriptomic data across different conditions, technologies, and species. Nat. Biotechnol 36, 411–420. 10.1038/nbt.4096. [DOI] [PMC free article] [PubMed] [Google Scholar]
- 71.La Manno G, Soldatov R, Zeisel A, Braun E, Hochgerner H, Petukhov V, et al. (2018). RNA velocity of single cells. Nature560, 494–498. 10.1038/s41586-018-0414-6. [DOI] [PMC free article] [PubMed]
- 72.Barry ER, Morikawa T, Butler BL, Shrestha K, de La Rosa R, et al. (2013). Restriction of intestinal stem cell expansion and the regenerative response by YAP. Nature 493, 106–110. 10.1038/nature11693. [DOI] [PMC free article] [PubMed] [Google Scholar]
Associated Data
This section collects any data citations, data availability statements, or supplementary materials included in this article.
Supplementary Materials
Data Availability Statement
All single-cell datasets created during this study have been deposited in the Gene Expression Omnibus (GEO) and are publicly available at NCBI GEO: GSE182997. This paper does not report original code. Any additional information required to re-analyze the data in the paper is available from the lead contact upon request.