

Abstract
Objective:
To estimate the excess maternal health services utilization and direct maternal medical expenditures associated with hypertensive disorders during pregnancy and one year postpartum among women with private insurance in the United States.
Study design:
We used 2008–2014 IBM MarketScan® Commercial Databases to identify women aged 15–44 who had a pregnancy resulting in live birth during 1/1/09–12/31/13 and were continuously enrolled with non-capitated or partially capitated coverage from 12 months before pregnancy through 12 months after delivery. Hypertensive disorders identified by diagnosis codes were categorized into three mutually exclusive types: preeclampsia and eclampsia, chronic hypertension, and gestational hypertension. Multivariate negative binomial and generalized linear models were used to estimate service utilization and expenditures, respectively.
Main outcome measures:
Per person excess health services utilization and medical expenditures during pregnancy and one year postpartum associated with hypertensive disorders (in 2014 US dollars).
Results:
Women with preeclampsia and eclampsia, chronic hypertension, and gestational hypertension had $9,389, $6,041, and $2,237 higher mean medical expenditures compared to women without hypertensive disorders ($20,252), respectively (ps < 0.001). One-third (36%) of excess expenditure associated with hypertensive disorders during pregnancy was attributable to outpatient services.
Conclusions:
Hypertensive disorders during pregnancy were associated with significantly higher health services utilization and medical expenditures among privately insured women with hypertensive disorders. Medical expenditures varied by types of hypertensive disorders. Stakeholders can use this information to assess the potential economic benefits of interventions that prevent these conditions or their complications.
Keywords: Health care cost, Payment, Hypertensive disorders, Pregnancy, Claims
1. Introduction
Hypertensive disorders during pregnancy affected 10.8% of delivery hospitalizations in the United States in 2014, including chronic hypertension (1.7%), gestational hypertension (3.8%), pre-eclampsia and eclampsia (4.7%) [1]. Untreated preeclampsia may result in potentially fatal complications, such as eclampsia, liver rupture, stroke, pulmonary edema, or kidney failure [2]. In addition, fetal complications include growth restriction, preterm birth, stillbirth, and neonatal death. During 2011–2013, 7.4% of pregnancy-related deaths in the United States were attributed to hypertensive disorders in pregnancy [3]. Rates of hypertensive disorders during pregnancy have increased steadily since 1994 [1,4]. Hypertensive disorders during pregnancy are preventable. When they occur appropriate medical management and treatment may reduce adverse maternal and infant outcomes.
Previous studies of hypertensive disorders among US pregnant women mostly captured these conditions at delivery using hospital discharge records [5]. Since hypertensive disorders during pregnancy are also treated in outpatient settings, especially chronic hypertension and gestational hypertension, reporting only the inpatient delivery costs could miss costs associated with these disorders. A few studies estimated the costs associated with chronic hypertension, preeclampsia and eclampsia, or hypertensive complications during pregnancy and shortly after delivery separately, using claims data [6–9]. One study examined the cost of delivery hospitalizations associated with different types of hypertensive disorders using data from the Health Care Cost and Utilization Project (HCUP) [1]. However, HCUP hospital discharge data are not linkable across multiple inpatient admissions. Also, HCUP data use charge/cost ratios to estimate facility fees, which could vary by different services, and do not include physician fees [10].
We used claims data to estimate health care utilization and maternal expenditures during pregnancy and 1 year postpartum by type of hypertensive disorder among privately insured women. These results can inform stakeholders, such as payers (i.e., employers and health plans), policy makers, and program managers (e.g. Perinatal Quality Collaboratives) of the financial resources associated with hypertensive disorders during pregnancy and their complications. The results can also be used to understand the relative costs of resources for management of these conditions as well as estimate the potential medical cost savings from implementing interventions that prevent either the occurrence of these conditions or the occurrence of sequelae, e.g., through effective treatments of hypertensive disorders [9]. Since the resources needed and potential cost savings from prevention strategies might differ by disorder [11–13], we present cost information stratified by disorder type.
2. Methods
2.1. Dataset
We used 2008–2014 data from the IBM MarketScan® Commercial database to conduct a retrospective cohort analysis. This database contains claims for employees and their dependents who have employer-sponsored health insurance. It includes patient-level data on enrollment, inpatient and outpatient services, and outpatient drug claims and allows longitudinal linkage of claims [14]. MarketScan data have been used extensively in studying healthcare use and costs, including maternal and infant health [15].
2.2. Study population
The study cohort consisted of women aged 15–44 years who had ≥ 1 pregnancy ending between January 1, 2009 and December 31, 2013, were continuously enrolled (allowing < 30 days of coverage gap) in a full fee-for-service (FFS) or partially capitated Preferred Provider Organization (PPO) plan from 12 months before the beginning of the pregnancy through 12 months after the end of pregnancy, and had prescription drug coverage. We excluded women in fully capitated plans because imputed payments might not accurately reflect healthcare use [16]. Pregnancies were identified based on a algorithm using International Classification of Diseases, Ninth Revision, Clinical Modification (ICD-9-CM) diagnosis and procedure codes and diagnosis related group codes, Healthcare Common Procedure Coding System, and Current Procedural Terminology (CPT) procedure codes [17]. The last menstrual period (LMP) date, indicating the beginning of a pregnancy, was derived by subtracting the estimated gestational age associated with the pregnancy outcome from the date for the end of pregnancy. For this analysis, only first pregnancies ending in live birth were included to avoid within-person bias [6,7]. In sensitivity analyses we examined whether the restrictions on enrollment and coverage affected the characteristics of the study population. We also examined the effect of two alternative continuous enrollment restrictions, i.e., from the beginning of the pregnancy through 3 months postpartum and from 9 months before pregnancy through 6 months postpartum, on women’s characteristics and the excess expenditures associated with hypertensive disorders.
2.3. Defining hypertensive disorders during pregnancy
Hypertensive disorders during pregnancy (i.e., from the estimated date of LMP through 6 weeks postpartum [18]) were defined using ICD-9-CM codes [Table A1] [4]. Patients had to have ≥ 1 diagnosis in the inpatient setting and ≥ 2diagnoses in the outpatient setting ≥ 30 days apart for chronic hypertension and ≥ 7 days apart for other hypertensive conditions. We first grouped these disorders into three mutually exclusive categories based on the 2013 Report of the American College of Obstetricians and Gynecologists’ Task Force on Hypertension in Pregnancy [10], category 1: preeclampsia and eclampsia; category 2: chronic hypertension (not in category 1); and category 3: gestational hypertension (not in the first two categories). Within category 1, we further categorized three mutually exclusive disorder types by severity: preeclampsia or eclampsia superimposed upon chronic hypertension, preeclampsia with severe features and eclampsia, and preeclampsia without severe features [4], for a total of five types of hypertensive disorders.
Because hypertensive disorders during pregnancy are often associated with severe medical complications, we assessed medical costs associated with these complications. For this purpose, we categorized patients into two groups: those with and without severe maternal morbidities (SMMs) that are relevant to hypertensive disorders, including acute myocardial infarction, acute renal failure, adult respiratory distress syndrome, cardiac arrest/ventricular fibrillation, disseminated intravascular coagulation, puerperal cerebrovascular disorders, pulmonary edema/acute heart failure, blood transfusion, hysterectomy, and ventilation (excluding eclampsia as an SMM) [19]. The SMM complications were defined by ICD-9-CM/CPT-4 codes as defined by the Centers for Disease Control and Prevention (CDC) and were applied from the start of pregnancy to 6 weeks postpartum [19].
2.4. Outcome measures
Health services utilization was measured as the number of inpatient admissions, total length of stay from all admissions, and number of office visits during pregnancy until the 1 year postpartum (claims incurred on the same day were counted as one visit). Maternal healthcare expenditures were defined as total payments, including insurance payments and patient out-of-pocket payments. We estimated expenditures by service type: inpatient admission (including emergency visits that resulted in hospitalization), outpatient visits (e.g., doctor’s office, hospital outpatient facility, emergency room not ending in inpatient admission, or other outpatient facility), and prescription drugs. Expenditures were adjusted to 2014 US dollars based on the Personal Consumption Expenditure Health Component Price Index [20].
2.5. Statistical analysis
We used a multivariate generalized linear model (GLM) with log link and gamma distribution to estimate overall expenditures and expenditures by service type (inpatient admissions, outpatient visits, and prescription drugs) among pregnant women with and without hypertension disorders [21]. Excess expenditures associated with hypertensive disorders were calculated as the predicted margins between the expenditures for pregnant women with and without hypertensive disorders adjusted for covariates. Expenditures associated with the various subcategories were also estimated.
Poisson regression was used to estimate the relative risk of experiencing SMMs among women with and without hypertensive disorders. Among women with hypertensive disorders, we used the GLM model to calculate excess expenditures in women with SMMs compared to those without SMMs. In all multivariable regression models, covariates included age categories, rural/urban residence, census region, health plan type (full FFS or PPO), and chronic conditions, including chronic and gestational diabetes, and other heart diseases not included in SMM. All statistical analyses were conducted using STATA v.14.
This analysis only included de-identified data; it was therefore deemed by CDC not to be human subject research and did not require Institutional Review Board approval.
3. Results
3.1. Prevalence of hypertensive disorders
Among 237,305 pregnant women who met the study criteria [See Fig. A1 for study flow diagram), 13.95% had hypertensive disorders during pregnancy. Among women with hypertensive disorders, 45.16% had preeclampsia or eclampsia (overall prevalence in the study population: 6.30%), 30.75% had chronic hypertension without preeclampsia or eclampsia (4.29%), and 24.09% had gestational hypertension only (3.36%) (Table 1). Compared to women without hypertensive disorders, women with hypertensive disorders were slightly older, less likely to live in metropolitan areas, more likely to live in the South, and more likely to have other chronic conditions (Table 1). The characteristics of women with and without enrollment and coverage restrictions were similar. Relaxing the continuous enrollment requirement increased the sample size, but the characteristics of participants were similar (data available upon request).
Fig. A1.
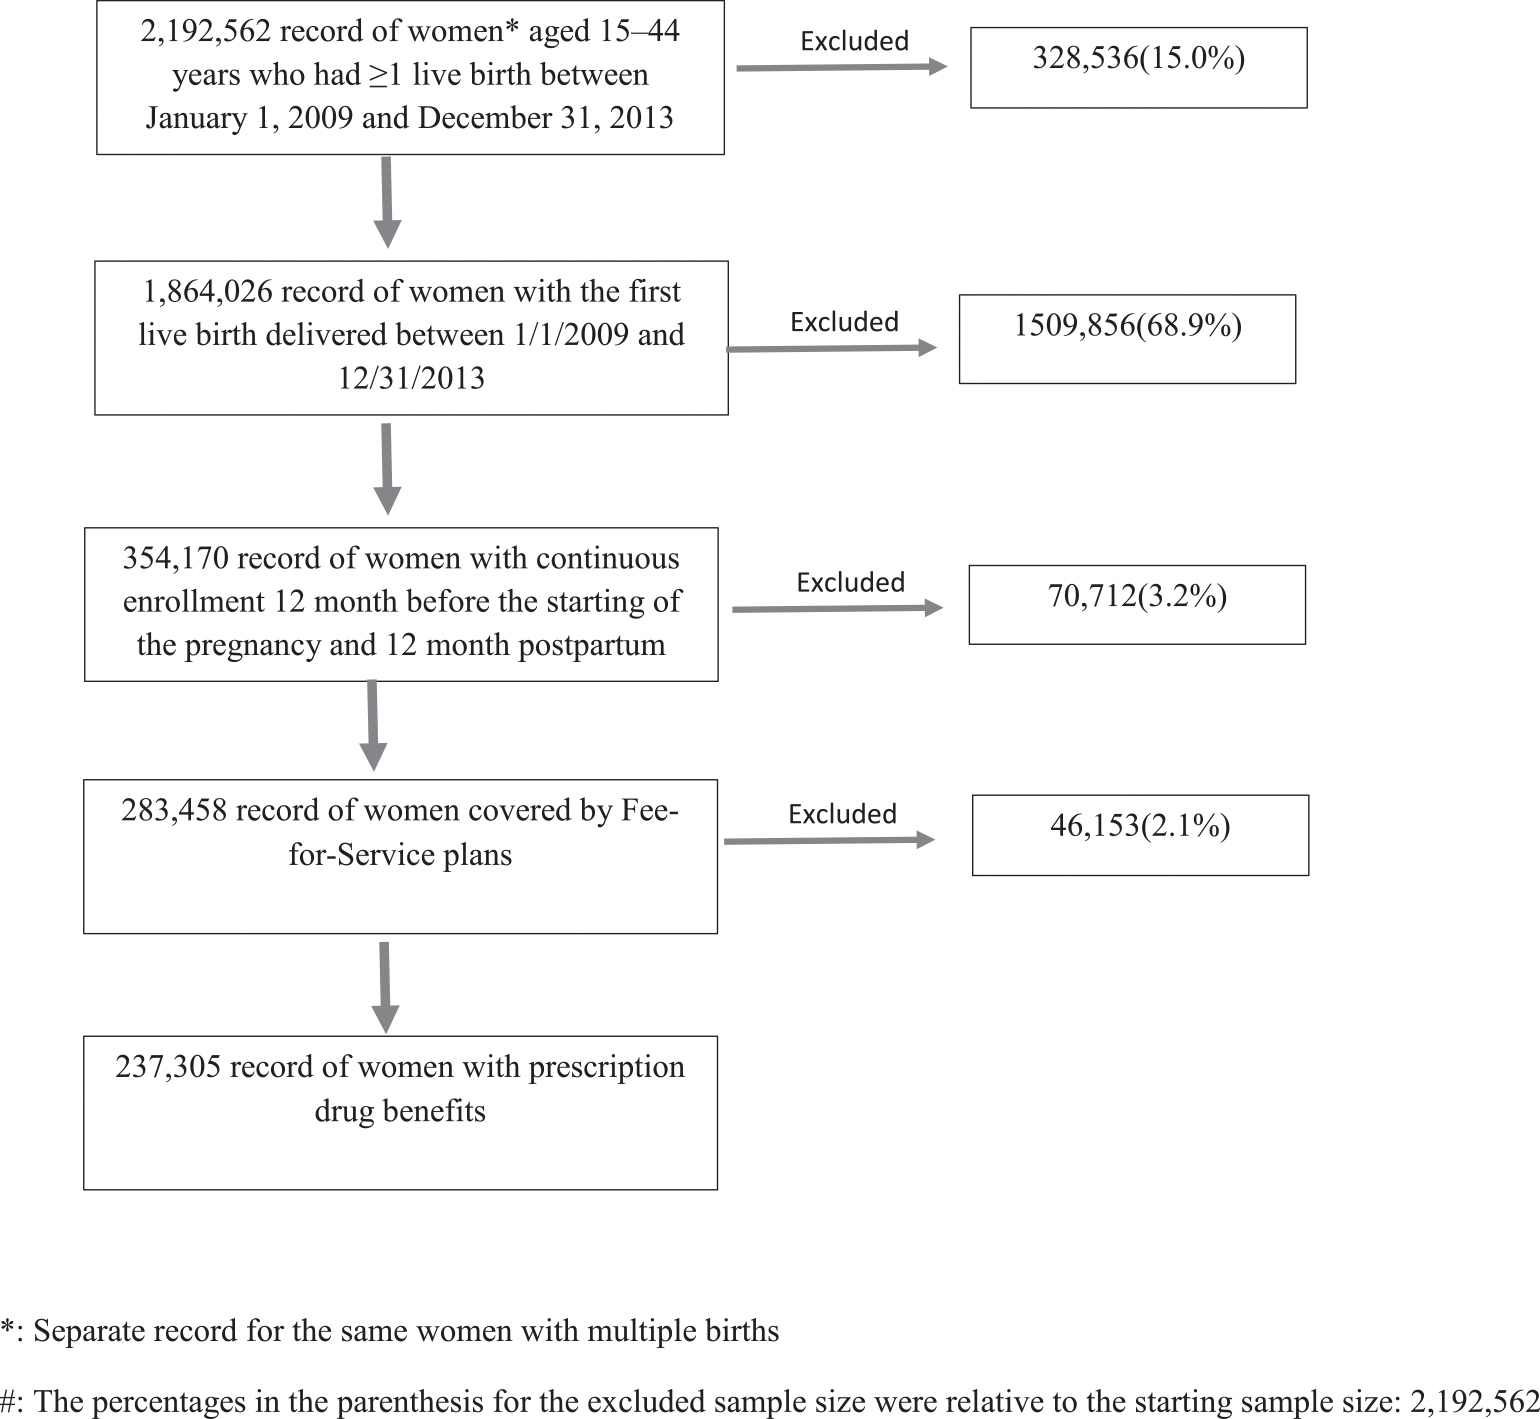
Flowchart for Deriving the Final Sample Size#.
Table 1.
Medical and demographic characteristics of the 237,305 women with a live birth, by hypertensive disorder status, 2009–2013.
| All | With hypertensive disorder | Without hypertensive disorder | |
|---|---|---|---|
| N = 237,305 | N = 31,890 | N = 205,415 | |
| % | % | % | |
| Mean (95% CIs) | Mean (95% CIs) | Mean (95% CIs) | |
|
| |||
| Type of hypertensive disorderb | 13.95(13.81–14.09) | 100(100–100) | |
| Preeclampsia/eclampsia | 6.3(6.2–6.4) | 45.17(44.64–45.71) | |
| Chronic hypertension with superimposed preeclampsia/eclampsia | 0.92(0.88–0.96) | 6.58(6.31–6.85) | |
| Preeclampsia with severe features and eclampsia | 2.11(2.05–2.17) | 15.11(14.73–15.5) | |
| Preeclampsia without severe features | 3.28(3.2–3.35) | 23.48(23.02–23.93) | |
| Chronic hypertension | 4.29(4.21–4.37) | 30.77(30.27–31.26) | |
| Gestational hypertension | 3.36(3.28–3.43) | 24.06(23.6–24.52) | |
| Age group (years) | |||
| 15–18 | 4.25(4.17–4.34) | 3.45(3.26–3.65) | 4.38(4.3–4.47) |
| 19–24 | 14.05(13.91–14.19) | 13.08(12.71–13.44) | 14.21(14.05–14.36) |
| 25–29 | 28.72(28.53–28.9) | 28.35(27.87–28.84) | 28.78(28.58–28.97) |
| 30–34 | 33.45(33.26–33.64) | 31.97(31.47–32.47) | 33.69(33.49–33.9) |
| 35–39 | 16.04(15.89–16.19) | 18.45(18.04–18.87) | 15.65(15.49–15.81) |
| 40–44 | 3.4(3.33–3.48) | 4.64(4.41–4.86) | 3.21(3.13–3.28) |
| Metropolitan statistical area | 84.42(84.27–84.57) | 82.09(81.68–82.51) | 84.8(84.64–84.95) |
| Preferred provider organization | 74.26(74.09–74.44) | 73.78(73.31–74.26) | 74.34(74.15–74.53) |
| Region | |||
| Northeast | 13.26(13.12–13.4) | 11.16(10.82–11.5) | 13.6(13.45–13.75) |
| Northcentral | 26.15(25.97–26.33) | 24.91(24.44–25.37) | 26.35(26.16–26.54) |
| South | 42.53(42.33–42.73) | 48.94(48.4–49.48) | 41.49(41.28–41.71) |
| West | 16.41(16.26–16.56) | 13.11(12.75–13.47) | 16.95(16.79–17.11) |
| Comorbidities | |||
| Chronic/unspecified/non-gestational diabetes | 2.93(2.86–3) | 6.55(6.28–6.82) | 2.35(2.28–2.41) |
| Gestational diabetes | 8.5(8.39–8.61) | 13.54(13.17–13.91) | 7.69(7.57–7.8) |
| Mental health disorders | 7.03(6.92–7.13) | 8.47(8.17–8.77) | 6.79(6.68–6.9) |
| Heart disease | 0.73(0.7–0.77) | 1.39(1.26–1.51) | 0.62(0.59–0.66) |
CI: confidence intervals.
: p<=0.001 comparing all characteristics between women with hypertensive disorders and women without hypertensive disorders using t-test.
: We grouped hypertensive disorders into three mutually exclusive categories based on the 2013 Report of the American College of Obstetricians and Gynecologists’ Task Force on Hypertension in Pregnancy [10]. We used a hierarchy based on ICD-9 diagnostic codes during pregnancy. Category 1: preeclampsia and eclampsia; category 2: chronic hypertension (not in category 1); category 3: gestational hypertension (not in the first two categories). Within category 1, we further categorized as three mutually exclusive categories by severity: superimposed preeclampsia and eclampsia, preeclampsia with severe features and eclampsia, and preeclampsia without severe features [2].
3.2. Health care utilization
Compared to women without hypertensive disorders, women with hypertensive disorders had slightly higher numbers of hospitalizations during pregnancy and 1-year postpartum and higher total inpatient days (all ps < 0.001), especially for those with chronic hypertension with superimposed preeclampsia or eclampsia (3.43 more days) and preeclampsia with severe features and eclampsia (2.79 more days). Women with hypertensive disorders also had significantly higher numbers of excess outpatient visits; women with chronic hypertension with superimposed preeclampsia or eclampsia had the highest number of outpatient visits (9.57 more), followed by women with chronic hypertension (7.17 more). Women with gestational hypertension only had the fewest excess outpatient visits (2.65 more) (Table 2).
Table 2.
Estimates of mean health services use among pregnant women with and without hypertensive disorders*
| Status of hypertension disorder | Inpatient visits | Length of Stay | Outpatient visits | |||
|---|---|---|---|---|---|---|
|
|
|
|
||||
| Predicted No. | Excess No. # | Predicted days | Excess days # | Predicted No. | Excess No. # | |
|
| ||||||
| With hypertensive disorders: | ||||||
| Preeclampsia and eclampsia | 1.22 (1.2–1.24) | 0.17 (0.15–0.19) | 4.83 (4.79–4.88) | 2.11 (2.06–2.16) | 28.59 (28.35–28.84) | 5.80 (5.55–6.06) |
| Chronic hypertension with superimposed preeclampsia/eclampsia | 1.35 (1.31–1.4) | 0.30 (0.25–0.35) | 6.15 (6–6.31) | 3.43 (3.27–3.58) | 32.35 (31.63–33.08) | 9.57 (8.84–10.3) |
| Preeclampsia with severe features and eclampsia | 1.24 (1.21–1.27) | 0.18 (0.15–0.22) | 5.51 (5.42–5.61) | 2.79 (2.69–2.88) | 27.8 (27.38–28.21) | 5.01 (4.59–5.43) |
| Preeclampsia without severe features | 1.17 (1.15–1.2) | 0.12 (0.1–0.15) | 4.03 (3.97–4.09) | 1.30 (1.24–1.36) | 28.05 (27.71–28.39) | 5.26 (4.92–5.6) |
| Chronic hypertension | 1.14 (1.12–1.16) | 0.09 (0.07–0.11) | 3.44 (3.39–3.49) | 0.71 (0.67–0.76) | 29.96 (29.65–30.28) | 7.17 (6.86–7.49) |
| Gestational hypertension | 1.09 (1.07–1.11) | 0.04 (0.01–0.06) | 3.13 (3.09–3.18) | 0.41 (0.36–0.46) | 25.44 (25.14–25.75) | 2.65 (2.34–2.96) |
| Any hypertensive disorders | 1.17 (1.15–1.18) | 0.11 (0.1–0.12) | 4.0 (3.97–4.03) | 1.27 (1.24–1.3) | 28.26 (28.09–28.42) | 5.46 (5.29–5.63) |
| Without any hypertensive disorder | 1.05 (1.05–1.06) | 2.73 (2.72–2.74) | 22.79 (22.74–22.85) | |||
Notes: Values in parentheses are 95% confidence intervals.
: All the estimates were statistically different from zero at p < 0.001 level.
=Excess number or days for those with type of hypertensive disorder compared with those without any hypertensive disorders.
3.3. Per capita costs associated with hypertension
Women with hypertensive disorders during pregnancy had significantly higher total medical expenditures compared to women without hypertensive disorders (Table 3). Adjusted for covariates, women with any hypertensive disorder incurred $26,893 in medical expenditures, which was 32% ($6,637) higher than that for women without any hypertensive condition ($20,252). Compared to women without any hypertensive condition during pregnancy, those with chronic hypertension with superimposed preeclampsia or eclampsia had the highest excess expenditures ($16,021, 79% higher), followed by women with preeclampsia with severe features and eclampsia ($11,584, 57% higher), preeclampsia without severe features ($6,143, 30% higher), chronic hypertension ($6,041, 30% higher), and gestational hypertension ($2,289, 11% higher). Although the majority of excess expenditures associated with hypertensive disorders were incurred during pregnancy and 2 months postpartum, the 3rd through 12th month postpartum period also incurred excess expenditure associated with hypertensive disorders. Estimates of the excess medical expenditures associated with hypertensive disorders were similar regardless of continuous enrollment requirements (data available upon request).
Table 3.
Estimates of Mean Predicted Excess Total Annual Per Capita Medical Expenditure (2014 US Dollars) among Pregnant Women with Hypertensive Disorders*
| Status of hypertension disorder | During pregnancy and delivery& | Postpartum period$ | During pregnancy and postpartum period | |||
|---|---|---|---|---|---|---|
|
|
|
|
||||
| Predicted cost | Excess cost# | Predicted cost | Excess cost# | Predicted cost | Excess cost# | |
|
| ||||||
| With hypertensive disorders: | ||||||
| Preeclampsia and eclampsia | 25,495 (25,168–25,822) | 8,224 (7,891–8,556) | 4,160 (3,937–4,382) | 1,180 (954–1,407) | 29,640 (29,201–30,080) | 9,389 (8,942–9,836) |
| Chronic hypertension with superimposed preeclampsia/eclampsia | 30,732 (29,705–31,759) | 13,464 (12,435–14,493) | 5,557 (4,783–6,331) | 2,578 (1,803–3,354) | 36,268 (34,872–37,664) | 16,021 (14,622–17,419) |
| Preeclampsia with severe features and eclampsia | 27,525 (26,920–28,130) | 10,257 (9,649–10,865) | 4,319 (3,923–4,715) | 1,340 (942–1,739) | 31,832 (31,026–32,638) | 11,584 (10,775–12,394) |
| Preeclampsia without severe features | 22,736 (22,335–23,137) | 5,468 (5,063–5,873) | 3,669 (3,399–3,939) | 691 (418–964) | 26,390 (25,854–26,926) | 6,143 (5,601–6,684) |
| Chronic hypertension | 21,970 (21,627–22,313) | 4,699 (4,350–5,047) | 4,311 (4,031–4,591) | 1,332 (1,048–1,616) | 26,293 (25,819–26,767) | 6,041 (5,560–6,523) |
| Gestational hypertension | 19,361 (19,020–19,702) | 2,090 (1,744–2,435) | 3,133 (2,903–3,363) | 154 (−80–387) | 22,488 (22,031–22,946) | 2,237 (1,773–2,701) |
| Any hypertensive disorders | 22,938 (22,738–23,139) | 5,664 (5,455–5,873) | 3,959 (3,815–4,102) | 978 (828–1,128) | 26,893 (26,621–27,165) | 6,637 (6,352–6,921) |
| Without any hypertensive disorder | 17,271 (17,211–17,332) | 2,979 (2,935–3,023) | 20,252 (20,169–20,334) | |||
Notes: Values in parentheses are 95% confidence intervals.
: All the estimates were statistically different from zero at p < 0.001 level.
=Excess cost for those with the type of hypertensive disorder compared with those without any hypertensive disorders.
: from pregnancy to 2 months postpartum
: 3 month postpartum to 12 month postpartum.
By service type, inpatient care accounted for more than half (55%) of excess expenditures associated with having any hypertensive disorders during pregnancy, followed by outpatient care, which accounted for more than one-third (36%) of excess expenditures. Prescription drugs contributed only 9% of excess expenditures (Table 4). The proportion of excess expenditures from inpatient admissions was highest (68%) for preeclampsia with severe features and eclampsia. For excess expenditures associated with chronic hypertension, inpatient care accounted for 40% and outpatient care accounted for 50%. More than 92% of excess inpatient expenditures and more than 70% of the excess outpatient expenditures occurred during pregnancy and 2 months postpartum (Table A2).
Table 4.
Estimates of Mean Annual Per Capita Excess Total Medical Expenditures (2014 US Dollars) of Hypertensive Disorders among Pregnant Women by Service Type*
| Status of hypertension disorder | Inpatient Care | Outpatient Care | Prescription Drugs | ||||||
|---|---|---|---|---|---|---|---|---|---|
|
|
|
|
|||||||
| Predicted Exp. | Excess Exp. # | Share & | Predicted Exp. | Excess Exp. # | Share & | Predicted Exp. | Excess Exp. # | Share & | |
|
| |||||||||
| With hypertensive disorder: | |||||||||
| Preeclampsia and eclampsia | 17,954 (17,659 – 18,249) | 5,769 (5,469 – 6,069) | 61% | 9,401 (9,188 – 9,614) | 2,869 (2,652 – 3,086) | 30% | 2,327 (2,152 – 2,501) | 816 (640–992) | 9% |
| Chronic hypertension with superimposed preeclampsia/eclampsia | 21,198 (20,290 – 22,106) | 9,015 (8,105 – 9,924) | 56% | 12,383 (11,673 – 13,093) | 5,852 (5,141 – 6,564) | 36% | 2,871 (2,316 – 3,426) | 1,361 (805 – 1,917) | 8% |
| Preeclampsia with severe features and eclampsia | 20,084 (19,518 – 20,650) | 7,901 (7,333 – 8,469) | 68% | 9,220 (8,872 – 9,568) | 2,689 (2,339 – 3,039) | 23% | 2,619 (2,284 – 2,954) | 1,109 (774 – 1,445) | 9% |
| Preeclampsia without severe features | 15,686 (15,332 – 16,041) | 3,503 (3,145 – 3,861) | 57% | 8,689 (8,426 – 8,952) | 2,158 (1,893 – 2,424) | 35% | 1,986 (1,783 – 2,190) | 476 (271–681) | 8% |
| Chronic hypertension | 14,581 (14,289 – 14,872) | 2,396 (2,099 – 2,692) | 40% | 9,519 (9,257 – 9,781) | 2,988 (2,722 – 3,253) | 50% | 2,095 (1,905 – 2,284) | 584 (392–776) | 10% |
| Gestational hypertension | 13,445 (13,142 – 13,748) | 1,260 (952 – 1,567) | 56% | 7,372 (7,143 – 7,601) | 840 (608 – 1,073) | 38% | 1,647 (1,477 – 1,816) | 136 (35–307) | 6% |
| Any hypertensive disorder | 15,835 (15,657 – 16,012) | 3,648 (3,462 – 3,834) | 55% | 8,949 (8,810 – 9,087) | 2,415 (2,270 – 2,559) | 36% | 2,093 (1,985 – 2,200) | 581 (470–692) | 9% |
| Without any hypertensive disorder | 12,185 (12,130 – 12,240) | 6,532 (6,491 – 6,573) | 1,511 (1,476 – 1,546) | ||||||
Notes: Values in parentheses are 95% confidence intervals.
: All the estimates were statistically different from zero at p < 0.001 level.
=Excess expenditures for those with the type of hypertensive disorder compared with those without any hypertensive disorders.
Exp = expenditures.
share of the excess expenditure of the service over the total excess costs associated with the hypertensive disorder.
3.4. Hypertensive disorders and SMMs
A larger proportion of women with hypertensive disorders developed SMMs compared to women without hypertensive disorders (Table 5). The adjusted relative risk (RR) for having an SMM for women with hypertensive disorders overall compared to those without was 1.27 (95% CI: 1.23–1.32, p < 0.001); the RRs were 1.70 (1.59–1.82, p < 0.001) for preeclampsia with severe features and eclampsia, 1.29 (1.21–1.37, p < 0.001) for preeclampsia without severe features, 1.14 (1.07–1.21, p < 0.001) for chronic hypertension, and 1.07 (1.0–1.15, p = 0.06) for gestational hypertension. Among those with any hypertensive disorders, those with SMMs incurred $10,892 more medical expenditure compared with those without SMMs; compared to those without SMMs, predicted excess expenditure associated with SMMs was $13,316 for women with preeclampsia and eclampsia, $9,625 for women with chronic hypertension, and $4,022 for women with gestational hypertension (Table 6).
Table 5.
Prevalence of Severe Maternal Morbidities (SMM) among Women with and without Hypertension During Pregnancy
| Status of hypertension disorder | Mean | RR |
|---|---|---|
|
| ||
| With hypertensive disorder: | ||
| Any hypertensive disorder | 11.32 | 1.27*** (1.23–1.32) |
| Preeclampsia/eclampsia | 13.09 | 1.47*** (1.41–1.53) |
| Chronic hypertension with superimposed preeclampsia/eclampsia | 14.28 | 1.56*** (1.4–1.73) |
| Preeclampsia with severe features and eclampsia | 15.23 | 1.7*** (1.59–1.82) |
| Preeclampsia without severe features | 11.39 | 1.29*** (1.21–1.37) |
| Chronic hypertension | 10.36 | 1.14*** (1.07–1.21) |
| Gestational hypertension | 9.23 | 1.07 (1–1.15) |
| Without hypertensive disorder | 8.92 | Reference group |
Notes: Values in parentheses are 95% confidence intervals.
RR = Risk ratio.
: p < 0.001.
Table 6.
Estimates of Mean Annual Per Capita Excess Total Medical Expenditures with and without Severe Maternal Morbidities (SMM) among Pregnant Women with Hypertensive Disorders*.
| Type hypertension disorder | With SMMs | Without SMMs | Excess# |
|---|---|---|---|
|
| |||
| Any hypertensive disorders | 37,009 (35,854–38,163) | 26,116 (25,819–26,414) | 10,892 (9,699–12,085) |
| Preeclampsia and eclampsia | 41,723 (39,780–43,666) | 28,407 (27,881–28,932) | 13,316 (11,301–15,332) |
| Chronic hypertension with superimposed preeclampsia/eclampsia | 60,084 (52,313–67,854) | 34,406 (32,595–36,218) | 25,677 (17,682–33,672) |
| Preeclampsia with severe features and eclampsia | 45,969 (42,630–49,307) | 30,022 (29,069–30,976) | 15,946 (12,457–19,435) |
| Preeclampsia without severe features | 31,125 (29,635–32,614) | 25,841 (25,389–26,293) | 5,284 (3,725–6,843) |
| Chronic hypertension | 35,934 (34,089–37,780) | 26,310 (25,842–26,777) | 9,625 (7,718–11,532) |
| Gestational hypertension | 25,762 (24,421–27,102) | 21,740 (21,373–22,107) | 4,022 (2,633–5,410) |
: All the estimates were statistically different from zero at p < 0.001 level.
=Excess expenditures for those with SMMs compared with those without SMMs among the study population with the type of hypertensive disorders.
4. Discussion
4.1. Principal findings
We found that women with hypertensive disorders during pregnancy had substantially higher medical expenditure during pregnancy and 1 year post-partum. Among the five types of hypertensive disorders, chronic hypertension with superimposed preeclampsia or eclampsia was associated with the highest expenditures, followed by preeclampsia with severe features and eclampsia, then by either preeclampsia without severe features or chronic hypertension, and finally, gestational hypertension.
4.2. Results of the study in the context of other observations
Rates of hypertensive disorders during pregnancy were in general comparable with those reported in previous study among delivery hospitalizations using 2014 HCUP data: 6.3% vs. 4.7% for preeclampsia and eclampsia and 3.4% vs. 3.8% for gestational hypertension [1]. The prevalence of chronic hypertension in our study, 4.3%, is lower than the 7.7% prevalence of hypertension among women of reproductive age in NHANES data, but comparable to the 4.2% prevalence of anti-hypertensive pharmacologic therapy in that study [22]. Our cost estimates were comparable to those of two previous studies that used claims data to estimate maternal costs associated with specific hypertensive disorders during pregnancy, e.g., chronic hypertension and preeclampsia [6,8].
Our results showed that women with hypertensive disorders were more likely to develop other SMMs compared to women without hypertensive disorders and incurred higher expenditures. Complications and expenditures can be reduced by providing timely and appropriate treatment for these conditions; the California Perinatal Quality Care Collaborative achieved a 12% decrease in severe complications among women with preeclampsia and severe features/eclampsia during 2013–2014 with improved treatment [23]. The National Partnership for Maternal Safety issued a consensus document that recommends coordination and standardization of care provided to women with severe hypertension during pregnancy and the postpartum period [24]. Implementation of these bundles is expected to reduce maternal morbidity and mortality from hypertensive disorders in pregnancy [24].
Although inpatient expenditures accounted for the majority of excess expenditures, a substantial amount was attributed to outpatient services, especially for women with chronic hypertension. This is not surprising, given that chronic hypertension is usually diagnosed before 20 weeks of gestation and managed in outpatient settings, and also required antepartum fetal monitoring [11]. Our findings highlight the importance of reporting expenditures from both outpatient and inpatient services.
4.3. Strengths and limitations
Our analysis provides a comprehensive picture of medical expenditures for different types of hypertensive disorders and by service type, using a large commercial claims dataset for a longitudinal cohort of pregnant women from all US regions. Our study has several limitations. It is difficult to identify exactly when pregnancies started [25–28]. Identification of timing of pregnancies was based on a claims-based algorithm, which may be imprecise [17]. However, since the same limitation exists for women with and without hypertensive disorders, any bias is expected to be nondifferential. Hypertensive disorders might have been misidentified using claims data. However, our estimated rate of chronic hypertension based on claims was comparable with the prevalence of treated hypertension among women of reproductive age in NHANES [22]. New clinical guidelines categorized hypertensive disorders during pregnancy slightly differently from what we defined using claims data [29,30]. We did not assess the timing of the onset of the SMM relative to the onset of the hypertensive disorder; however the majority of SMMs occur at delivery [31]. If the SMM preceded or was concurrent with the diagnosis of the hypertensive disorder, then excess costs may not be entirely attributable to hypertensive disorders. The study population was limited to women who had employer-sponsored insurance, were enrolled in a non-fully capitated plan, had longer continuous coverage, and are not geographically representative. Therefore, the results may not be generalizable to all pregnant women in the United States covered by private health plans and do not reflect expenditures among women covered by Medicaid. Given that more than half of deliveries were covered by Medicaid, a future study might be conducted among Medicaid population [32]. Medical expenditures for services not covered by insurance were not captured; therefore, total expenditures may be underestimated. Also, estimates of outpatient visits may be underestimated due to global billing and bundled payment for maternity care. In addition, we included only the first pregnancy in the study period. Complications in previous pregnancies such as SMM may impact management of subsequent pregnancies and thus management and health care utilization. Our study only included expenditures through 1 year postpartum. Women with hypertensive disorders are at higher risk of developing cardiovascular disease and other chronic conditions later in life [33].
Lastly, the estimates may have been affected by confounding. Although we controlled for a number of potential confounders related to demographics, health plan membership, geographic location, and underlying conditions, we were unable to control for variables not available in claims data, such as obesity, gestational weight gain, and parity. Pre-pregnancy obesity can jointly contribute to development of hypertensive disorders and to other conditions such as diabetes. Initiatives to address unhealthy weight such as physical activity are crucial towards reducing both the health and economic burdens of hypertensive disorders in pregnant women.
5. Conclusions
Despite these limitations, we were able to estimate healthcare utilization and costs associated with hypertensive disorders during pregnancy and 1 year postpartum for privately insured women in the United States. Our study shows that hypertensive disorders during pregnancy are associated with significant excess expenditures and pose a large financial burden on the US healthcare system. Acute conditions such as preeclampsia with severe features and eclampsia had the highest excess expenditure. Women with chronic hypertension and gestational hypertension also had higher expenditures compared to women without these conditions. Interventions can target both primary prevention of these conditions and secondary prevention of their complications. Primary prevention interventions could target risk factors such as obesity and excessive weight gain to prevent onset of hypertensive disorders [34]. Strategies for secondary prevention include early diagnosis, and timely, evidence-based, and standardized treatment to prevent progression to severe disease and complications. Estimates of use of resources by type of condition and care setting (outpatient versus inpatient), in combination with evidence on the effectiveness of specific interventions, could inform resource allocation for initiatives to address hypertensive disorders during pregnancy and understand the relative cost-effectiveness of prevention and treatment strategies.
Acknowledgement
We thank Ms. April L. Summers, at National Center for Chronic Disease Prevention and Heaelth Promotion at Centers for Disease Control and Prevention, for providing support on identifying pregnancy episodes and providing critical comments on a previous version of the paper.
The results from the preliminary analyses for the project was presented as a poster at the 2018 American Public Health Association Annual Meeting, November 15–19, San Diego, CA.
Appendix
Table A1.
ICD-9 codes for Hypertensive Disorders, Pregnancy, Pregnancy Complications, and Comorbidities
| Conditions | Codes |
|---|---|
|
| |
| Hypertensive Disorders | |
| Preeclampsia/eclampsia superimposed on chronic hypertension | 642.7x |
| Eclampsia/severe peeclampsia | 642.5x, 642.6x |
| Mild preeclampsia | 642.4x |
| Chronic hypertension | 642.0x, 642.1x, 642.2x, 642.9x, 401.x, 402.x. 403.x, 403.x, 404.x, 405.x |
| Gestational hypertension | 642.3x |
| Chronic/unspecified/non gestational diabetes | 250.x, 790.29, 648.0 |
| Gestational diabetes | 648.8x |
| Complicated vascular heart disease | 394.0x–394.2x, 394.9x, 395.0x, 395.1x, 395.2x, 395.9x, 396.0x–396.3x, 396.8x, 396.9x, 397.0x, 397.1x, 397.9x, 424.0x–424.3x, 424.9x, 785.2x, 785.3x, V42.2x, V43.3x |
Table A2.
Estimates of Mean Annual Per Capita Excess #Medical Expenditures (2014 US Dollars) of Hypertensive Disorders among Pregnant Women by Service Type and Pregnancy Period*
| Status of hypertension disorder | Inpatient Care | Outpatient Care | ||||
|---|---|---|---|---|---|---|
|
|
|
|||||
| Excess Exp.-During pregnancy and delivery & | Excess Exp.-postpartum $ | Share + | Excess Exp.-During pregnancy and delivery & | Excess Exp.-postpartum $ | Share + | |
|
| ||||||
| With hypertensive disorder: | ||||||
| Preeclampsia and eclampsia | 5,538 (5,276–5,801) | 242 (110–374) | 96% | 2,266 (2,125–2,406) | 610 (487–732) | 79% |
| Chronic hypertension with superimposed preeclampsia/eclampsia | 8,507 (7,717–9,298) | 490 (25–954) | 94% | 4,276 (3,821–4,731) | 1,551 (1,124–1,978) | 73% |
| Preeclampsia with severe features and eclampsia | 7,677 (7,177–8,176) | 248 (18–479) | 97% | 2,101 (1,874–2,328) | 607 (402–812) | 78% |
| Preeclampsia without severe features | 3,344 (3,031–3,658) | 169 (7–331) | 96% | 1,815 (1,639–1,990) | 351 (203–500) | 84% |
| Chronic hypertension | 2,210 (1,952–2,468) | 208 (56–360) | 92% | 2,142 (1,975–2,309) | 849 (687–1,011) | 72% |
| Gestational hypertension | 1,265 (995–1,536) | −25 (−136–86) | 100% | 724 (575–874) | 122 (−13–257) | 86% |
| Any hypertensive disorder | 3,488 (3,326–3,650) | 167 (85–249) | 96% | 1,856 (1,763–1,948) | 565 (481–649) | 77% |
Notes: Values in parentheses are 95% confidence intervals.
: All the estimates were statistically different from zero at p < 0.001 level; pregnancy and at delivery period: from pregnancy to 2 months postpartum; postpartum period: 3 month postpartum to 12 month postpartum.
=Excess expenditures for those with the type of hypertensive disorder compared with those without any hypertensive disorders.
Exp = expenditures
: from pregnancy to 2 months postpartum
: 3 month postpartum to 12 month postpartum.
share of the excess expenditure of the service during pregnancy over the total excess costs associated with the hypertensive disorder for that service.
Footnotes
Conflict of interest
None.
Financial disclosures
None.
Disclaimer
The findings and conclusions in this report are those of the authors and do not necessarily represent the official position of the Centers for Disease Control and Prevention, US Department of Health and Human Services.
References
- [1].Fingar KR, Mabry-Hernandez I, Ngo-Metzger Q, Wolff T, Steiner CA, Elixhauser A, Delivery Hospitalizations Involving Preeclampsia and Eclampsia, 2006–2014: Statistical Brief #222, Healthcare Cost and Utilization Project (HCUP) Statistical Briefs, Agency for Healthcare Research and Quality (US), Rockville (MD), 2017. [PubMed] [Google Scholar]
- [2].Mol BWJ, Roberts CT, Thangaratinam S, Magee LA, de Groot CJM, Hofmeyr GJ, Pre-eclampsia, Lancet 387 (10022) (2016) 999–1011, 10.1016/S0140-6736(15)00070-7. [DOI] [PubMed] [Google Scholar]
- [3].Creanga AA, Syverson C, Seed K, Callaghan WM, Pregnancy-related mortality in the United States, 2011–2013, Obstetrics Gynecol. 130 (2) (2017) 366–373. [DOI] [PMC free article] [PubMed] [Google Scholar]
- [4].Kuklina EV, Ayala C, Callaghan WM, Hypertensive disorders and severe obstetric morbidity in the United States, Obstetrics Gynecol. 113 (6) (2009) 1299–1306. [DOI] [PubMed] [Google Scholar]
- [5].Roberts CL, Ford JB, Algert CS, Antonsen S, Chalmers J, Cnattingius S, Gokhale M, Kotelchuck M, Melve KK, Langridge A, Morris C, Morris JM, Nassar N, Norman JE, Norrie J, Sorensen HT, Walker R, Weir CJ, Population-based trends in pregnancy hypertension and pre-eclampsia: an international comparative study, e000101, BMJ Open 1 (1) (2011), 10.1136/bmjopen-2011-000101. [DOI] [PMC free article] [PubMed] [Google Scholar]
- [6].Law A, McCoy M, Lynen R, Curkendall SM, Gatwood J, Juneau PL, Landsman-Blumberg P, The additional cost burden of preexisting medical conditions during pregnancy and childbirth, J. Women’s Health 24 (11) (2015) 924–932, 10.1089/jwh.2014.4951. [DOI] [PubMed] [Google Scholar]
- [7].Law A, McCoy M, Lynen R, Curkendall SM, Gatwood J, Juneau PL, Landsman-Blumberg P, The prevalence of complications and healthcare costs during pregnancy, J. Med. Econ. 18 (7) (2015) 533–541, 10.3111/13696998.2015.1016229. [DOI] [PubMed] [Google Scholar]
- [8].Stevens W, Shih T, Incerti D, Ton TGN, Lee HC, Peneva D, Macones GA, Sibai BM, Jena AB, Short-term costs of preeclampsia to the United States health care system, Am. J. Obstet. Gynecol. 217 (3) (2017) 237–248.e16. [DOI] [PubMed] [Google Scholar]
- [9].Fox A, McHugh S, Browne J, Kenny LC, Fitzgerald A, Khashan AS, Dempsey E, Fahy C, O’Neill C, Kearney PM, Estimating the Cost of Preeclampsia in the Healthcare System: Cross-Sectional Study Using Data From SCOPE Study (Screening for Pregnancy End Points), Hypertension (Dallas, Tex.: 1979) 70(6) (2017) 1243–1249. [DOI] [PubMed] [Google Scholar]
- [10].Peterson C, Xu L, Florence C, Grosse SD, Annest JL, Professional fee ratios for US hospital discharge data, Med. Care 53 (10) (2015) 840–849. [DOI] [PMC free article] [PubMed] [Google Scholar]
- [11].Hypertension in pregnancy, Report of the American College of Obstetricians and Gynecologists’ Task Force on Hypertension in Pregnancy, Obstet. Gynecol. 122 (5) (2013) 1122–1131. [DOI] [PubMed] [Google Scholar]
- [12].Ankumah NE, Sibai BM, Chronic hypertension in pregnancy: diagnosis, management, and outcomes, Clin. Obstet. Gynecol. 60 (1) (2017) 206–214. [DOI] [PubMed] [Google Scholar]
- [13].Guedes-Martins L, Chronic hypertension and pregnancy, Adv. Exp. Med. Biol. 956 (2017) 395–407. [DOI] [PubMed] [Google Scholar]
- [14].Truven Health Analytics IBM Watson Health, The Truven Health MarketScan Databases for life sciences researchers, 2017.
- [15].Truven Health Analytics an IBM Company, MarketScan Studies-abbreviated bibliography, 2018.
- [16].Shrestha SS, Zhang P, Thompson TJ, Gregg EW, Albright A, Imperatore G, Medical expenditures associated with diabetes among youth with medicaid coverage, Med. Care 55 (7) (2017) 646–653. [DOI] [PMC free article] [PubMed] [Google Scholar]
- [17].Ailes EC, Simeone RM, Dawson AL, Petersen EE, Gilboa SM, Using insurance claims data to identify and estimate critical periods in pregnancy: an application to antidepressants, Birth defects research Part A, Clin. Mol. Teratol. 106 (11) (2016) 927–934. [DOI] [PMC free article] [PubMed] [Google Scholar]
- [18].National Center for Health Statistics, ICD-9-CM Official Guidelines for Coding and Reporting, 2011.
- [19].Centers for Disease Control and Prevention, Severe Maternal Morbidity Indicators and Corresponding ICD Codes during Delivery Hospitalizations, in: Health D.o.R. (Ed.) 2018. [Google Scholar]
- [20].Dunn A, Grosse SD, Zuvekas SH, Adjusting health expenditures for inflation: a review of measures for health services research in the United States, Health Serv. Res. 53 (1) (2018) 175–196. [DOI] [PMC free article] [PubMed] [Google Scholar]
- [21].Manning WG, Mullahy J, Estimating log models: to transform or not to transform? J. Health Econ. 20 (4) (2001) 461–494. [DOI] [PubMed] [Google Scholar]
- [22].Bateman BT, Shaw KM, Kuklina EV, Callaghan WM, Seely EW, Hernandez-Diaz S, Hypertension in women of reproductive age in the United States: NHANES 1999–2008, PloS One 7 (4) (2012) e36171. [DOI] [PMC free article] [PubMed] [Google Scholar]
- [23].Division of Reproductive Health, California Maternal Quality Care Collaborative’s Data Center Tool Helps Hospitals Reduce Severe Maternal Morbidity, 2015.
- [24].Bernstein PS, Martin JN Jr., Barton JR, Shields LE, Druzin ML, Scavone BM, Frost J, Morton CH, Ruhl C, Slager J, Tsigas EZ, Jaffer S, Menard MK, National partnership for maternal safety: consensus bundle on severe hypertension during pregnancy and the postpartum period, Obstet. Gynecol. 130 (2) (2017) 347–357. [DOI] [PubMed] [Google Scholar]
- [25].Margulis AV, Palmsten K, Andrade SE, Charlton RA, Hardy JR, Cooper WO, Hernandez-Diaz S, Beginning and duration of pregnancy in automated health care databases: review of estimation methods and validation results, Pharmacoepidemiol. Drug Saf. 24 (4) (2015) 335–342. [DOI] [PubMed] [Google Scholar]
- [26].Devine S, West S, Andrews E, Tennis P, Hammad TA, Eaton S, Thorp J, Olshan A, The identification of pregnancies within the general practice research database: the identification of pregnancies, Pharmacoepidem. Drug Safe. 19 (1) (2010) 45–50, 10.1002/pds.1862. [DOI] [PubMed] [Google Scholar]
- [27].Manson JM, McFarland B, Weiss S, Use of an automated database to evaluate markers for early detection of pregnancy, Am. J. Epidemiol. 154 (2) (2001) 180–187. [DOI] [PubMed] [Google Scholar]
- [28].Naleway AL, Gold R, Kurosky S, Riedlinger K, Henninger ML, Nordin JD, Kharbanda EO, Irving S, Cheetham TC, McCarthy NL, Identifying pregnancy episodes, outcomes, and mother–infant pairs in the Vaccine Safety Datalink, Vaccine 31 (27) (2013) 2898–2903, 10.1016/j.vaccine.2013.03.069. [DOI] [PubMed] [Google Scholar]
- [29].ACOG Practice Bulletin No. 202: Gestational Hypertension and Preeclampsia, Obstetrics and gynecology 133(1) (2019) e1–e25. [DOI] [PubMed] [Google Scholar]
- [30].ACOG Practice Bulletin No. 203: Chronic Hypertension in Pregnancy, Obstetrics and gynecology 133(1) (2019) e26–e50. [DOI] [PubMed] [Google Scholar]
- [31].Callaghan WM, Creanga AA, Kuklina EV, Severe maternal morbidity among delivery and postpartum hospitalizations in the United States, Obstet Gynecol. 120 (5) (2012) 1029–1036. [DOI] [PubMed] [Google Scholar]
- [32].Markus AR, Andres E, West KD, Garro N, Pellegrini C, Medicaid Covered Births, 2008 Through 2010, in the Context of the Implementation of Health Reform, Women’s Health Issues 23 (5) (2013) e273–e280, 10.1016/j.whi.2013.06.006. [DOI] [PubMed] [Google Scholar]
- [33].Umesawa M, Kobashi G, Epidemiology of hypertensive disorders in pregnancy: prevalence, risk factors, predictors and prognosis, Hypertens. Res. 40 (3) (2017) 213–220. [DOI] [PubMed] [Google Scholar]
- [34].Bailey C, Skouteris H, Harrison CL, Boyle J, Bartlett R, Hill B, Thangaratinam S, Teede H, Ademi Z, Cost effectiveness of antenatal lifestyle interventions for preventing gestational diabetes and hypertensive disease in pregnancy, PharmacoEconomics Open 4 (3) (2020) 499–510, 10.1007/s41669-020-00197-9. [DOI] [PMC free article] [PubMed] [Google Scholar]