

Abstract
Recombinant adeno-associated viruses (rAAVs) deliver DNA to numerous cell types. However, packaging of partial genomes into the rAAV capsid is of concern. Although empty rAAV capsids are studied, there is little information regarding the impact of partial DNA content on rAAV performance in controlled studies. To address this, we tested vectors containing varying levels of partial, self-complementary EGFP genomes. Density gradient cesium chloride ultracentrifugation was used to isolate three distinct rAAV populations: (1) a lighter fraction, (2) a moderate fraction, and (3) a heavy fraction. Alkaline gels, Illumina Mi-Seq, size exclusion chromatography with multi-angle light scattering (SEC-MALS), and charge detection mass spectrometry (CD-MS) were used to characterize the genome of each population and ddPCR to quantify residual DNA molecules. Live-cell imaging and EGFP ELISA assays demonstrated reduced expression following transduction with the light fraction compared with the moderate and heavy fractions. However, PCR-based assays showed that the light density delivered EGFP DNA to cells as efficiently as the moderate and heavy fractions. Mi-Seq data revealed an underrepresentation of the promoter region for EGFP, suggesting that expression of EGFP was reduced because of lack of regulatory control. This work demonstrates that rAAVs containing partial genomes contribute to the DNA signal but have reduced vector performance.
Keywords: CD-MS, SEC-MALS, live-cell imaging, transduction, NGS, ddPCR
Graphical abstract
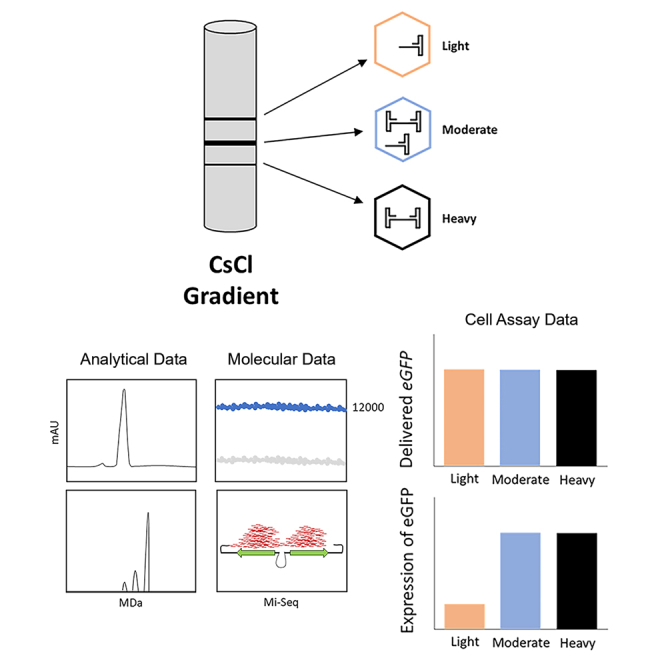
Troxell and colleagues determined the impact of partial genomes on rAAV quality attributes. rAAVs with varied genome purities were characterized by analytical, molecular, and cell assays. Truncated genomes that appeared to lack promoter sequences were amplified by an adenovirus, efficiently delivered DNA, but exhibited reduced expression of the gene of interest.
Introduction
Adeno-associated viruses (AAVs) are naturally occurring viruses from the Parvoviridae family that are capable of infecting numerous animal hosts. In nature, AAVs consist of a single-stranded DNA genome of ∼4.8 kb that encodes the required non-structural Rep (Rep40, Rep52, Rep68, and Rep78) and the structural Cap (VP1, VP2, and VP3) proteins.1,2,3,4,5,6 AAVs lack the ability to elicit a replicative infection in the absence of coinfection with either an adenovirus or herpesvirus, which provide factors required for trans activation of rep expression.6,7 The AAV capsid is composed of VP1, VP2, and VP3 at an approximately 1:1:10 ratio.8,9,10,11 Because of their lack of known pathogenicity, lower immunogenicity, and ability to transduce numerous cell types, AAVs are promising biomolecules for treatment of genetic diseases.12,13 Recent advancements in manufacturing recombinant AAVs (rAAVs), along with evolved capsids and tissue-specific cassette design, allow production at scale for human treatments and refined safety and efficacy.14,15,16,17
There are more than 100 clinical trials in progress that apply rAAVs for treatment of genetic diseases (ClinicalTrials.gov; search term “adeno associated virus”). With increased demand and improved rAAV manufacturing, the number of approved rAAV gene therapies is expected to increase. Production of rAAVs can be performed in multiple ways but relies on the following genetic components: rep and cap genes, target DNA flanked by inverted terminal repeats (ITRs), and adenovirus or other helper virus genes. Unlinking these genetic components reduces the likelihood of recombination as well as packaging of off-target DNA sequences. Despite these efforts, residual and off-target DNAs are a safety concern. Developing molecular approaches that quantify these spurious DNA molecules are beneficial for advancement of gene therapy programs, especially because capsids containing these DNA molecules can be purified with rAAV capsids containing the therapeutic gene of interest.18,19,20 Although the contribution of empty capsids to in vivo rAAV performance has been debated,18,21,22 there is little information regarding the contribution of partial genomes to performance.
Purification of rAAVs containing the target genome can be performed in several ways. Initially, approaches relied solely on ultracentrifugation techniques and density gradients, such as iodixanol and cesium chloride. Iodixanol gradients are capable of rAAV isolation from cell lysates with minimal ultracentrifugation times and recovery greater than 50%. Purified rAAVs obtained from this approach can be used directly in biological and analytical assays, are considered safe for use in humans, are applicable to a variety of capsid serotypes, and do not appear to negatively impact in vivo performance.23,24,25,26 rAAV enrichment using cesium chloride gradients typically has reduced vector recovery and has been shown to negatively impact transduction specificity and efficiency23,27,28; however, use of cesium chloride gradient ultracentrifugation allows isolation of nearly 90% of full rAAVs with reduced contamination levels.27,29 Improvements to these approaches were made by coupling chromatography or affinity purification methods with gradient ultracentrifugation.30,31,32 The use of affinity purification with gradient ultracentrifugation allows application to multiple serotypes in the preclinical stage.
A collection of approaches is required to fully characterize rAAV materials. Typical analytical tools as well as molecular and biological assays add to analytical procedure development. Analytical techniques have shown utility in determining the empty/full content of AAV preparations. Size exclusion chromatography with multi-angle light scattering (SEC-MALS), sedimentation velocity analytical ultracentrifugation (SV-AUC), and charge detection mass spectrometry (CD-MS) are a few of the varied methods used for quantification of empty and full rAAV particles.33,34 SEC-MALS quantifies full and empty particles with agreement to SV-AUC and CD-MS.34,35 Of interest here is the contribution of partial genomes to rAAV performance in controlled cell assays. SV-AUC and CD-MS offer this added resolution to identify partial species in rAAV formulations, with the former being established as the primary technique historically.33,34 CD-MS is a single-particle technique that measures the mass-to-charge (m/z) and charge (z) to allow direct calculation of mass. CD-MS has demonstrated effectiveness in quantification of rAAV populations, assembly viral protein ratio, and structural transitions.36,37 Typical CD-MS analyses require 10–20 μL of material at concentrations as low as 1 × 10¹¹ viral particles/mL. CD-MS is beneficial for preclinical programs because of the small volume requirement in addition to the richness of collected data.36,38
During a directed evolution process, a unique DNA variant derived from the AAV9 capsid, named STRV5, was identified. This capsid was selected for studies because of its changes in the Cap sequences and attributes that met production and performance criteria. As part of capsid characterization and biodistribution studies, STRV5 was purified from a large-scale production run using the EGFP gene flanked by ITR sequences. One ITR sequence was mutated to promote generation of a self-complementary genome.39
Following affinity chromatography and cesium chloride ultracentrifugation, three discrete rAAV vector bands were observed. These three bands existed at gradient densities that were easily separated from the empty capsid zone and were expected to contain varying levels of genome purity. The three fractions were designated according to their existence in the cesium gradient: light fraction (lowest density), moderate fraction (median density), and heavy fraction (highest density). The moderate fraction was the most prominent, followed by the light-density and last the heavy-density fraction. Each fraction was purified and characterized using analytical, molecular, and biological assays. Alkaline gel electrophoresis and CD-MS demonstrated genome purity levels consistent with their localization within the cesium chloride gradient. The light fraction contained a mixture of genomes that included the target self-complementary genome an unknown intermediate sized genome, and another genome that was similar in size to a predicted single-stranded genome (not self-complementary). The moderate fraction consisted of a mostly self-complementary genome with a minor intermediate population. In the heavy fraction, only the full self-complementary genome was detectable. Residual DNA testing demonstrated that the light and heavy fractions contained the most residual plasmid and human DNA at 2–3× and more than 28× the levels in the moderate fraction, respectively. The residual DNA was not impacted by treatment with DNase, indicating that it was protected by or contained in the AAV capsid. Within the light fraction, Mi-Seq indicated an underrepresentation of the regulatory sequences for control of gene expression relative to the EGFP DNA. Compared with the moderate and heavy fractions, this result indicated that the light fraction contained partial genome content that consisted of EGFP DNA that lacked regulatory control.
When DNA content was the readout, infectivity assays determined that the light fraction outperformed the heavy fraction. However, when transduction assays were performed with quantification of GFP as the readout, the moderate and heavy fractions outperformed the light fraction. To directly compare the amount of GFP produced with the amount of delivered DNA, a workflow that combined live-cell imaging with quantification of delivered DNA was optimized. These experiments supported the infectivity and transduction assays in that GFP fluorescent levels in cells were lower following transduction with the light fraction, while delivered DNA was comparable with the moderate fraction. Collectively, these data demonstrated that rAAVs containing partial genomes have DNA sequences that were amplifiable by adenoviruses and contributed to molecular detection methods but negatively impacted production of the desired target protein. Our data suggest that rAAV capsids containing partial genomes are less effective at producing a desired protein from the equivalent VG. Because ITR sequences also drive formation of the stable episome in vivo, it suggests that partial genome content may contribute to PCR-based signals in biodistribution studies. As part of analytical development plans and preclinical programs, this work demonstrates the need to characterize genome content via multiple approaches for rAAVs to avoid data misinterpretation.
Results
Distinct genomes present within a self-complementary rAAV production run
As part of capsid characterization and biodistribution studies, an approximately 370-L production run was completed within StrideBio. This production run contained an AAV9-evolved capsid (STRV5) with a self-complementary EGFP ITR genome (Figure 1A). During enrichment of the target genome, it was observed that multiple bands of AAVs were distributed through the cesium chloride gradient. In addition to the expected empty capsid bands, there were three additional zones of heavier AAV capsids. These bands of varying AAV densities were designated as light, moderate, and heavy, corresponding to their observed density distribution within the cesium gradient (Figure 1B). The moderate-density band was the most prominently visible, followed by the light-density band and last the heavy-density band. The visible level of bands would suggest the yield of each from the 370-L production run.
Figure 1.

Genome arrangement and display of light, moderate, and heavy fractions following cesium chloride gradient ultracentrifugation
(A) Schematic of the ITR-to-ITR region of the plasmid used for rAAV production. The regions in red designate the primer/probe binding sites for each of the three targeted regions, CMV enhancer, EGFP, and bGHpA. The distance in base pairs from the mutated ITR site to the 5′ end of the forward primer for each target is listed below. (B) Image of the cesium chloride gradient after ultracentrifugation. The sample tubes were prepared with cesium chloride and centrifuged. The light, moderate, and heavy fractions are designated. Fractions were harvested using a 21G needle and collected in 2-mL 96-well plates.
Because primer binding sites as well as the genome structure may impact the measured titer value, primers/probes were designed at multiple sites across the target genome sequence. The DNase-resistant titer values were compared. As expected,40,41 the VG/mL value increased in correspondence with the distance from the mutated ITR site (Figure 1A; Table S1). The mean titer value obtained with the primers/probe that bind within the CMV enhancer sequence ranged between 30% and 40% of the mean EGFP and bGHpA titers for each fraction. In addition, the mean EGFP and bGHpA titers were within 20% of the VG/mL determined with the Stunner instrument. To qualitatively assess the packaged DNA from each fraction, alkaline gel electrophoresis was performed with SYBR Gold staining to detect nucleic acid content. Samples were loaded based on the EGFP ddPCR value, and an AAV8 single-strand EGFP material was used as a loading control. The light fraction contained the least amount of the target 4.2-kb self-complementary genome. Instead, the dominant nucleic acid within the light fraction was of an uncharacterized intermediate genome size that was larger than the predicted single-stranded size (∼2,100 bp) but ∼1,400 bp smaller than the self-complementary size (Figure S1). A band consistent with a predicted single-stranded expected size was also readily visible in the alkaline gel. The dominant nucleic acid content in the moderate fraction was the target self-complementary genome followed by a minor band corresponding to the uncharacterized ∼2,800-bp size. Contrasting the light and moderate fractions, the heavy fraction contained a single detected nucleic acid band at the target self-complementary genome size (Figure S1). Collectively, the alkaline gel results support the light, moderate, and heavy fraction designations corresponding with their locations in the cesium gradient.
Characterization of light, moderate, and heavy fractions via full-to-total particle quantification
SEC-MALS is a robust analytical method capable of quantifying multiple attributes in a single experimental run.35 Data from separate SEC-MALS experiments demonstrated agreement in the VG/mL titers with ddPCR and Stunner data (Tables S1 and S2). The moderate- and heavy-fraction titers from SEC-MALS were within 20% of the mean VG/mL value from ddPCR (EGFP and bGHpA) and Stunner. The light-fraction material titer from SEC-MALS was within 20% of the Stunner VG/mL but slightly outside of this range compared with the ddPCR VG/mL. The measured molar masses of the capsids for the moderate and heavy fractions were within 3% of the expected 3.73E+6 g/mol value (Table 1). For unknown reasons, the light fraction deviated from this expectation and produced a measured molar mass for the capsid of 3.89E+6, which was within 5% of the expected value. The molar mass data of the genome content produced values consistent with alkaline gel and CD-MS data. For the moderate and heavy fractions, the g/mol of the genome content was 1.05E+6 and 1.04E+6 g/mol, respectively (Table 1). This result is consistent with these vectors based on the expected genome size and because these vectors measured ∼70%–90% full. The light-fraction genome content measured 8.49E+5 g/mol, which is close to the expected 8.7E+5 g/mol for the ∼2,800-bp genome that is predominant in this fraction (Figure S1). Based on the target genome size of the self-complementary genome, the full-to-total ratio (VG/CP) of the light, moderate, and heavy fractions was 0.59, 0.78, and 0.81, respectively, as measured by SEC-MALS (Table 1). To ensure that each fraction exhibited the expected protein profiles, SDS-PAGE was performed. This showed that similar levels of VP ratios and protein purities were present with each fraction (Figure S2).
Table 1.
SEC-MALS data across fractions
| Fraction | Mean capsid molar mass (g/mol) | Mean genome molar mass (g/mol) | Mean vector molar mass (g/mol) | VG/CP ratio |
|---|---|---|---|---|
| Light | 3.89E+6 (1%) | 8.49E+5 (7%) | 4.74E+6 (0%) | 0.59 |
| Moderate | 3.84E+6 (0%) | 1.05E+6 (0%) | 4.90E+6 (0%) | 0.78 |
| Heavy | 3.83E+6 (4%) | 1.04E+6 (4%) | 4.87E+6 (4%) | 0.81 |
CD-MS is an effective approach to quantifying the full, partial, and empty levels within rAAV materials.37 To compare with SEC-MALS data, CD-MS was performed with the three different fractions. The expected size for STRV5 containing a complete self-complementary genome is ∼5.10 MDa. STRV5 containing a single-stranded genome is ∼4.42 MDa, and the predominant partial genome is expected to be ∼4.65 MDa. In general, CD-MS-measured masses typically differ from sequence mass expectations by 0.3%–1% because of ion adducts and incomplete desolvation of electrosprayed particles. These values were used to bin the CD-MS data for quantification. Six ranges were chosen across the capsid range: 3.50–4.00 (empty capsid), 4.00–4.26 (STRV5 with fragment DNA), 4.26–4.58 (predicted single-stranded DNA [ssDNA]), 4.58–4.94 (intermediate), 4.94–5.26 (target vector scDNA), and 5.26–5.60 (copackaged). For all three fractions, the empty capsid content was found to have an average mass in agreement with the expected mass for STRV5 and accounted for 1.6% or less of the total signal, indicating that the impact of empties on data is minor (Figure 2). For the light fraction, the two more prominent peaks (4.46 and 4.73 MDa), corresponding to the predicted ssDNA size and the unknown intermediate DNA length, accounted for the majority of signal (Figure 2A; Tables S2 and S3). Both peaks have a deviation from expected values on the high end, likely indicating some copackaging of the fragment DNA. This fraction also has a lower abundance of the high mass peak of the expected STRV5 containing the scDNA (Figure 2A; Tables S2 and S3). The moderate fraction contained two lower-abundance populations with masses at 4.48 MDa and 4.73 MDa that show deviations similar to the expected masses for ssDNA and the unknown intermediate (Figure 2B; Tables S2 and S3). The high-intensity mass peak at 5.13 closely matches the expected mass of packaged scDNA. Contrary to the data from the light fraction, the charge histogram is more uniformly centered at 174 charges with the moderate fraction (Figure 2B; Table S3). The heavy fraction contained a single prominent species with a mass centered at 5.10 MDa that falls within the expected mass for packaging of the scDNA genome (Figure 2C; Tables S2 and S3). Interestingly, the charge histogram shows a bimodal distribution, indicating some alterations in the molecular or perhaps structural content, with peak centers at 162 and 173 charges.
Figure 2.

CD-MS characterization of light, moderate, and heavy fractions
CD-MS was performed on the light (A), moderate (B), and heavy (C) fractions. The left panel of each fraction is a mass histogram for all ions detected from 0–10 MDa. AAV capsid peaks are shown with masses between 3.50 and 5.60 MDa. The center panel for each fraction is a color-coded histogram subdivided into ranges that correspond to the empty (black), fragment DNA (red), ssDNA (green), unknown intermediate (royal blue), scDNA (sky blue), and scDNA + copackaging (magenta). The right panel shows a histogram of the measured charge of the capsid ions. The heavy fraction showed a bimodal distribution with centers at 162 and 173 charges.
Residual DNA content varies between light, moderate, and heavy fractions
Because of the differences in location following equilibrium gradient ultracentrifugation, we tested whether the residual DNA content differed among the samples. Developed primers and probes that target unique regions of the ITR, rep/cap, and helper plasmids were used. Quantification of residual plasmid DNA using a set that targets the origin of replication on all three plasmids was also performed to compare with quantification of individual plasmids. In addition, primers/probe based on Alu repeats in the human genome were tested to quantify host cellular DNA content.42
In an initial experiment, the total plasmid DNA content via the origin of replication was quantified by ddPCR with and without DNase digestion. For each fraction, the data were normalized to the mean VG/mL titer quantified by the EGFP and bGHpA primers/probes. Data demonstrated that most of the residual plasmid DNA signal was resistant to DNase (Table S4). This suggests that the DNA is within or at least protected by the capsid proteins, and subsequent residual testing was performed without DNase treatment. Quantification of each plasmid residual revealed a hierarchy of contamination: ITR plasmid residual was most abundant, followed by rep/cap residual, and last helper plasmid content (Table S5). In addition, the signal measured from the origin of replication was within 20% of the sum of each of the three residual plasmids. Quantification of human DNA via testing the Alu repeats produces values of 1.03, 0.03, and 0.77 ng/1E+13 VG for the light, moderate, and heavy fractions, respectively. These data demonstrate that the light fraction contained ∼ 2× and 37× the levels of residual plasmid and human DNA compared with the moderate fraction. The heavy fraction contained ∼3× and 28× the levels of residual plasmid and human DNA compared with the moderate fraction.
Next-generation sequencing (NGS) Mi-Seq data of light, moderate, and heavy fractions
To characterize the genome content of the different fractions, NGS data were obtained for each fraction. An optimized workflow that included DNase treatment followed by DNA extraction was used to isolate DNA content for use in library generation. After library generation, the quality scores were determined with each dataset greater than 30.0. The majority of sequence reads (∼93%) mapped to the DNA sequence between ITRs on the EGFP plasmid (Table S6). These sequence data support the above conclusions from the alkaline gel and CD-MS data regarding the interpretations of genome content based on band sizes and molecular weight, respectively. There were minimal reads that mapped to the human genome (<0.4% of total reads), with the light fraction containing the highest level of human DNA sequences. The level of human DNA sequences in the moderate and heavy fractions were similar by NGS data (0.25% vs. 0.26%; Table S6). This result differs from the data obtained by ddPCR that targeted Alu repeat sequences within the genome. This indicates that the level of sensitivity between the methods differs or that the majority of human DNA present in the moderate fraction lacks Alu repeat sequences. As shown with ddPCR residual DNA testing (Table S5), the heavy fraction contained the highest level of the ITR backbone sequences, followed by the light fraction and last the moderate fraction (Table S6). rep/cap plasmid sequences were greatest in the light fraction, followed by the heavy fraction and last the moderate fraction. This result differed slightly from the ddPCR approach, where the heavy fraction contained the highest level (Table S5).
Reads mapped to the ITR plasmid revealed differences between fractions. For all three fractions, the most prominent sequence reads that aligned to the ITR plasmid corresponded with the end of the chicken β-actin promoter and hybrid intron, the EGFP gene, and the downstream bGH poly(A) sequences (Figure S3). However, in each library, the mapped reads to the mutated ITR, CMV enhancer, and 5′ end of the chicken β-actin promoter exhibited lower signals (Figure S3). Comparing the mapped data with the self-complementary genomes across fractions indicated that the light fraction had an increased prevalence of reads to the EGFP sequence relative to the regulatory sequences (Table S7). Whereas the moderate and heavy fractions exhibited a ratio of EGFP to regulatory sequences of 1.47/1.48, this ratio was 2.13 for the light fraction (Table S7). This result indicated that, although the light fraction has an abundance of EGFP DNA, the levels of promoter, intron, and poly(A) sequences are underrepresented relative to the moderate and heavy fractions. This suggests that genome content in the light fraction may lack the appropriate regulatory sequences for expression of EGFP.
Cell assay performance varies between fraction and assay
The ability to quantify the delivered DNA payload under controlled experimental conditions provides a model system to assess rAAV performance. Cell assays provide this controlled experimental setting. We conducted a series of 50% tissue culture infectivity (TCID50) experiments to determine the functionality of the genomes packaged in the light and heavy fractions. These two fractions were chosen for comparison because these provide the extreme genome purities as shown by alkaline gel electrophoresis, CD-MS, and Mi-Seq data (Figures S1 and S3). The mean DNase-resistant ddPCR titer measured from the EGFP and bGHpA values were used to establish the MOI values. Because the TCID50 assay is known to have variability, five separate experiments were conducted, with three assay plates per each experiment. The qPCR signal from the EGFP measurement was used to determine positive infectivity. In addition, the particle to infectivity ratio (P:I) was used for comparison of infectivity of each fraction. Surprisingly, data from the five experiments indicated that the light fraction outperformed the heavy fraction despite the differences in full-to-total ratio and target genome purity (Figure 3A). The mean P:I ratio for the light fraction was 660 ± 361 (percent coefficient of variation [%CV], 49%), and the mean value for the heavy fraction was 3,145 ± 2,668 (%CV, 76%), an improvement of infectivity by ∼ 5-fold (Table S8). Because genome structures may impact qPCR quantification of the signal, we compared the results from one experiment with a ddPCR readout to assess whether bias existed in the detection method. Extracted DNA from assay plates in experiment 3 were tested by ddPCR. The mean P:I ratios for the light and heavy fractions were 484 ± 229 and 2,093 ± 668, respectively, with ddPCR as the readout (Figure 3B). These are comparable with the qPCR data of 316 ± 366 and 1,652 ± 1,071 for the light and heavy fractions, indicating minimal to no bias in the use of qPCR for the assay readout. Notably, use of ddPCR reduced precision by ∼2-fold, suggesting that measurement of the assay can impact method performance.
Figure 3.

TCID50 results with the light and heavy fractions
(A) TCID50 from qPCR readouts are shown. Five independent experiments were performed, with three assays plates at each experiment. Four replicates of each test article were included on each assay plate. The EGFP signal was quantified using the primers listed in Table S9. Each point is the mean for a single experiment, with the horizontal line as the mean across five experiments ± SD. The complete dataset is shown in Table S8. (B) Extracted DNA from experiment 3 was analyzed by ddPCR. The same EGFP primers and probe were used in quantification. Each point is the value from a single assay plate, with the horizontal line as the mean for the experiment ± SD. The numbers below each dataset are the %CV values for the experiment.
The TCID50 cell assay results suggested that the light fraction excelled in performance compared with the heavy fraction. To further assess the impact of genome content on cell assay performance, transduction assays followed by quantification of the EGFP protein were performed. A series of experiments was performed, using the Chinese hamster ovary (CHO)-derived Lec2 cell line because the STRV5 variant was derived from AAV9.43,44 Four separate experiments were conducted, and the light fraction was directly compared with the heavy and moderate fractions on separate assay plates. The level of EGFP protein was quantified and normalized to the total protein in each well. Using a relative “potency” assay approach for graphing and quantification, relative EGFP plots were generated across the MOI range and compared. These data revealed differences in performance compared with the TCID50 assays. Contrary to the TCID50 experiments, the transduction assays demonstrated that the heavy and moderate fractions produced more EGFP across the MOI range compared with the light fraction (Figure 4A). The mean relative EGFP value for comparing the light with the moderate fraction was 0.43 ± 0.12 and that for comparing the light with the heavy fraction was 0.49 ± 0.10 (Figure 4B). As expected, comparing the heavy fraction with the moderate fraction did not reveal any differences (1.09 ± 0.13; Figure 4B). The data from both sets of cell assays suggested that DNA corresponding to the EGFP signal is delivered to the cell with equal or better efficiency from the light fraction compared with the heavy fraction; however, EGFP expression demonstrated the opposite result because the light fraction produced less EGFP across the MOI range. To directly compare delivered DNA and EGFP expression, another series of cell assays was performed.
Figure 4.

Relative EGFP expression from transduction assays
The light fraction was directly compared with the moderate and heavy fractions using Lec2 cells in transduction assays. (A) EGFP and total protein were measured, and the relative expression of EGFP was determined using MOI range plotted against pg EGFP per μg of total protein and quantified via the parallelism test in the SoftMax Pro Protocol Library. Shown is the result from one experiment, and it displays the comparison between the moderate fraction (blue line) with the light fraction (black line). 4PL global fitting (constrained fit) with the moderate fraction as reference was used to quantify the relative potency of EGFP expression. The error bars display ± SD from triplicate wells in one experiment. (B) Four separate experiments were performed, and each point is the mean value from one experiment, with the horizontal line as the mean across four experiments ± SD. Each experiment contained a single assay plate with triplicate preparations of the test articles. The MOI curve began with 3.0 × 10⁴ VGs/cell with 2-fold dilutions to generate an eight-point curve. The %CV from the relative expression datasets is shown below the data points.
Because the TCID50 assay relies on adenovirus amplification of the DNA payload, another cell assay was developed and optimized to directly measure EGFP expression and delivered DNA in the absence of helper virus amplification. GFP expression was determined using live-cell imaging with DNA (control) also quantified via Hoechst dye incorporation. Delivered EGFP DNA was quantified following live-cell imaging via ddPCR. For the ddPCR detection, the EGFP signal was normalized to the CHO DNA signal for each well. This approach allows direct comparison of expression with DNA content from the same samples. GFP fluorescence data with live cells demonstrated a similar result as with transduction assays, followed by quantification via ELISA. At equivalent MOIs, the light fraction exhibited reduced GFP fluorescence intensity compared with the moderate fraction (Figures 5, 6A, and S4). Across experiments, the global curve fitting analysis determined that the mean GFP intensity for the light fraction was 0.27 ± 0.015 (± standard error) of the GFP intensity produced by the moderate fraction. As a control, the DNA signal (Hoechst/DAPI channel) exhibited no difference between cells transduced with either the light or moderate fraction (Figure 6B). Quantification of the EGFP DNA signal (normalized to host DNA) within samples revealed that a similar level of EGFP DNA was present (Figure 6C). From global curve fitting analyses across the MOI range, the normalized EGFP DNA signal for the light fraction was 0.84 ± 0.06 (± standard error). Although the DNA signal is slightly lower than 1.0 (value expected when there is no difference in transduction efficiency), it is within 20% and can be considered within the variability of the assay. Data from these experiments further confirm that the light fraction exhibited reduced expression relative to the DNA input.
Figure 5.

Live-cell imaging results from transduction assays
Representative images for GFP and Hoechst detection from three MOIs are shown. The values above the images designate the MOI for each test article. Data shown are from one replicate of each test article from one of the three separate experiments. The scale bar is shown in the top left for each image (63.95 μm in all images). Representative data from a complete MOI curve is shown in Figure S4 and represents the scale used for data analysis plotted in Figures 6A and 6B.
Figure 6.

Quantitative data analysis from live-cell imaging and ddPCR results from transduction assays
(A) Quantification of GFP from live-cell imaging following transduction assays. Lec2 cells were transduced with light and moderate fractions, with an MOI curve beginning at 6.7 × 10⁵ VGs/cell, followed by 1.5-fold dilutions. The all-cell average intensities from the GFP data acquisition from the ImageXpress software were plotted against the MOI curve and fitted to a global 4PL curve fitting. The global curve fitting R2 value was 0.994, with the light fraction exhibiting 0.27 ± 0.015 relative performance compared with the moderate fraction. (B) Quantification of Hoechst-stained DNA signal from live-cell imaging of assay plates. The all-cell average intensities from the Hoechst/DAPI data acquisition channel from the ImageXpress software were plotted against the MOI curve. (C) Normalized EGFP DNA signal from assay plates in (A) and (B) quantified by ddPCR. Normalization was performed by converting the EGFP signal/well per 10,000,000 CHO cell signal/well. Data were fitted using a quadratic curve global fit with an R2 value of 0.968. Data shown in (A)–(C) are the mean ± 1 SD from three separate experiments. The CHO cell DNA signal corresponds to the Lec2 cell DNA because these cells were derived from CHO cells. For data shown in (A)–(C), the blue symbols correspond to the results from the moderate fraction, and the black symbols correspond to the results from the light fraction.
Discussion
The impact of empty capsids on the performance of rAAVs has been documented.18 In addition, clinical data suggest that empty capsids are a source of adverse reactions in humans.45 However, little is known regarding the impact of partial genome content on rAAV performance or safety. Using equilibrium gradient ultracentrifugation, we isolated and purified three fractions representing light, moderate, and heavy rAAVs based on their location in the cesium chloride gradient. Alkaline gel electrophoresis, CD-MS, and SEC-MALS demonstrated that the light fraction contained a collection of mostly lower-molecular-weight DNA and intermediate genome DNA content. The moderate and heavy fractions were comparable in genome content and differed slightly, with the moderate fraction containing a detectable level of the intermediate genome size. The heavy fraction appeared to contain a single DNA payload. Quantification of residual plasmid DNA indicated that the light and heavy fractions contained 2–3× the level of the moderate fraction. In addition, the plasmid DNA contamination present across all fractions exhibited a level that directly correlated with the expected binding frequency of the Rep proteins. For instance, the ITR-containing plasmid is expected to be a site of high Rep binding frequency and was the highest contaminating plasmid DNA. This was followed by the rep/cap plasmid and last the helper plasmid. The level of human DNA was also highest in the light and heavy fractions compared with the moderate fraction (>28× higher). Mi-Seq largely supported the residual ddPCR data when reads were mapped to residual DNA targets (Table S6). Because of their localization in the cesium gradient, these data would suggest that rAAV capsids containing residual DNA are not readily separated based on buoyant density. However, rAAVs with varying genome sizes are effectively separated during this process.
Comparison of data from SEC-MALS and CD-MS provided insight into the molecular and biophysical attributes for the fractions. When comparing the full-to-total values across fractions and methods, the light fraction deviated the most. Whereas SEC-MALS produced a VG/CP ratio of 59%, CD-MS quantification of the target vector was 12% (Tables 1 and 2). This is a nearly 5-fold change in quantification of the full target genome. This large discrepancy is most likely due to the significant genome heterogeneity for this fraction because the single-stranded and intermediate genomes dominated the genome content. Whereas CD-MS was able to unbiasedly differentiate between the varied genomes, SEC-MALS interpreted these as contributing to the overall VG/CP ratio of the target vector. This is an expected result because extinction coefficient data for a target vector are used in the quantification. The full-to-total values of the target vector were within 10% with both methods for the moderate and heavy fractions (Tables 1 and 2), supporting the growing evidence for reproducibility between these methods. We note that this reproducibility requires that vector genome content is of sufficient purity. When comparing the moderate and heavy fraction data presented here, it would suggest that a target genome purity of 80% or greater allows reproducible results across SEC-MALS and CD-MS.
Table 2.
CD-MS data across fractions
| Fraction | Empty capsid (3.50–4.00 MDa, %) | Capsid with fragment DNA (4.00–4.26 MDa, %) | ssDNA vector (4.26–4.58 MDa, %) | Intermediate DNA vector (4.58–4.94 MDa, %) | Target vector (4.94–5.26 MDa, %) | Target vector with copackaged DNA (5.26–5.60 MDa, %) |
|---|---|---|---|---|---|---|
| Light | 1.6 | 3.0 | 33.4 | 48.9 | 12.2 | 0.9 |
| Moderate | 0.6 | 0.4 | 7.3 | 19.0 | 68.2 | 4.6 |
| Heavy | 1.3 | 0.1 | 1.1 | 5.9 | 86.1 | 5.4 |
Cell assays generated opposing results with the light, moderate, and heavy fractions. Using an adenovirus amplification cell assay (i.e., TCID50), the light fraction consistently outperformed the heavy fraction, as determined by the P:I ratio. These results would suggest that the partial genome content in the light fraction is amplified by a helper virus and likely contains ITR or ITR-like sequences. The notion that these ITR and ITR-like sequences exist in rAAV capsids from different locations in the cesium chloride gradient has recently been demonstrated in rAAVs from two separate production platforms.46 Because ITR sequences also drive formation of the stable episome in vivo, it suggests that partial genome content may contribute to PCR-based signals in biodistribution studies. Transduction assays showed a direct correlation with target genome content and expression of the GOI; expression of GFP was better with the moderate and heavy fractions compared with the light fraction. These differences in cell assay performance across fractions are likely due to the lack of regulatory sequences for EGFP DNA within the light fraction. Although the NGS data presented here are not single molecule genome resolution (i.e., single-molecule real-time sequencing or Oxford nanopore sequencing), the Mi-Seq data did demonstrate underrepresentation of the promoter, intron, and poly(A) sequences relative to EGFP DNA for the light fraction compared with the moderate and heavy fractions (Figure S4; Tables S6 and S7). Therefore, we interpret the intermediate genomes detected by alkaline gel and CD-MS in the light fraction as fragmented genomes that contain the EGFP gene but lacked sufficient regulatory sequences for expression. This is further supported when considering that a self-complementary genome containing the EGFP gene with partial intron and poly(A) sequences would produce a genome size of ∼2,800 bp; this was the major genome population seen by CD-MS and alkaline gel data.
An advantageous approach was use of live-cell imaging followed by quantification of delivered DNA. This approach allowed direct comparison of protein expression with AAV-delivered DNA among samples. The entirety of cell assays used here support the conclusion that rAAVs containing partial genome content exhibit reduced expression of the target molecule (in this case GFP). Therefore, assessment of genome purity with qualitative and quantitative assays is a critical step to interpret cell assay performance. We speculate that this extends to in vivo studies as well. For instance, our results would predict that biodistribution data would be similar regardless of whether full- or mostly partial-genome-containing rAAVs were used for administration to animals; however, in this scenario, expression of the target protein would favor the full-genome-containing AAV. Because different production systems appear to generate AAVs with varying genome purity, our data provide an additional explanation of performance differences between two prominent platforms.47,48 Note that, during small-scale production of this vector/genome combination, we did not readily detect the vector banding pattern observed in Figure 1B. This is likely due to the low level of light and heavy fractions that were observed with large-scale production. Nevertheless, the characterization work presented here indicates the importance of interpreting cell assay data in the context of the genome, using methods that can quantify partial genomes. It is unclear whether the presence of multiple fractions with varying genome content or relative proportions is a universal observation or unique to a particular vector structure, AAV serotype, or production method. Therefore, these types of characterization studies may be informative on a case-by-case basis. As part of preclinical programs, this work demonstrates the need to characterize genome content via multiple approaches for rAAVs used in biodistribution and capsid characterization studies to avoid data misinterpretation.
Materials and methods
Reagents, chemicals, and supplies
The HeLaRC32 cell line (CRL-2972), adenovirus serotype 5 (VR-1516), and Lec2 (CRL-1736) were purchased from the American Type Culture Collection (Manassas, VA, USA). DPBS without calcium and magnesium and Pluronic F-68 were purchased from Gibco (Grand Island, NY, USA). Ultra-pure 10% SDS, SYBR Gold, and Trizma HCl were purchased from Invitrogen (Waltham, MA, USA). Fetal bovine serum (FBS) was purchased from HyClone (Logan, UT, USA). Tween 20, EDTA, NaOH, 50× TAE, cesium chloride, Accelagen Turbonuclease, and 100% ethanol were purchased from Thermo Fisher Scientific (Waltham, MA). Proteinase K, TaqMan primers and probes, the Micro BCA Protein Assay Kit, GeneRuler 1 kb Plus DNA Ladder Ready-to-Use, UltraPure agarose, POROS CaptureSelect AAVX affinity resin, 10% SDS, trypsin-EDTA (0.05%), Hoechst 33342 solution (20 mM), Turbo DNase, and deoxycholic acid were purchased from Thermo Fisher Scientific. DMEM without phenol red, HEPES, black clear-bottom cell assay plates, and 10× PBS were purchased from Corning (Corning, NY, USA). Triton X-100 was purchased from MilliporeSigma (Burlington, MA, USA). Liquid chromatography-MS-grade water was purchased from Pierce (Waltham, MA, USA). Bovine serum albumin (BSA) was purchased from USP (Rockville, MD, USA). Xylene cyanole, automated droplet generation cartridges, ddPCR Supermix for Probes, ddPCR droplet reader oil, pipette tips for the automated droplet generator, automated droplet generation oil for probes, ddPCR plate seals, Mini Protein TGX pre-cast gradient protein gels (4%–20%), Oriole fluorescent gel stain, and PCR plates were purchased from Bio-Rad (Carlsbad, CA, USA). Ficoll was purchased from MP Biomedical. EGFP ELISA kits were purchased from Abcam (Waltham, MA, USA). SterileWipe HS II TX3210 sterile sheets were purchased from Texwipe (Kernersville, NC, USA). Reducing SDS loading dye and Tris/glycine SDS running buffer were purchased from Boston BioProducts (Milford, MA, USA).
rAAV production
The rAAV was produced using a proprietary cell line and process. Briefly, 350 L of a HEK cell suspension was transfected with plasmids containing EGFP flanked by an ITR (one mutated for self-complementary genome packaging), AAV2 rep and STRV5 cap, and a helper virus plasmid. The Cap sequence for the STRV5 capsid was selected from in vivo evolution of variable regions within the AAV9 cap16 DNA sequence. rAAV was produced, and the cell culture was lysed using Triton X-100 and treated with Turbonuclease (Accelagen) and then incubated at 37°C for several hours. Clarified and filtered lysate material was loaded onto an affinity resin (AAVX) column for purification of the rAAV. Capsids were eluted with a low-pH buffer and subsequently neutralized, followed by loading onto cesium chloride gradient sample tubes. The tubes were centrifuged at 60,000 rpm for a minimum of 16 h under temperature control using a Beckman Coulter Optima XE-90 ultracentrifuge. Fractions were purified using a 21G needle, formulated in a PBS-containing buffer, and aliquoted until subsequent testing.
ddPCR and Stunner testing
Sets of primers and TaqMan probes were ordered from Invitrogen, and conditions were screened for desired response factors. All primers and probes used in this work are listed in Table S9. A 22-μL droplet digital PCR (ddPCR) method was used, containing 0.9 μM of each primer, 0.25 μM of probe, ddPCR Supermix for Probes, 5.5 μL of sample, and molecule-grade water to achieve the final volume. This material was then used to generate droplets using an auto-droplet generator (Bio-Rad). Thermocycling was performed using a C1000 Touch deep-well thermal cycler with the following program: 95°C for 10 min, followed by 40 cycles of 94°C for 30 s, 56°C for 60 s, and 72°C for 15 s. After the cycling program, there was a 10-min incubation at 98°C, followed by 30 min at 4°C and a hold at 12°C until droplets were quantified. Ramp rates were set to 3°C per second. Droplets were quantified and thresholds set using a QX200 droplet reader with QX Manager software (Bio-Rad). For vector genome quantification, samples were treated with Turbo DNase (Ambion), followed by heat and chelator inactivation of the DNase and dilution in water with 0.01% Pluronic. DNase-treated, diluted samples were mixed with ddPCR Supermix for Probes, and gene-specific primers/probe and droplets were generated. Data were analyzed, and VG/mL values were determined using an internally developed Microsoft Excel spreadsheet. Data presented are from a minimum of two separate experiments that contained at least three dilutions within the analytical range. Non-template controls (NTCs) were included in each assay.
For reporting data from residual DNA testing, the following approach was used. The primers and probes were used to determine the size of the target amplicon for each residual DNA target. Following amplification via ddPCR, the copies/μL were converted to copies/mL of the sample and then ng of target DNA using the following equation: copies/mL × 650 Da × 1e9 ng/g × number of base pairs of the residual DNA target / Avogadro’s number. The ng of residual DNA amplicon was normalized to 1e13 VGs.
Samples were analyzed by Stunner (Unchained Labs, Pleasanton, CA, USA) using the Gene Therapy application with the AAV Quant workflow. The theoretical molar masses for the capsid and the target packaged DNA were included in the software parameters. A minimum of triplicate volume transfers were performed to directly measure critical quality attributes (CQAs) using Stunner low-volume 96-well plates.
Alkaline gel electrophoresis
A modified alkaline gel electrophoresis method was used. A 6× sample loading dye was prepared to the following concentrations: NaOH (385 mN), EDTA (8 mM), and 0.23 g/mL of Ficoll. Then, a trace amount of xylene cyanol was added and mixed to dissolve. The pH of the solution was measured (pH ≥ 12.0), and aliquots were stored at −20°C prior to use. A 10× alkaline gel running buffer was prepared to the following concentrations: NaOH (0.5 N) and EDTA (10 mM). The pH was measured (pH ∼12.0), and aliquots were stored at −20°C until needed. A 1% agarose gel was prepared as follows. 1.5 g of agarose was mixed with 135 mL of molecule-grade water and heated. When dissolved and cooled, 15 mL of the 10× alkaline running buffer was added, mixed, and poured to solidify (OWL Easycast B2 apparatus). A volume of rAAV sample to achieve 1E+10 total VGs was added to a PCR tube and heated at 95°C for 10 min. When the sample had cooled, sample loading dye was added and mixed. Volumes of the DNA ladder along with 1E+10 VGs of samples were loaded to the solidified agarose gel. Electrophoresis occurred at 2°C–8 °C at 25 V for ∼18 h. The gel was neutralized with multiple washes at room temperature using 1× TAE and stained with 1× SYBR Gold for 2 h. The gel was imaged under UV settings using an Amersham GE 680 RGB gel imager.
CD-MS
CD-MS extends the upper mass limit of MS by simultaneously measuring the m/z and z of individual ions to allow direct calculation of mass. CD-MS has been used to measure a number of viruses,49 with recent utility in the analysis of rAAVs.34,36,37,38 Prior to CD-MS analysis, rAAV samples were buffer exchanged into 200 mM ammonium acetate (Honeywell, 631-61-8) solution using Micro Bio-Spin columns (Bio-Rad, 7326221) in duplicate. Ions were generated by a commercial nanoelectrospray source (Advion Triversa Nanomate) into a custom CD mass spectrometer, described in detail elsewhere.50,51 Ions enter the instrument through a metal capillary into an ion funnel/ion carpet hybrid known as the FUNPET, which thermalizes and transmits a broad mass range.52 The ion energy is then set by the subsequent radiofrequency multipoles. Ions are then focused into a dual hemispherical deflection energy analyzer to pass a narrow band of known energy for transmission into the electrostatic linear ion trap (ELIT). The ELIT is operated in triggered trapping mode, where potentials on the ends of the ELIT are raised when ions are detected. A trapping time of 100 ms is used, which gives a charge uncertainty of ∼1 electron. Measurements in this study ranged from 19–31 min, and each dataset is comprised of more than 5,100 rAAV capsid measurements.
SEC-MALS
An Agilent 1260 Infinity II liquid chromatography (LC) system (Agilent, Santa Clara, CA, USA) with binary pump, multisampler maintained at 4°C, multicolumn thermostat maintained at 25°C, and diode array detector (DAD) was coupled to a DAWN HELEOS MALS detector and Optilab refractometer (both from Wyatt Technology, Santa Barbara, CA, USA). An isocratic mobile phase of 1× PBS (from 10× PBS) containing 0.01% (v/v) Pluronic F-68 was used after passing through a 0.2-μm filter. LC-MS-grade water was used for dilution of stock solutions. A Wyatt 5-μm, 500-Å, 4.6-mm ID × 300-mm column (Wyatt Technology, WTC-050N5) was used. The system and column were equilibrated for ∼20 h prior to injection at a 0.3-mL/min flow rate. Injection volumes tested were between 20 μL and 45 μL, with the mobile phase used as diluent for sample dilution. Absorbance readings at 260 nm and 280 nm were performed during testing, and protein and vector extinction coefficients for STRV5 sceGFP were determined with the moderate fraction using Optilab and UV detection. The STRV5 capsid extinction coefficients were 1.33 and 1.99 for 260 nm and 280 nm, respectively. For the STRV5 sceGFP vector, the extinction coefficients were 24.633 and 14.29 for 260 nm and 280 nm, respectively. Sample volumes were added to 2-mL polypropylene vials with a 0.2-mL glass insert with vial screw caps (Agilent). Triplicate injections of BSA were used as a system check during each run. Peak detections, molar mass determinations, and peak statistics were performed in ASTRA 8.1.1.
NGS of rAAVs using the Mi-Seq Illumina platform
To assess the total nucleic acid content of each of the fractions, NGS Mi-Seq data were collected. Samples were treated with Turbo DNase (as above), and the total DNA was extracted using the PrepSEQ Residual DNA Sample Preparation Kit (Applied Biosystems, Waltham, MA, USA). An optimized in-house approach to using the PrepSEQ Kit was performed to ensure maximal recovery of total DNA content. Mi-Seq library preparation and data analysis were performed by Genewiz from Azenta Life Sciences (South Plainfield, NJ, USA). Briefly, the Illumina TruSeq paired-end sequencing workflow was completed, and the quality scores were determined. Sequence reads for the samples were trimmed of their adapter sequences and nucleotides with poor quality (<30). The bioinformatic workflow was performed by Genewiz. Briefly, the Illumina BCL sequence files were demultiplexed into FASTQ files using bcl2fastq v.2.17.1.14. The reads were then mapped to the reference sequences (using GENE-IS_1.0) of the human genome (GRCh38), the ITR to ITR EGFP DNA content, the backbones of the rep/cap, ITR, and the proprietary helper virus plasmids. The CLC Genomics Workbench (QIAGEN, Hilden, Germany) was also used to analyze FASTQ files and generate figures for mapped reads to reference DNA sequences. Default settings in the CLC Genomics Workbench were used for mapping and analysis. Comparisons between analysis platforms were consistent (Table S6).
Visualization and quantification of mapped reads to the theoretical self-complementary genome were generated as follows. Briefly, the self-complementary genome sequence was generated in SnapGene and shows the core features as well as the amplicons for CMV, EGFP, and bGHpA-ITR. This sequence was used to generate a .bed file that was imported into the CLC Genomics Workbench 23. This annotated genome was set as the reference, and batch read mapping for the FASTQ files from each fraction was performed. The QC for targeted sequencing was performed using the mapped reads and the annotation track file generated from the predicted self-complementary genome. The read coverage graphs were compiled and aligned with the genome figure generated in SnapGene. The read coverage tabulated data were exported and are shown in Table S7.
SDS-PAGE
Samples were separated by SDS-PAGE to assess protein purity and VP ratios. Samples and BSA controls were heated at 95°C for 10 min in reducing loading dye. Approximately 40 ng of BSA and 150 or 35 ng of protein from rAAV fractions were loaded to gradient, pre-cast gels. SDS-PAGE was performed under constant current, followed by washing and staining using Oriole stain. Gels were imaged with an Amersham Imager 680RGB under UV exposure.
TCID50 assay
Development and optimization of the classic TCID50 assay53,54 were performed prior to testing. Briefly, HeLaRC32 cells were cultivated in DMEM with 10% FBS for ∼3–5 days in T75 culture flasks prior to plating. Cells were trypsinized and counted with a Cedex HiRes Analyzer (Roche, Basel, Switzerland), and 50 μL at 8.0 × 10⁵ cells/mL were plated on Falcon polystyrene 96-well tissue culture plates (Corning). Plates were incubated overnight at 37°C/CO2 prior to use. An infection medium preparation was made by combining DMEM, 0.01% Pluronic, 25 mM HEPES, and adenovirus to 3.2 × 10⁸ particles/mL. AAV samples were diluted in infection medium to the target analytical MOI range. Five-fold assay plate dilutions were performed with four independent volume transfers for each cell assay plate. A single column of no AAV addition was used to monitor well-to-well contamination. Control AAV material was prepared in the same manner and included on each assay plate. Cell culture medium was aspirated from the plated HeLaRC32 cells and washed with DPBS. 50 μL of the serially diluted samples in infection medium was added to the plates, and the plates were incubated for 2 h at 37°C/CO2. 50 μL of complete medium was added, and the plates were incubated for ∼3 days. DNA was extracted using a solution composed of Proteinase K buffer (1 mM Trizma with 1 mM EDTA and 0.1% SDS), Tween 20, deoxycholate, and 1× PBS. 85 μL of the extraction solution was added to all wells of the assay plate, followed by incubation at 37°C for 1 h, 55°C for 2 h, and 30 min at 95°C. Treated plates were sealed and stored at 2°C–8°C for up to 7 days before analysis.
For the majority of data presented, the DNA signal was quantified using qPCR. In one experiment, the DNA signal was also quantified by ddPCR for comparison. For both approaches, extracts from TCID50 assay plates were analyzed by diluting 100-fold in water with Pluronic acid prior to PCR. For qPCR, a plasmid containing the EGFP DNA sequence was linearized using BshTI digestion (Fast Digest, Thermo Fisher Scientific). The linearized DNA used as the standard curve was separated by agarose gel electrophoresis, purified using the NucleoSpin Gel and PCR Clean-Up Kit (Macherey-Nagel), and quantified by ddPCR to establish the concentration. For each qPCR run, a standard curve was generated from 9.2E+6 to 0.92 copies/μL with 10-fold dilutions. qPCR was performed using a QuantStudio 7 instrument containing a 384-well thermocycling block. An Integra VIAFLO384 unit was used to dilute and load samples for qPCR. A 20-μL qPCR method was used, containing 0.2 μM of each primer, 0.3 μM probe, 2× TaqMan Universal II (No UNG) Mastermix, 8 μL of sample, and molecule-grade water added to achieve the final volume. Thermocycling conditions were 95°C for 10 min, followed by 40 cycles of 95°C for 30 s, 56°C for 60 s, and 72°C for 20 s. Fluorescence was quantified at the end of each extension step for the cycling program. The cycle threshold (Ct) values from the collected fluorescence signal were quantified by regression against the standard curve. The DNA concentration from the no-AAV wells (typically between ∼101–102 copies total per well) was averaged and subtracted from sample/control wells. The total number of copies per well was determined, and the input VGs were subtracted. Wells were scored as positive or negative, and the (TCID50/mL) and vector genome P:I ratios were determined using the Spearman-Kärber method from publicly available spreadsheets that were modified for use54 with a 384-well format. qPCR assays were performed on five separate days, with each experiment containing three assay plates. Each assay plate contained four dilution curves of each test article.
For a single TCID50 experiment, ddPCR was performed to compare with qPCR collected data. Droplet generation, PCR cycling, and droplet reading was performed as above without a DNase treatment step. A 22-μL ddPCR method was used containing 0.9 μM of each primer, 0.25 μM of probe, ddPCR Supermix for Probes, 5.5 μL of sample, and molecule-grade water to achieve the final volume. This material was then used to generate droplets using an auto-droplet generator. Thermocycling was performed using a C1000 Touch deep-well thermal cycler with the following program: 95°C for 10 min, followed by 40 cycles of 94°C for 30 s, 56°C for 60 s, and 72°C for 15 s. After the cycling program, there was a 10-min incubation at 98°C, followed by 30 min at 4°C and a hold at 12°C until droplets were quantified. Ramp rates were set to 3°C per second. Droplets were quantified and thresholds set using a QX200 droplet reader with QX Manager software. Data were analyzed using an internally developed Microsoft Excel spreadsheet for use with ddPCR. The copies/μL values were measured, and the background signal (from the no-AAV wells) was averaged and subtracted from sample/control wells. The total number of copies per well was determined, and the input VGs were subtracted. Wells were scored as positive or negative P:I ratios were determined as above.
Transduction assays with eGFP quantification
Lec2 cells (derived from CHO cells43,55) were cultivated in DMEM with 10% FBS for ∼3–5 days in T75 culture flasks prior to plating. Cells were trypsinized and counted with a Cedex HiRes Analyzer (Roche), and 100 μL at 6.4 × 10⁵ cells/mL was plated in black, clear-bottom, 96-well tissue culture plates (Corning). AAV preparations were diluted in DMEM with 0.01% Pluronic and an MOI of 3.0 × 10⁴ VGs/cell generated, followed by 7 2-fold dilutions. Cells were incubated for 24 h, followed by aspiration and washing with DPBS. 100 μL of complete DMEM was added to each well, and the assay plates were incubated for an additional 48 h. Triplicate preparations of each test article were performed with each assay plate. The experiments were replicated on four separate days.
EGFP was quantified using commercially available kits (Abcam). Briefly, a cell extraction buffer with enhancer was prepared according to kit instructions. Individual assay plates were aspirated and washed with 300 μL of DPBS, and 200 μL of cell extraction buffer was added to each well. The plates were incubated on ice for ∼20 min, sealed, and stored at −80°C until use. A standard curve with eight dilution points of the GFP protein was generated in the cell extraction buffer in duplicate from 1,200 to 12.5 pg/mL. Sample extracts were diluted 10-fold in the kit-supplied sample diluent. Antibody cocktail was prepared according to instructions. ELISA plates were washed using kit-supplied wash buffer and a plate washer (Agilent), and the incubation steps of the method were performed at 22 °C at 500 rpm for 1 h using a microplate incubator shaker (Incu-Mixer MP4, Benchmark Scientific, Sayreville, NJ, USA). TMB substrate (kit supplied) was added, with plates incubated at 22°C without shaking. Stop solution (kit supplied) was added, and the was time recorded. Within 10 min of stopping, the optical density at 450 nm was performed using an iD5 multimode plate reader and blank corrected optical density (OD) values were used to determine concentrations (Molecular Devices, San Jose, CA, USA). Sample values were regressed against the standard curve using a 4-parameter logistic curve fit (4PL), with data analysis performed in Softmax Pro 7.1.0. Either the moderate or heavy fraction was set as the reference (depending on the experimental setup for comparison), and a global fitting (constrained fit) was used to quantify the level of EGFP expression. Data shown are plotted and treated as a “potency” value but represent expression differences and not true potency because the functionality of EGFP was not determined. Total protein was quantified using a microBCA kit (Thermo Fisher Scientific), and EGFP was normalized to total protein concentration for each well. Relative expression of EGFP was determined using MOI range plotted against pg EGFP per μg of total protein and quantified via the parallelism test in the SoftMax Pro Protocol Library. An Integra VIAFLO was used throughout the ELISA and microBCA workflows.
Transduction assays with live-cell imaging and quantification of EGFP by ddPCR
Lec2 cells were cultivated as above in phenol red-free DMEM with 10% FBS. Triplicate AAV preparations per experiment were diluted in incomplete DMEM with 0.01% Pluronic acid, starting with 6.7 × 10⁵ VG/cell, followed by 1.5-fold dilutions to achieve a 7-point dilution curve. Cells were incubated for 24 h, followed by aspiration and washing with DPBS. After ∼24 h, medium was aspirated, and 50 μL of trypsin was added to each well. The plate was incubated at 37°C for 1 h with shaking at 400 rpm. The reaction was quenched with addition of 100 μL of phenol red-free complete medium and mixed thoroughly by pipetting. Cell suspensions were transferred to a new assay plate and centrifuged at 10,000 × g for 10 min. The spun plate was inverted and blotted onto a SterileWipe HS II TX3210 sheet in a biological safety cabinet to remove the supernatant. Then, 100 μL of phenol red-free complete medium containing 1 μg/mL of Hoechst dye was added to each well and incubated for another 24 h. After 24 h, medium was aspirated, and an additional 100 μL of the Hoechst-containing medium was added. The plate was incubated for another 24 h prior to live-cell imaging.
Live-cell imaging was performed with an ImageXpress Pico Cell Imaging System (Molecular Devices). Under the 20× objective, well bottom images were obtained with the fluorescein isothiocyanate (FITC) and DAPI/Hoechst channel. For DAPI detection, a 225-ms exposure and segmentation intensity of 30 were used. The GFP signal was obtained with a 132-ms exposure and segmentation intensity of 75. For each channel, the all cell average intensities (average intensity/area) were used as the reported signal. Relative fluorescence of EGFP was determined across the MOI range and quantified via the parallelism test in the SoftMax Pro Protocol Library using a 4PL global fitting as noted above.
Following live-cell imaging, the amount of EGFP DNA within transduced cells was quantified by ddPCR. Briefly, medium from imaged assay plates was aspirated, and 200 μL of 0.025% SDS in molecule-grade water was added to each well. The plate was then stored at −80°C until use. ddPCR was performed using Mastermix, cycling conditions, data collection, and analysis as above. Separate ddPCR plates were used to quantify EGFP and the CHO (Lec2 cells are derived from CHO cells) signal. The primers and probe used for CHO (Lec2) cell DNA quantification are specified in United States Pharmacopeia <509>. The EGFP signal was normalized to the CHO cell signal as follows: EGFP copies/well divided by CHO cell copies/well times 1.0 × 10⁷. A plot of the normalized EGFP signal against the MOI curve was generated in Softmax Pro 7.1.0. The relative transduction was determined using MOI range plotted against the normalized EGFP signal as noted above with EGFP expression studies. A quadratic curve fit was used to assess individual test article fit and global fit with the moderate fraction selected as the reference material. Three separate experiments were performed.
Data analysis and documentation
Non NGS datasets were analyzed in Microsoft Excel and GraphPad Prism (9.0). Graphs were generated with GraphPad Prism, and %CV was determined. In some cases, graphs were generated in the data collection software and included. Experiments were documented in near time in the electronic lab notebook of StrideBio.
Acknowledgments
We thank Jack Ren, PhD, and members of the StrideBio Research Vector Production team for production and isolation of rAAVs used throughout the study. Funding for this work was provided by StrideBio. We are thankful for the reviewers’ comments.
Author contributions
B.T., conceptualization, investigation, formal analysis, resources, writing – original draft, visualization, and project administration; S.L.J. and I.-W.T., methodology, investigation, and resources; B.E.D. and M.F.J., investigation, methodology, formal analysis, and writing; K.L., investigation, formal analysis, and writing; L.B., investigation, formal analysis.
Declaration of interests
Authors, except B.E.D. and M.F.J., may have equity in Stridebio. B.E.D. and M.F.J. have equity in Megadalton Solutions. M.F.J. is a consultant for Waters.
Footnotes
Supplemental information can be found online at https://doi.org/10.1016/j.omtm.2023.07.007.
Supplemental information
Data and code availability
Non-proprietary data from this work are available upon request from the corresponding author (B.T.).
References
- 1.Wistuba A., Weger S., Kern A., Kleinschmidt J.A. Intermediates of adeno-associated virus type 2 assembly: identification of soluble complexes containing Rep and Cap proteins. J. Virol. 1995;69:5311–5319. doi: 10.1128/JVI.69.9.5311-5319.1995. [DOI] [PMC free article] [PubMed] [Google Scholar]
- 2.Tratschin J.D., Tal J., Carter B.J. Negative and positive regulation in trans of gene expression from adeno-associated virus vectors in mammalian cells by a viral rep gene product. Mol. Cell Biol. 1986;6:2884–2894. doi: 10.1128/mcb.6.8.2884-2894.1986. [DOI] [PMC free article] [PubMed] [Google Scholar]
- 3.Labow M.A., Hermonat P.L., Berns K.I. Positive and negative autoregulation of the adeno-associated virus type 2 genome. J. Virol. 1986;60:251–258. doi: 10.1128/JVI.60.1.251-258.1986. [DOI] [PMC free article] [PubMed] [Google Scholar]
- 4.Tratschin J.D., Miller I.L., Carter B.J. Genetic analysis of adeno-associated virus: properties of deletion mutants constructed in vitro and evidence for an adeno-associated virus replication function. J. Virol. 1984;51:611–619. doi: 10.1128/JVI.51.3.611-619.1984. [DOI] [PMC free article] [PubMed] [Google Scholar]
- 5.Hermonat P.L., Labow M.A., Wright R., Berns K.I., Muzyczka N. Genetics of adeno-associated virus: isolation and preliminary characterization of adeno-associated virus type 2 mutants. J. Virol. 1984;51:329–339. doi: 10.1128/JVI.51.2.329-339.1984. [DOI] [PMC free article] [PubMed] [Google Scholar]
- 6.Daya S., Berns K.I. Gene therapy using adeno-associated virus vectors. Clin. Microbiol. Rev. 2008;21:583–593. doi: 10.1128/CMR.00008-08. [DOI] [PMC free article] [PubMed] [Google Scholar]
- 7.Pereira D.J., McCarty D.M., Muzyczka N. The adeno-associated virus (AAV) Rep protein acts as both a repressor and an activator to regulate AAV transcription during a productive infection. J. Virol. 1997;71:1079–1088. doi: 10.1128/JVI.71.2.1079-1088.1997. [DOI] [PMC free article] [PubMed] [Google Scholar]
- 8.Buller R.M., Rose J.A. Characterization of adenovirus-associated virus-induced polypeptides in KB cells. J. Virol. 1978;25:331–338. doi: 10.1128/JVI.25.1.331-338.1978. [DOI] [PMC free article] [PubMed] [Google Scholar]
- 9.Rose J.A., Maizel J.V., Jr., Inman J.K., Shatkin A.J. Structural proteins of adenovirus-associated viruses. J. Virol. 1971;8:766–770. doi: 10.1128/JVI.8.5.766-770.1971. [DOI] [PMC free article] [PubMed] [Google Scholar]
- 10.Johnson F.B., Ozer H.L., Hoggan M.D. Structural proteins of adenovirus-associated virus type 3. J. Virol. 1971;8:860–863. doi: 10.1128/JVI.8.6.860-863.1971. [DOI] [PMC free article] [PubMed] [Google Scholar]
- 11.Snijder J., van de Waterbeemd M., Damoc E., Denisov E., Grinfeld D., Bennett A., Agbandje-McKenna M., Makarov A., Heck A.J.R. Defining the stoichiometry and cargo load of viral and bacterial nanoparticles by Orbitrap mass spectrometry. J. Am. Chem. Soc. 2014;136:7295–7299. doi: 10.1021/ja502616y. [DOI] [PMC free article] [PubMed] [Google Scholar]
- 12.Hastie E., Samulski R.J. Adeno-associated virus at 50: a golden anniversary of discovery, research, and gene therapy success--a personal perspective. Hum. Gene Ther. 2015;26:257–265. doi: 10.1089/hum.2015.025. [DOI] [PMC free article] [PubMed] [Google Scholar]
- 13.Pupo A., Fernández A., Low S.H., François A., Suárez-Amarán L., Samulski R.J. AAV vectors: The Rubik's cube of human gene therapy. Mol. Ther. 2022;30:3515–3541. doi: 10.1016/j.ymthe.2022.09.015. [DOI] [PMC free article] [PubMed] [Google Scholar]
- 14.Choi V.W., McCarty D.M., Samulski R.J. AAV hybrid serotypes: improved vectors for gene delivery. Curr. Gene Ther. 2005;5:299–310. doi: 10.2174/1566523054064968. [DOI] [PMC free article] [PubMed] [Google Scholar]
- 15.Gonçalves M.A.F.V. Adeno-associated virus: from defective virus to effective vector. Virol. J. 2005;2:43. doi: 10.1186/1743-422X-2-43. [DOI] [PMC free article] [PubMed] [Google Scholar]
- 16.Tse L.V., Klinc K.A., Madigan V.J., Castellanos Rivera R.M., Wells L.F., Havlik L.P., Smith J.K., Agbandje-McKenna M., Asokan A. Structure-guided evolution of antigenically distinct adeno-associated virus variants for immune evasion. Proc. Natl. Acad. Sci. USA. 2017;114:E4812–E4821. doi: 10.1073/pnas.1704766114. [DOI] [PMC free article] [PubMed] [Google Scholar]
- 17.Grieger J.C., Samulski R.J. Adeno-associated virus vectorology, manufacturing, and clinical applications. Methods Enzymol. 2012;507:229–254. doi: 10.1016/B978-0-12-386509-0.00012-0. [DOI] [PubMed] [Google Scholar]
- 18.Gao K., Li M., Zhong L., Su Q., Li J., Li S., He R., Zhang Y., Hendricks G., Wang J., Gao G. Empty Virions In AAV8 Vector Preparations Reduce Transduction Efficiency And May Cause Total Viral Particle Dose-Limiting Side-Effects. Mol. Ther. Methods Clin. Dev. 2014;1:20139. doi: 10.1038/mtm.2013.9. [DOI] [PMC free article] [PubMed] [Google Scholar]
- 19.Dismuke D.J., Tenenbaum L., Samulski R.J. Biosafety of recombinant adeno-associated virus vectors. Curr. Gene Ther. 2013;13:434–452. doi: 10.2174/15665232113136660007. [DOI] [PubMed] [Google Scholar]
- 20.Allay J.A., Sleep S., Long S., Tillman D.M., Clark R., Carney G., Fagone P., McIntosh J.H., Nienhuis A.W., Davidoff A.M., et al. Good manufacturing practice production of self-complementary serotype 8 adeno-associated viral vector for a hemophilia B clinical trial. Hum. Gene Ther. 2011;22:595–604. doi: 10.1089/hum.2010.202. [DOI] [PMC free article] [PubMed] [Google Scholar]
- 21.Mingozzi F., Anguela X.M., Pavani G., Chen Y., Davidson R.J., Hui D.J., Yazicioglu M., Elkouby L., Hinderer C.J., Faella A., et al. Overcoming preexisting humoral immunity to AAV using capsid decoys. Sci. Transl. Med. 2013;5:194ra92. doi: 10.1126/scitranslmed.3005795. [DOI] [PMC free article] [PubMed] [Google Scholar]
- 22.Hoffman B.E., Herzog R.W. Covert warfare against the immune system: decoy capsids, stealth genomes, and suppressors. Mol. Ther. 2013;21:1648–1650. doi: 10.1038/mt.2013.176. [DOI] [PMC free article] [PubMed] [Google Scholar]
- 23.Klein R.L., Dayton R.D., Tatom J.B., Henderson K.M., Henning P.P. AAV8, 9, Rh10, Rh43 vector gene transfer in the rat brain: effects of serotype, promoter and purification method. Mol. Ther. 2008;16:89–96. doi: 10.1038/sj.mt.6300331. [DOI] [PMC free article] [PubMed] [Google Scholar]
- 24.Zolotukhin S., Byrne B.J., Mason E., Zolotukhin I., Potter M., Chesnut K., Summerford C., Samulski R.J., Muzyczka N. Recombinant adeno-associated virus purification using novel methods improves infectious titer and yield. Gene Ther. 1999;6:973–985. doi: 10.1038/sj.gt.3300938. [DOI] [PubMed] [Google Scholar]
- 25.Lock M., Alvira M., Vandenberghe L.H., Samanta A., Toelen J., Debyser Z., Wilson J.M. Rapid, simple, and versatile manufacturing of recombinant adeno-associated viral vectors at scale. Hum. Gene Ther. 2010;21:1259–1271. doi: 10.1089/hum.2010.055. [DOI] [PMC free article] [PubMed] [Google Scholar]
- 26.Hermens W.T., ter Brake O., Dijkhuizen P.A., Sonnemans M.A., Grimm D., Kleinschmidt J.A., Verhaagen J. Purification of recombinant adeno-associated virus by iodixanol gradient ultracentrifugation allows rapid and reproducible preparation of vector stocks for gene transfer in the nervous system. Hum. Gene Ther. 1999;10:1885–1891. doi: 10.1089/10430349950017563. [DOI] [PubMed] [Google Scholar]
- 27.Ayuso E., Mingozzi F., Montane J., Leon X., Anguela X.M., Haurigot V., Edmonson S.A., Africa L., Zhou S., High K.A., et al. High AAV vector purity results in serotype- and tissue-independent enhancement of transduction efficiency. Gene Ther. 2010;17:503–510. doi: 10.1038/gt.2009.157. [DOI] [PubMed] [Google Scholar]
- 28.Gao G., Qu G., Burnham M.S., Huang J., Chirmule N., Joshi B., Yu Q.C., Marsh J.A., Conceicao C.M., Wilson J.M. Purification of recombinant adeno-associated virus vectors by column chromatography and its performance in vivo. Hum. Gene Ther. 2000;11:2079–2091. doi: 10.1089/104303400750001390. [DOI] [PubMed] [Google Scholar]
- 29.Ayuso E., Blouin V., Lock M., McGorray S., Leon X., Alvira M.R., Auricchio A., Bucher S., Chtarto A., Clark K.R., et al. Manufacturing and characterization of a recombinant adeno-associated virus type 8 reference standard material. Hum. Gene Ther. 2014;25:977–987. doi: 10.1089/hum.2014.057. [DOI] [PMC free article] [PubMed] [Google Scholar]
- 30.Qu W., Wang M., Wu Y., Xu R. Scalable downstream strategies for purification of recombinant adeno- associated virus vectors in light of the properties. Curr. Pharmaceut. Biotechnol. 2015;16:684–695. doi: 10.2174/1389201016666150505122228. [DOI] [PMC free article] [PubMed] [Google Scholar]
- 31.Grieger J.C., Soltys S.M., Samulski R.J. Production of Recombinant Adeno-associated Virus Vectors Using Suspension HEK293 Cells and Continuous Harvest of Vector From the Culture Media for GMP FIX and FLT1 Clinical Vector. Mol. Ther. 2016;24:287–297. doi: 10.1038/mt.2015.187. [DOI] [PMC free article] [PubMed] [Google Scholar]
- 32.Joshi P.R.H., Bernier A., Moço P.D., Schrag J., Chahal P.S., Kamen A. Development of a scalable and robust AEX method for enriched rAAV preparations in genome-containing VCs of serotypes 5, 6, 8, and 9. Mol. Ther. Methods Clin. Dev. 2021;21:341–356. doi: 10.1016/j.omtm.2021.03.016. [DOI] [PMC free article] [PubMed] [Google Scholar]
- 33.Burnham B., Nass S., Kong E., Mattingly M., Woodcock D., Song A., Wadsworth S., Cheng S.H., Scaria A., O'Riordan C.R. Analytical Ultracentrifugation as an Approach to Characterize Recombinant Adeno-Associated Viral Vectors. Hum. Gene Ther. Methods. 2015;26:228–242. doi: 10.1089/hgtb.2015.048. [DOI] [PubMed] [Google Scholar]
- 34.Werle A.K., Powers T.W., Zobel J.F., Wappelhorst C.N., Jarrold M.F., Lyktey N.A., Sloan C.D.K., Wolf A.J., Adams-Hall S., Baldus P., Runnels H.A. Comparison of analytical techniques to quantitate the capsid content of adeno-associated viral vectors. Mol. Ther. Methods Clin. Dev. 2021;23:254–262. doi: 10.1016/j.omtm.2021.08.009. [DOI] [PMC free article] [PubMed] [Google Scholar]
- 35.McIntosh N.L., Berguig G.Y., Karim O.A., Cortesio C.L., De Angelis R., Khan A.A., Gold D., Maga J.A., Bhat V.S. Comprehensive characterization and quantification of adeno associated vectors by size exclusion chromatography and multi angle light scattering. Sci. Rep. 2021;11:3012. doi: 10.1038/s41598-021-82599-1. [DOI] [PMC free article] [PubMed] [Google Scholar]
- 36.Barnes L.F., Draper B.E., Jarrold M.F. Analysis of thermally driven structural changes, genome release, disassembly, and aggregation of recombinant AAV by CDMS. Mol. Ther. Methods Clin. Dev. 2022;27:327–336. doi: 10.1016/j.omtm.2022.10.008. [DOI] [PMC free article] [PubMed] [Google Scholar]
- 37.Pierson E.E., Keifer D.Z., Asokan A., Jarrold M.F. Resolving Adeno-Associated Viral Particle Diversity With Charge Detection Mass Spectrometry. Anal. Chem. 2016;88:6718–6725. doi: 10.1021/acs.analchem.6b00883. [DOI] [PMC free article] [PubMed] [Google Scholar]
- 38.Barnes L.F., Draper B.E., Chen Y.T., Powers T.W., Jarrold M.F. Quantitative analysis of genome packaging in recombinant AAV vectors by charge detection mass spectrometry. Mol. Ther. Methods Clin. Dev. 2021;23:87–97. doi: 10.1016/j.omtm.2021.08.002. [DOI] [PMC free article] [PubMed] [Google Scholar]
- 39.McCarty D.M. Self-complementary AAV vectors; advances and applications. Mol. Ther. 2008;16:1648–1656. doi: 10.1038/mt.2008.171. [DOI] [PubMed] [Google Scholar]
- 40.Fagone P., Wright J.F., Nathwani A.C., Nienhuis A.W., Davidoff A.M., Gray J.T. Systemic errors in quantitative polymerase chain reaction titration of self-complementary adeno-associated viral vectors and improved alternative methods. Hum. Gene Ther. Methods. 2012;23:1–7. doi: 10.1089/hgtb.2011.104. [DOI] [PMC free article] [PubMed] [Google Scholar]
- 41.Lock M., Alvira M.R., Chen S.J., Wilson J.M. Absolute determination of single-stranded and self-complementary adeno-associated viral vector genome titers by droplet digital PCR. Hum. Gene Ther. Methods. 2014;25:115–125. doi: 10.1089/hgtb.2013.131. [DOI] [PMC free article] [PubMed] [Google Scholar]
- 42.Funakoshi K., Bagheri M., Zhou M., Suzuki R., Abe H., Akashi H. Highly sensitive and specific Alu-based quantification of human cells among rodent cells. Sci. Rep. 2017;7:13202. doi: 10.1038/s41598-017-13402-3. [DOI] [PMC free article] [PubMed] [Google Scholar]
- 43.Deutscher S.L., Nuwayhid N., Stanley P., Briles E.I., Hirschberg C.B. Translocation across Golgi vesicle membranes: a CHO glycosylation mutant deficient in CMP-sialic acid transport. Cell. 1984;39:295–299. doi: 10.1016/0092-8674(84)90007-2. [DOI] [PubMed] [Google Scholar]
- 44.Shen S., Bryant K.D., Brown S.M., Randell S.H., Asokan A. Terminal N-linked galactose is the primary receptor for adeno-associated virus 9. J. Biol. Chem. 2011;286:13532–13540. doi: 10.1074/jbc.M110.210922. [DOI] [PMC free article] [PubMed] [Google Scholar]
- 45.Mullard A. Gene therapy community grapples with toxicity issues, as pipeline matures. Nat. Rev. Drug Discov. 2021;20:804–805. doi: 10.1038/d41573-021-00164-x. [DOI] [PubMed] [Google Scholar]
- 46.Tran N.T., Lecomte E., Saleun S., Namkung S., Robin C., Weber K., Devine E., Blouin V., Adjali O., Ayuso E., et al. Human and Insect Cell-Produced Recombinant Adeno-Associated Viruses Show Differences in Genome Heterogeneity. Hum. Gene Ther. 2022;33:371–388. doi: 10.1089/hum.2022.050. [DOI] [PMC free article] [PubMed] [Google Scholar]
- 47.Rao R., Farraha M., Logan G.J., Igoor S., Kok C.Y., Chong J.J.H., Alexander I.E., Kizana E. Performance of Cardiotropic rAAV Vectors Is Dependent on Production Method. Viruses. 2022;14 doi: 10.3390/v14081623. [DOI] [PMC free article] [PubMed] [Google Scholar]
- 48.Rumachik N.G., Malaker S.A., Poweleit N., Maynard L.H., Adams C.M., Leib R.D., Cirolia G., Thomas D., Stamnes S., Holt K., et al. Methods Matter: Standard Production Platforms for Recombinant AAV Produce Chemically and Functionally Distinct Vectors. Mol. Ther. Methods Clin. Dev. 2020;18:98–118. doi: 10.1016/j.omtm.2020.05.018. [DOI] [PMC free article] [PubMed] [Google Scholar]
- 49.Miller L.M., Jarrold M.F. Charge detection mass spectrometry for the analysis of viruses and virus-like particles. Essays Biochem. 2023;67:315–323. doi: 10.1042/EBC20220101. [DOI] [PMC free article] [PubMed] [Google Scholar]
- 50.Contino N.C., Pierson E.E., Keifer D.Z., Jarrold M.F. Charge detection mass spectrometry with resolved charge states. J. Am. Soc. Mass Spectrom. 2013;24:101–108. doi: 10.1007/s13361-012-0525-5. [DOI] [PubMed] [Google Scholar]
- 51.Keifer D.Z., Pierson E.E., Jarrold M.F. Charge detection mass spectrometry: weighing heavier things. Analyst. 2017;142:1654–1671. doi: 10.1039/c7an00277g. [DOI] [PubMed] [Google Scholar]
- 52.Draper B.E., Anthony S.N., Jarrold M.F. The FUNPET-a New Hybrid Ion Funnel-Ion Carpet Atmospheric Pressure Interface for the Simultaneous Transmission of a Broad Mass Range. J. Am. Soc. Mass Spectrom. 2018;29:2160–2172. doi: 10.1007/s13361-018-2038-3. [DOI] [PubMed] [Google Scholar]
- 53.Zen Z., Espinoza Y., Bleu T., Sommer J.M., Wright J.F. Infectious titer assay for adeno-associated virus vectors with sensitivity sufficient to detect single infectious events. Hum. Gene Ther. 2004;15:709–715. doi: 10.1089/1043034041361262. [DOI] [PubMed] [Google Scholar]
- 54.Lock M., McGorray S., Auricchio A., Ayuso E., Beecham E.J., Blouin-Tavel V., Bosch F., Bose M., Byrne B.J., Caton T., et al. Characterization of a recombinant adeno-associated virus type 2 Reference Standard. Hum. Gene Ther. 2010;21:1273–1285. doi: 10.1089/hum.2009.223. [DOI] [PMC free article] [PubMed] [Google Scholar]
- 55.Stanley P., Narasimhan S., Siminovitch L., Schachter H. Chinese hamster ovary cells selected for resistance to the cytotoxicity of phytohemagglutinin are deficient in a UDP-N-acetylglucosamine--glycoprotein N-acetylglucosaminyltransferase activity. Proc. Natl. Acad. Sci. USA. 1975;72:3323–3327. doi: 10.1073/pnas.72.9.3323. [DOI] [PMC free article] [PubMed] [Google Scholar]
Associated Data
This section collects any data citations, data availability statements, or supplementary materials included in this article.
Supplementary Materials
Data Availability Statement
Non-proprietary data from this work are available upon request from the corresponding author (B.T.).