TO THE EDITOR:
Transgender and gender diverse (TGD) are umbrella terms that describe people whose gender identities differ from their sex assigned at birth or who are not encompassed by the gender-binary paradigm. It is estimated that up to 2% of high school students identify as TGD, a figure that has increased over the past decade.1 TGD individuals may experience gender dysphoria, which refers to the distress experienced by the incongruence between one’s gender identity and physical characteristics.2 Testosterone-based gender-affirming hormone therapy (GAHT) may be prescribed for eligible individuals to ameliorate gender dysphoria by producing physiological features that are more congruent with one’s gender identity.3 GAHT results in improved quality of life and a significant reduction in the levels of gender dysphoria.4,5
The Endocrine Society and World Professional Association for Transgender Health recommend puberty blockade, typically with a gonadotropin-releasing hormone analog (GnRHa), for eligible patients who identify as TGD experiencing gender dysphoria starting at Tanner stage 2 pubertal development.6,7 GnRHa treatment alone reversibly pauses the development of secondary sex characteristics and can provide additional time for gender identity exploration.8,9
Prior studies have shown that testosterone therapy is associated with erythrocytosis and dyslipidemia.10,11 Some studies suggest that testosterone may increase the risk of myocardial infarction in male patients who identify as TGD (ie, individuals with female sex assigned at birth but a male gender identity) when compared with cisgender men and women, although the overall results are conflicting and inconclusive.12, 13, 14
In individuals who identify as TGD, an increase in hematocrit levels (ie, red blood cell [RBC] production) and blood viscosity that can accompany testosterone therapy may underlie the cardiovascular and cerebral risk potentially associated with testosterone.12, 13, 14 Little is known about the metabolic effects of GnRHa alone or with subsequent testosterone-based GAHT on RBCs in this population, which is the focus of this study.
Fifteen adolescent participants who identified as TGD, assigned female at birth aged between 13 and 16 years were enrolled in a longitudinal, observational study, evaluating the relationship between testosterone and the changes in metabolic profile (supplemental Materials and Methods extended). Study visits occurred before and 1 and 12 months after exogenous testosterone therapy (NCT03557268). Seven participants received GnRHa treatment. Youth were recruited from June 2018 to August 2019 from the Trust, Understand, Respect, Emerge Center for Gender Diversity at Children’s Hospital Colorado. The study was conducted according to the Declaration of Helsinki. All participants were clinically prescribed subcutaneous testosterone cypionate (dose escalation over 12 months). Pubertal staging was performed by a pediatric endocrinologist using the standards of Tanner and Marshall.15 Metabolome analyses were performed as previously described.16
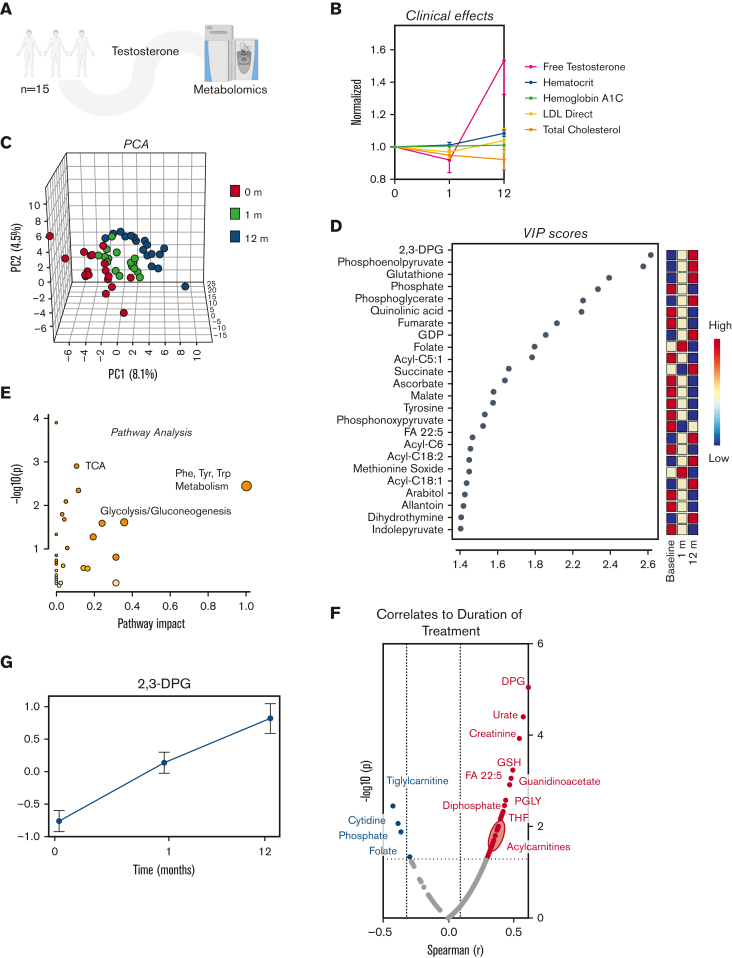
In this longitudinal study, samples were collected at baseline and 1 and 12 months after testosterone therapy from 15 adolescents assigned female at birth (average age 15.0 ± 1.0 years at baseline; Figure 1A). Expectedly, we observed increases in free testosterone with testosterone treatment, as well as a minor, albeit significant increase in hematocrit levels over time and a nonsignificant decrease in total cholesterol levels (Figure 1B). Pathway analysis of the 25 RBC metabolites most significantly affected by testosterone (as determined by principal component analysis; Figure 1C-D; supplemental Table 1) showed a clear effect on energy, carboxylic and amino acid metabolism (Figure 1E). Among the metabolites whose levels most significantly correlated with duration of treatment (Spearman correlation; Figure 1F), we noted 2,3-DPG (Figure 1G) and several acylcarnitines.
Figure 1.
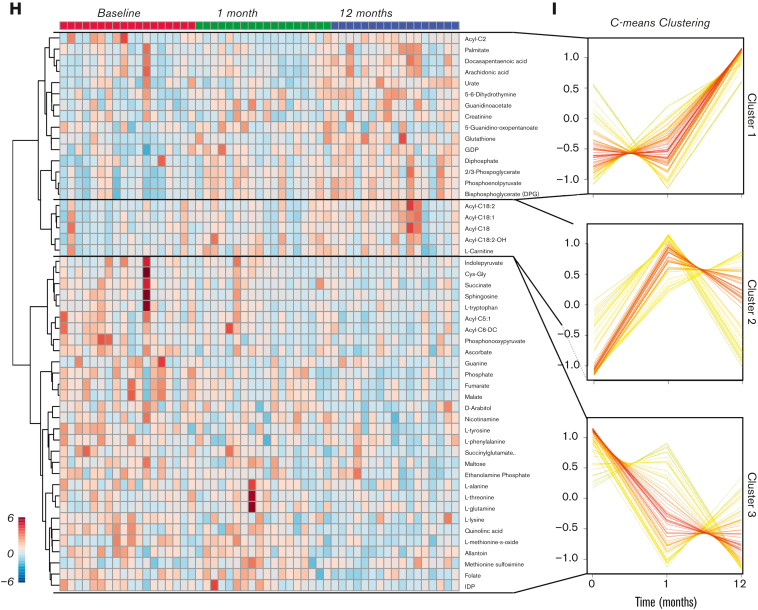
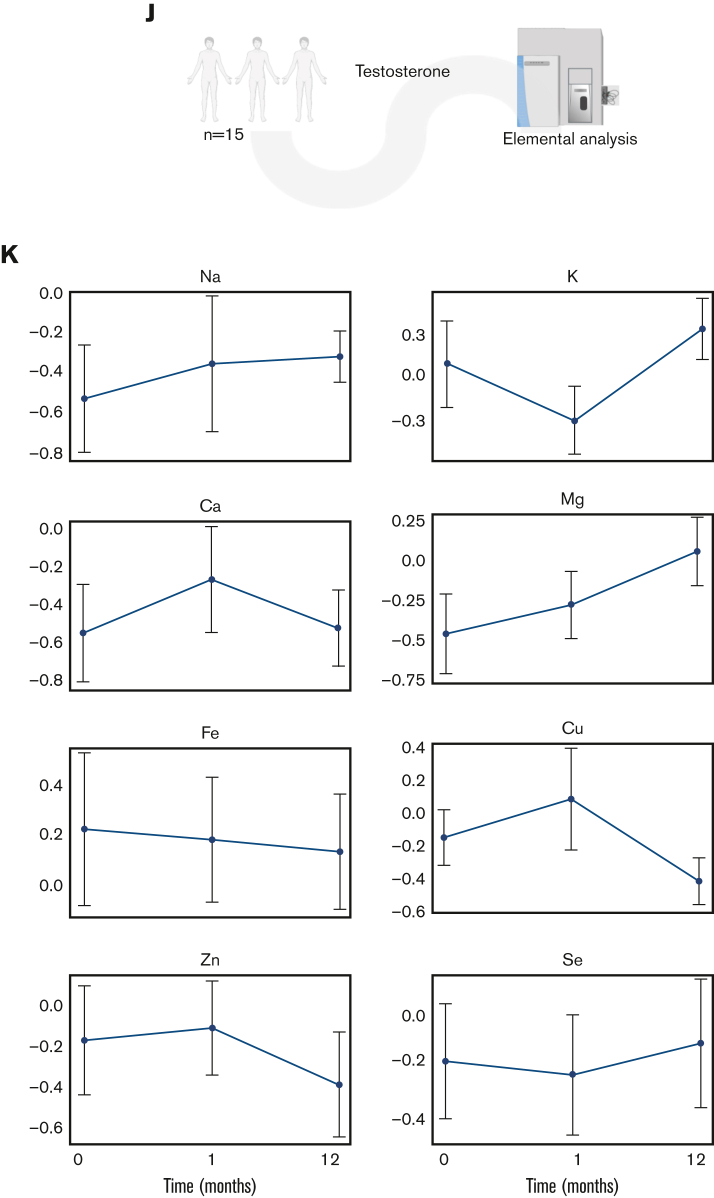
Metabolome analysis reveals time-dependent metabolic effect of testosterone over a 12-month period. (A) RBC samples were taken from adolescent patients (N = 15) at baseline and 1 and 12 months after starting testosterone. (B) A line plot of the data normalized to 0 months revealed various descriptive variables that changed over time. (C) A principal component analysis revealed distinct clustering patterns between the baseline, 1-month, and 12-month timepoints. (D) A variable importance in projection (VIP) plot suggested that acylcarnitines as well as metabolites from glycolysis and the trichloroacetic acid (TCA) were most influential in the PLS-DA clustering pattern. (E) Pathway analysis revealed the pathways most affected by treatment duration. (F) A Spearman rank order correlation of the normalized data determined the top significant correlates to testosterone duration (P ≤ .05). (G) A line plot of diphosphoglycerate (DPG) shows that it increases over treatment duration (mean± standard error of the mean). Testosterone alters the global metabolome. (H) Hierarchal clustering analysis of the top 50 most significant metabolites by analysis of variance revealed time-dependent changes in acylcarnitines, glycolysis, and purine metabolism. (I) Separate clustering by C-means uncovered 3 groups of metabolites with distinct time-dependent trends that support the analysis of variance findings. (J) An elemental inductively coupled plasma-mass-spectrometry analysis was performed on RBC samples (N = 15) to determine cation levels. (K) Line plots revealed ion-specific trends over testosterone duration (mean ± standard error of the mean). LDL, low-density lipoprotein; PLS-DA, partial least squares discriminant analysis.
Further multivariate analyses (hierarchal clustering analysis; Figure 1H and C-means clustering; Figure 1I) highlighted the following main trends upon testosterone treatment: glycolytic metabolites, DPG (Rapoport Luebering), and several polyunsaturated fatty acids increased sharply between 1 and 12 months (cluster 1); L-carnitines and long-chain acylcarnitines increased between baseline and 1 month, then decreased slightly between 1 and 12 months (cluster 2); shorter-chain acylcarnitines, some amino acids, and carboxylic acids decreased with treatment duration (cluster 3). Focusing on glycolysis (supplemental Figure 1), glucose and 2,3-phosphoglycerate increased, and lactate and pyruvate decreased after GAHT. These contrasting trends for metabolites in the same pathway suggest that (1) the observed increases in DPG, adenosine triphosphate, and adenosine 5′-diphosphate levels are not merely attributable to increased RBC mass (testosterone-induced increases in hematocrit) and (2) testosterone may induce rewiring in late glycolysis with modulation of the activity of enzymes downstream to phosphoglycerate, such as redox sensitive17 pyruvate kinase.18 Increases in high-energy phosphate compounds are consistent with testosterone treatment, positively affecting the RBCs’ capacity to off-load oxygen, given the role of these metabolites in stabilizing the tense deoxygenated state of hemoglobin.19 Moreover, sphingosine 1-phosphate, pyridoxal, creatinine, urate, and methionine sulfoxide (redox markers) increased during the course of treatment (supplemental Figure 1). Decreases in all carboxylic acids after testosterone treatment were accompanied by increases in 2-oxoglutarate, a negative regulator of hypoxia-inducible factor 1 alpha (HIF1α) by the mechanism of prolyl hydroxylase–dependent posttranslational modification of HIF1α.20,21 This observation is suggestive of potential compensatory mechanisms counteracting testosterone-induced erythropoiesis through antagonism of HIF1α signaling.
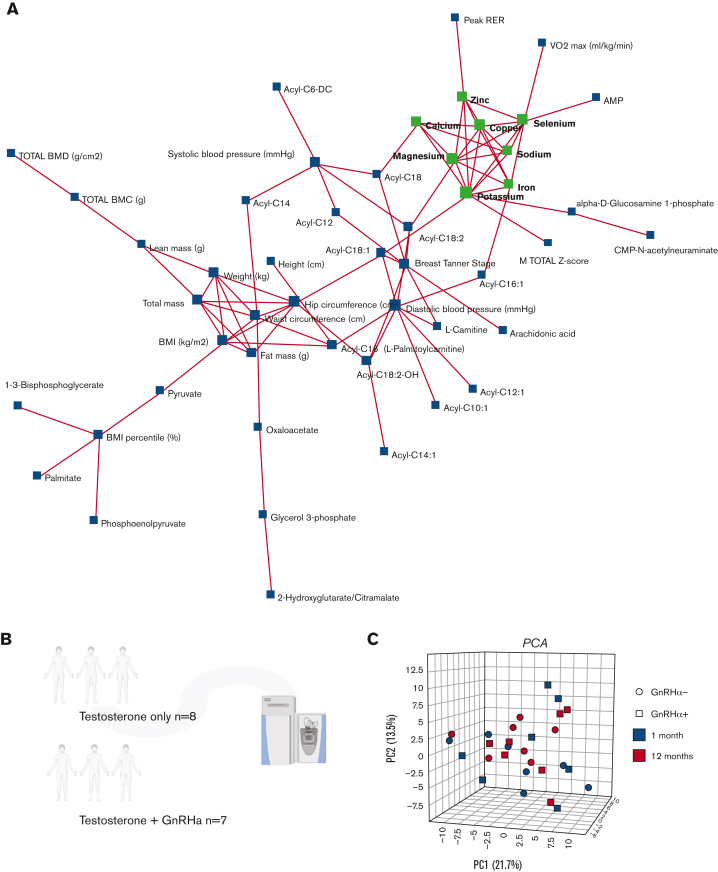
Trace element analysis (Figure 1K) showed an impact of testosterone on RBC levels of magnesium, sodium, and calcium, showing incremental to transient increases at 1 and 12 months through the treatment. Declines in zinc and iron are consistent with an exacerbation of erythropoiesis in the absence of dietary increases in iron uptake (Figure 1L). Network elaboration of the data from correlation analyses (Figure 2A) showed that ion levels were associated with functional exercise measurements (VO2 peak and peak respiratory exchange ratio). By contrast, acylcarnitines (free carnitine; acyl C10:1;12;12:1;14:0;14:1;16:0;16:1;18:0,18:1;18:2, palmitate, late glycolysis [DPG, pyruvate, and phosphoenolpyruvate]) all strongly correlated with body mass index, fat mass, waist and hip circumference, total/lean mass and diastolic blood pressure, and chest Tanner stage (Figure 2A).
Figure 2.
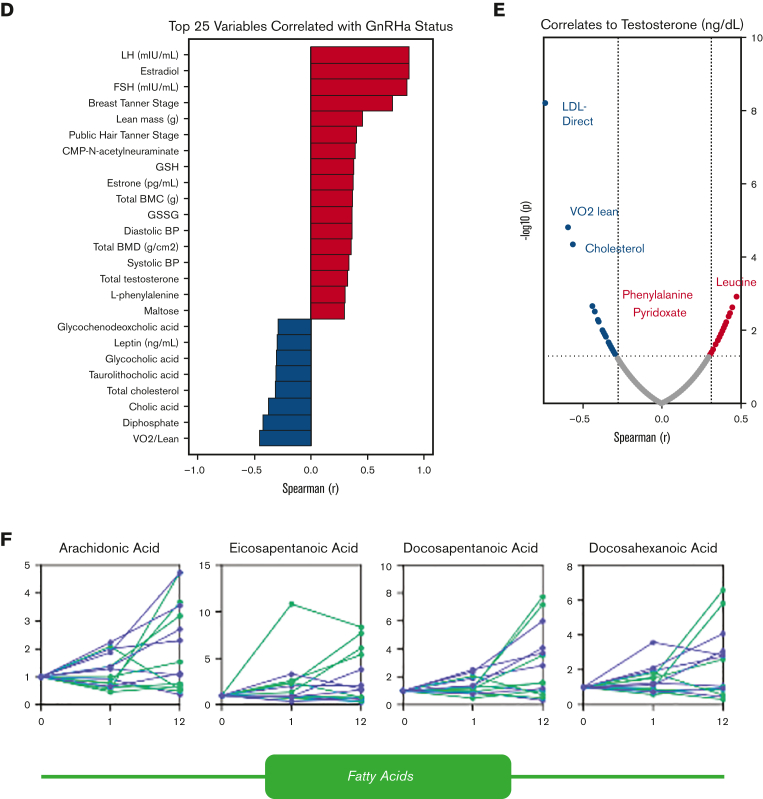
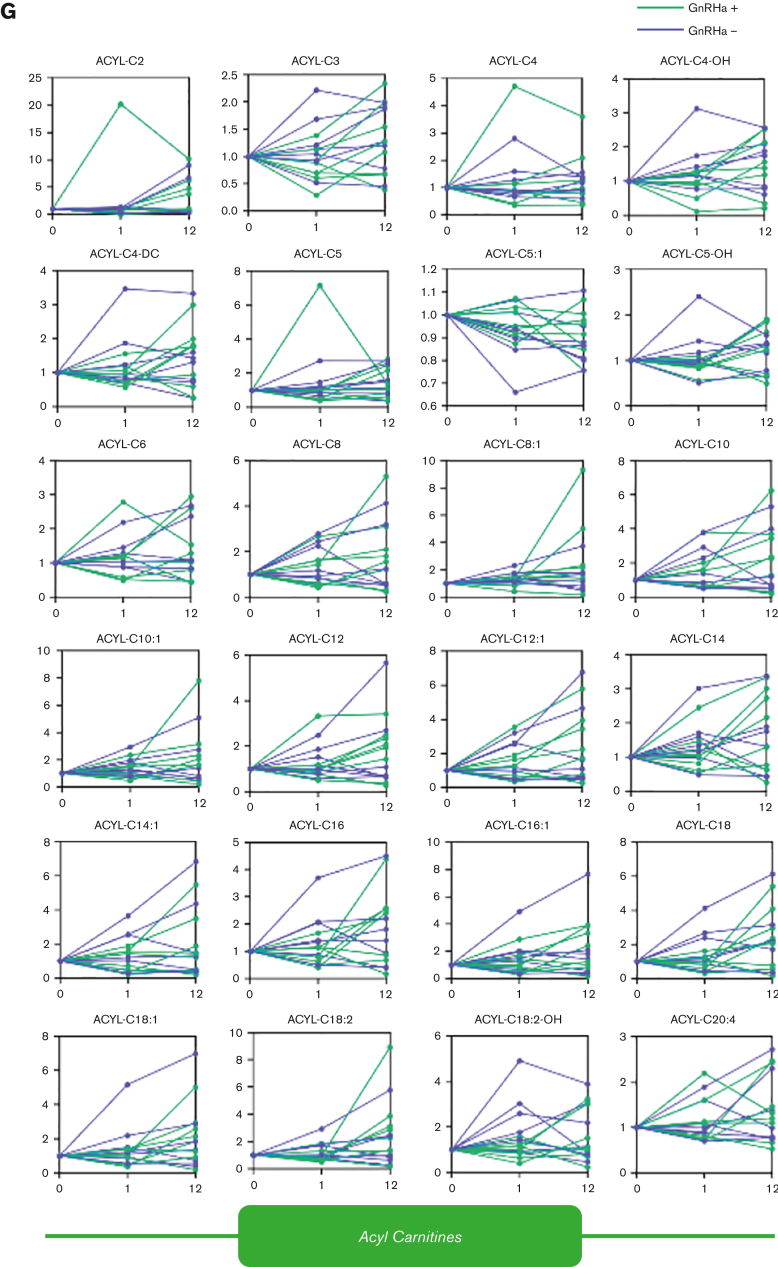
A correlation network of trace element data to metabolome and clinical features was performed to reveal clustering patterns within the data. (A) Each feature (metabolite, clinical variable, or trace element) is represented as a node, and edges represent correlations | r | > 0.5. Inductively coupled plasma-mass-spectrometry analysis suggests the effect of testosterone on ion-homeostasis. Metabolome analyses were performed on patients undergoing testosterone treatment with (N = 7) and without ((N = 8) GnRHa treatment. (B) A principal component analysis (C) was performed to investigate the effects of both treatment duration and GnRHa status on the data normalized to baseline, then normalized by sum with autoscaling. (D) A Spearman rank order correlation revealed that the top 25 variables correlated most strongly with GnRHa status (data normalized to baseline, then normalized by a median with autoscaling). Testosterone affects RBC metabolome throughout the treatment duration, regardless of GnRHa status. A Spearman rank order correlation determined the descriptive and metabolic features significantly correlated to measured testosterone (P ≤ .05). (E) An analysis of free fatty acids revealed the effects of testosterone and GnRHa status over time. (F) Line plots showed the effect of testosterone and GnRHa status on acylcarnitines throughout the treatment duration (G).
Of the 15 patients undergoing testosterone therapy in this study, a subgroup was also treated with GnRHa (n = 7), whereas the other half was only on testosterone (no-GnRHA; n = 8; Figure 2B). No clear separation based on metabolome data between groups on GnRHa treatment status was done (Figure 2C; supplemental Figure 2A-B). GnRHa treatment was positively associated (Spearman r > 0.6) with hormone levels (luteinizing hormone, follicle-stimulating hormone, and estradiol; Figure 2D) as expected based on the mechanism of action. Notably, GnRHa status was positively associated with metabolic markers of oxidant stress (eg, oxidized glutathione: glutathione disulfide) and negatively associated with VO2 peak, cholic acid, and total cholesterol (Figure 2D).
Intersubject heterogeneity in response to testosterone and GnRHa treatment resulted in poor correlations (r < 0.5) between circulating testosterone concentrations and RBC metabolite levels (Figure 2E; supplemental Results; supplemental Figures 3 and 4). The increase in acylcarnitines seen in this study (Figure 2F-G) may imply an effect of testosterone on membrane stability and increased membrane remodeling through the carnitine-dependent Lands cycle.22,23 Testosterone therapy has been previously correlated with susceptibility to hemolysis in males with hypogonadism, suggesting that the androgens affect membrane damage and repair and may generate a higher demand for acylcarnitines.24,25 An alternative or complementary explanation comes from the appreciation that testosterone treatment may have a differential effect on males compared with people assigned female sex at birth. Carrying 2 copies of chromosome X in the latter group could result in an increased dosage of enzymes coded by genes on this chromosome, despite the inactivation of chromosome X. Examples of such genes are the rate-limiting enzymes of the pentose phosphate pathway: glucose 6-phosphate dehydrogenase, hypoxanthine guanosine phosphoribosyl transferase, creatine transporters or adenosine triphosphate–dependent phosphatidylserine flippase, all enzymes relevant to redox biology of RBC and in vivo clearance in the spleen.
Conflict-of-interest disclosure: Although unrelated to the contents of this manuscript, the authors declare that A.D.A. is a founder of Omix Technologies, Inc. A.D.A. is also a founder of Altis Biosciences, LLC; a scientific advisory board member for Hemanext, Inc. and Forma, Inc., and a consultant for Rubius, Inc. N.J.N. is a consultant for Neurocrine Biosciences. The remaining authors declare no competing financial interests.
Acknowledgments
Acknowledgments: This study was supported by National Institute of General and Medical Sciences grant RM1GM131968 (A.D.A.) and National Heart, Lung, and Blood Institutes grants R01HL146442, R01HL149714, R01HL148151 and R21HL150032 (A.D.A.). Additional support was received from the Endocrine Fellow Foundation, NIH/NCATS UL1 TR002535 (CCTSI CO-Pilot and MicroGrant), University of Colorado, GI & Liver Innate Immune Program, Ludeman Family Center for Women’s Health Research, NIH/NICHD BIRCWH K12 HD 057022, and Doris Duke Foundation.
Contribution: N.J.N. and M.C.G. designed and performed the clinical studies and collected and stored the samples; N.N., M.C.G., and A.D.A. provided essential materials and methods to perform the study; M.K.R., R.B.W., and K.A. performed metabolome analyses; M.K.R. and A.D.A. performed data analysis and prepared the figures and tables; M.K.R. and A.D.A. wrote the first draft of the manuscript, which was revised by all the other authors; and all authors contributed to finalizing the manuscript.
Footnotes
Data are available on request from the corresponding author, Angelo D’Alessandro (angelo.dalessandro@ucdenver.edu).
The full-text version of this article contains a data supplement.
Supplementary Material
References
- 1.Johns MM, Lowry R, Andrzejewski J, et al. Transgender identity and experiences of violence victimization, substance use, suicide risk, and sexual risk behaviors among high school students-19 states and large urban school districts, 2017. MMWR Morb Mortal Wkly Rep. 2019;68(3):67–71. doi: 10.15585/mmwr.mm6803a3. [DOI] [PMC free article] [PubMed] [Google Scholar]
- 2.Diagnostic and statistical manual of mental disorders: DSM-5. American Psychiatric Association; 2013. [Google Scholar]
- 3.Nguyen HB, Chavez AM, Lipner E, et al. Gender-affirming hormone use in transgender individuals: impact on behavioral health and cognition. Curr Psychiatry Rep. 2018;20(12):110. doi: 10.1007/s11920-018-0973-0. [DOI] [PMC free article] [PubMed] [Google Scholar]
- 4.van de Grift TC, Elaut E, Cerwenka SC, et al. Effects of medical interventions on gender dysphoria and body image: a follow-up study. Psychosom Med. 2017;79(7):815–823. doi: 10.1097/PSY.0000000000000465. [DOI] [PMC free article] [PubMed] [Google Scholar]
- 5.Kuper LE, Stewart S, Preston S, Lau M, Lopez X. Body dissatisfaction and mental health outcomes of youth on gender-affirming hormone therapy. Pediatrics. 2020;145(4) doi: 10.1542/peds.2019-3006. [DOI] [PubMed] [Google Scholar]
- 6.Hembree WC, Cohen-Kettenis PT, Gooren L, et al. Endocrine treatment of gender-dysphoric/gender-incongruent persons: an Endocrine Society clinical practice guideline. Endocr Pract. 2017;23(12):1437. doi: 10.4158/1934-2403-23.12.1437. [DOI] [PubMed] [Google Scholar]
- 7.Coleman E, Bockting W, Botzer M, et al. Standards of care for the health of transsexual, transgender, and gender-nonconforming people, version 7. Int J Transgenderism. 2012;13(4):165–232. [Google Scholar]
- 8.Conard LE. Supporting and caring for transgender and gender nonconforming youth in the urology practice. J Pediatr Urol. 2017;13(3):300–304. doi: 10.1016/j.jpurol.2017.02.019. [DOI] [PubMed] [Google Scholar]
- 9.Mahfouda S, Moore JK, Siafarikas A, Zepf FD, Lin A. Puberty suppression in transgender children and adolescents. Lancet Diabetes Endocrinol. 2017;5(10):816–826. doi: 10.1016/S2213-8587(17)30099-2. [DOI] [PubMed] [Google Scholar]
- 10.Madsen MC, van Dijk D, Wiepjes CM, Conemans EB, Thijs A, den Heijer M. Erythrocytosis in a large cohort of trans men using testosterone: a long-term follow-up study on prevalence, determinants, and exposure years. J Clin Endocrinol Metab. 2021;106(6):1710–1717. doi: 10.1210/clinem/dgab089. [DOI] [PMC free article] [PubMed] [Google Scholar]
- 11.Maraka S, Singh Ospina N, Rodriguez-Gutierrez R, et al. Sex steroids and cardiovascular outcomes in transgender individuals: a systematic review and meta-analysis. J Clin Endocrinol Metab. 2017;102(11):3914–3923. doi: 10.1210/jc.2017-01643. [DOI] [PubMed] [Google Scholar]
- 12.Alzahrani T, Nguyen T, Ryan A, et al. Cardiovascular disease risk factors and myocardial infarction in the transgender population. Circ Cardiovasc Qual Outcomes. 2019;12(4) doi: 10.1161/CIRCOUTCOMES.119.005597. [DOI] [PubMed] [Google Scholar]
- 13.Nokoff NJ, Scarbro S, Juarez-Colunga E, Moreau KL, Kempe A. Health and cardiometabolic disease in transgender adults in the united states: behavioral risk factor surveillance system 2015. J Endocr Soc. 2018;2(4):349–360. doi: 10.1210/js.2017-00465. [DOI] [PMC free article] [PubMed] [Google Scholar]
- 14.Nota NM, Wiepjes CM, de Blok CJM, Gooren LJG, Kreukels BPC, den Heijer M. Occurrence of acute cardiovascular events in transgender individuals receiving hormone therapy. Circulation. 2019;139(11):1461–1462. doi: 10.1161/CIRCULATIONAHA.118.038584. [DOI] [PubMed] [Google Scholar]
- 15.Marshall WA, Tanner JM. Variations in pattern of pubertal changes in girls. Arch Dis Child. 1969;44(235):291–303. doi: 10.1136/adc.44.235.291. [DOI] [PMC free article] [PubMed] [Google Scholar]
- 16.D'Alessandro A, Fu X, Kanias T, et al. Donor sex, age and ethnicity impact stored red blood cell antioxidant metabolism through mechanisms in part explained by glucose 6-phosphate dehydrogenase levels and activity. Haematologica. 2021;106(5):1290–1302. doi: 10.3324/haematol.2020.246603. [DOI] [PMC free article] [PubMed] [Google Scholar]
- 17.van de Wetering C, Manuel AM, Sharafi M, et al. Glutathione-S-transferase P promotes glycolysis in asthma in association with oxidation of pyruvate kinase M2. Redox Biol. 2021;47 doi: 10.1016/j.redox.2021.102160. [DOI] [PMC free article] [PubMed] [Google Scholar]
- 18.Roy MK, Cendali F, Ooyama G, Gamboni F, Morton H, D'Alessandro A. Red blood cell metabolism in pyruvate kinase deficient patients. Front Physiol. 2021;12 doi: 10.3389/fphys.2021.735543. [DOI] [PMC free article] [PubMed] [Google Scholar]
- 19.Donovan K, Meli A, Cendali F, et al. Stored blood has compromised oxygen unloading kinetics that can be normalized with rejuvenation and predicted from corpuscular side-scatter. Haematologica. 2022;107(1):298–302. doi: 10.3324/haematol.2021.279296. [DOI] [PMC free article] [PubMed] [Google Scholar]
- 20.Fong GH, Takeda K. Role and regulation of prolyl hydroxylase domain proteins. Cell Death Differ. 2008;15(4):635–641. doi: 10.1038/cdd.2008.10. [DOI] [PubMed] [Google Scholar]
- 21.Selak MA, Armour SM, MacKenzie ED, et al. Succinate links TCA cycle dysfunction to oncogenesis by inhibiting HIF-alpha prolyl hydroxylase. Cancer Cell. 2005;7(1):77–85. doi: 10.1016/j.ccr.2004.11.022. [DOI] [PubMed] [Google Scholar]
- 22.Nemkov T, Skinner S, Nader E, et al. Acute cycling exercise induces changes in red blood cell deformability and membrane lipid remodeling. Int J Mol Sci. 2021;22(2):896. doi: 10.3390/ijms22020896. [DOI] [PMC free article] [PubMed] [Google Scholar]
- 23.Lands WE. Metabolism of glycerolipides; a comparison of lecithin and triglyceride synthesis. J Biol Chem. 1958;231(2):883–888. [PubMed] [Google Scholar]
- 24.Kanias T, Lanteri MC, Page GP, et al. Ethnicity, sex, and age are determinants of red blood cell storage and stress hemolysis: results of the REDS-III RBC-Omics study. Blood Adv. 2017;1(15):1132–1141. doi: 10.1182/bloodadvances.2017004820. [DOI] [PMC free article] [PubMed] [Google Scholar]
- 25.Alexander K, Hazegh K, Fang F, et al. Testosterone replacement therapy in blood donors modulates erythrocyte metabolism and susceptibility to hemolysis in cold storage. Transfusion. 2021;61(1):108–123. doi: 10.1111/trf.16141. [DOI] [PMC free article] [PubMed] [Google Scholar]
Associated Data
This section collects any data citations, data availability statements, or supplementary materials included in this article.


