Abstract
Adverse effects associated with exposure to brominated flame retardants have led to regulations for their use and their replacement with organophosphate esters (OPEs). However, little is known about the impact of OPEs on the adrenal, a vital endocrine gland. Here, we used a high-content screening approach to elucidate the effects of OPEs on H295R human adrenal cell phenotypic endpoints and function. The effects of 2,2′,4,4′-tetrabromodiphenyl ether (BDE-47), a legacy brominated flame retardant, on H295R cell cytotoxicity, oxidative stress, mitochondria, lysosomes, and lipid droplets were compared with those of 6 OPEs. Most OPEs reduced oxidative stress, increased the numbers of mitochondria, decreased lysosomes, and increased lipid droplets. Two potency ranking approaches, the lowest benchmark concentration/administered equivalent dose methods and Toxicological Prioritization Index analyses, revealed that the triaryl-OPEs (isopropylated triphenyl phosphate [IPPP], tris(methylphenyl) phosphate [TMPP], and triphenyl phosphate [TPHP]) and 1 nontriaryl OPE (tris(1,3-dichloro-2-propyl) phosphate [TDCIPP]) were more potent than BDE-47. The steroidogenic activity of adrenal cells in the presence or absence of forskolin, a steroidogenic stimulus, was determined after exposure to triaryl-OPEs. The basal production of cortisol and aldosterone was increased by IPPP but decreased by TPHP or TMPP exposure; the response to forskolin was not affected by these OPEs. All 3 triaryl OPEs altered the expression of rate-limiting enzymes involved in cholesterol and steroid biosynthesis; CYP11B1 and CYP11B2 were the most prominently affected targets. The OPE chemical-specific effects on cortisol and aldosterone production were best explained by alterations in STAR expression. Thus, the adrenal may be an important target for these endocrine-disrupting chemicals.
Keywords: organophosphate esters, H295R human adrenal cells, steroidogenesis, endocrine disrupting chemicals
Flame retardants are chemicals added to consumer products and building materials to prevent the ignition or slow the spread of fire. The polybrominated diphenyl ether (PBDE) flame retardants were used extensively for decades; however, their persistence and bioaccumulative properties, as well as the associated toxicities, have led to regulations and/or voluntary phase-out of their use worldwide since the early 2000s (1). Organophosphate esters (OPEs) have emerged as major replacement flame retardants, in addition to their roles as additives in plasticizers, hydraulic fluids, and antifoaming agents (2, 3). Consequently, the production and volume of consumption of OPEs have increased (3-5). Like PBDEs, OPEs are not covalently bound to the materials to which they are added and can be readily released to the surrounding environment, leading to ubiquitous exposures. Indeed, OPEs have been detected in various environmental compartments and human matrices at levels that are higher in comparison to the legacy PBDEs (6-13).
Increased use of and exposure to OPEs have raised concerns regarding their potential adverse health effects. Authoritative bodies, such as Health Canada, the US Environmental Protection Agency, and the European Chemicals Agency, have undertaken initiatives to identify and manage the risks associated with some OPEs (14-16). While ongoing assessments are being conducted, a growing body of evidence suggests that OPEs can act as endocrine disrupting chemicals. A study by Kojima et al (17) revealed that several OPEs can act on human nuclear receptors as agonists or antagonists; these include the estrogen, androgen, and thyroid receptors. Some OPEs have also been associated with adverse effects on neurodevelopment (18-20), thyroid homeostasis (21, 22), and reproductive parameters (22-24) both in human populations and animal models. Furthermore, several OPEs, including those frequently detected in the environment, have demonstrated greater toxicity than the legacy PBDEs (25-27). Those findings suggest that exposure to some OPEs may pose a risk to the endocrine system and consequently have an impact on our overall health.
The adrenal gland is a vulnerable site for toxicological assault due to its high vascularity, the significant presence of enzymes from the cytochrome P450 (CYP) family, and ability to take up and store lipophilic compounds (28-30). However, only a few studies have assessed the effects of exposure to a limited number of OPEs on the adrenal gland. In animal models, exposure to tris(methylphenyl) phosphate (TMPP) affected adrenal gland weight and induced adrenal cortex vacuolization in mice and in rats (31-34). Adrenal gland weights were also increased in adult Wistar rats exposed to isopropylated triphenyl phosphate (IPPP) (35) or tris(1,3-dichloro-2-propyl) phosphate (TDCIPP) (36). In vitro studies using H295R adrenal cells have demonstrated that their steroidogenic function was affected by several OPEs, potentially by altering the genes involved in the steroidogenic pathways (37, 38). Moreover, OPEs and their primary metabolites were reported to have antagonistic activities on the mineralocorticoid receptor and/or glucocorticoid receptor (39, 40). Collectively, these studies provide compelling evidence that OPEs may target the adrenal gland, highlighting the need for further studies to understand the impact of OPE exposures on the adrenal gland and to elucidate the underlying mechanism(s) involved.
In the current study, we assessed the effects of OPEs on the phenotype and function of H295R human adrenal cells. H295R cells were selected for their ability to be stably maintained in culture, their expression of all the enzymes involved in the steroidogenic pathway, and the recommendation from OECD for their use as a test model for evaluating the effects of chemicals on steroidogenesis (41). We investigated the effects of 6 OPEs commonly found in Canadian house dust (42, 43) on various phenotypic cellular characteristics using high-content screening. A major PBDE congener, 2,2′,4,4′-tetrabromodiphenyl ether (BDE-47), was used as a reference chemical. Based on the effects of OPEs on phenotypic endpoints, a combination of data analysis methods was used to determine potency rankings and to estimate the administered equivalent doses (AEDs) in humans. Further, we examined the impact of the 3 most potent OPEs on the steroid-producing function of H295R cells and the potential underlying mechanism(s) involved in the action of OPEs on this adrenal cell function.
Materials and Methods
Chemicals
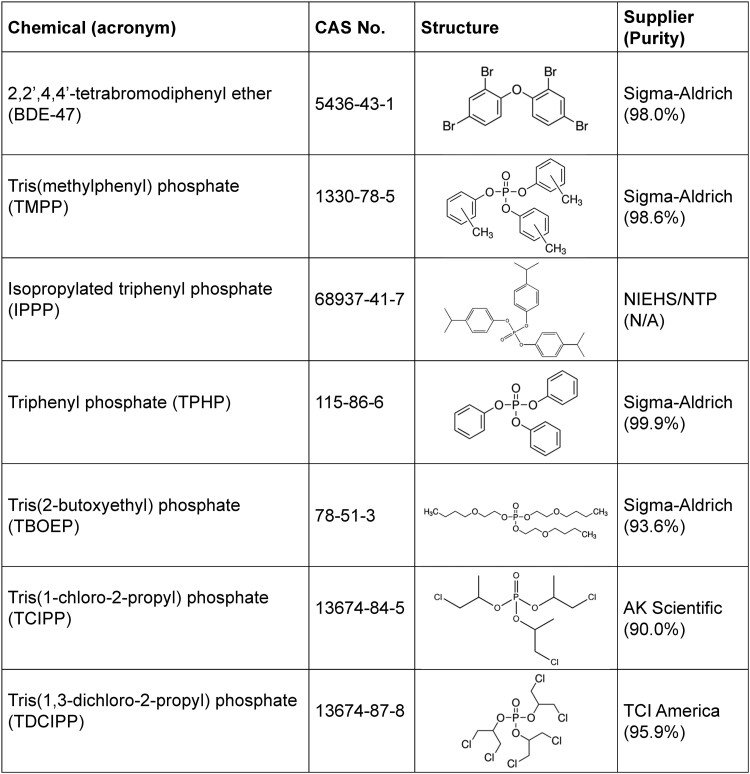
Figure 1 provides a list of the chemicals tested. BDE-47, tris(2-butoxyethyl) phosphate (TBOEP), TMPP, triphenyl phosphate (TPHP), and TDCIPP were gifts from Dr. Nicole Kleinstreuer (National Toxicology Program Interagency Center for the Evaluation of Alternative Toxicological Methods). IPPP and tris(1-chloro-2-propyl) phosphate (TCIPP) were kindly provided by Dr. Michael G. Wade (Health Canada). All chemicals were dissolved in dimethyl sulfoxide (Sigma-Aldrich, St. Louis, Missouri, USA).
Figure 1.
List of chemicals tested.
Cell Cultures
The H295R human adrenocortical carcinoma cells were purchased from ATCC (CRL-2128, Manassas, VA). H295R cells were cultured in phenol-red free Dulbecco’s modified Eagle’s medium/F-12 medium (Gibco, Burlington, Ontario, Canada), supplemented with Corning ITS+ Premix Universal Culture Supplement, Corning Nu-Serum Growth Medium Supplement, and 0.5% 100X penicillin-streptomycin (complete medium) (Wisent Bioproducts, Montreal, Quebec, Canada). Cells were cultured in Corning 75 cm² U-shape cell culture flasks at 37 °C with 5% CO2. The culture medium was renewed every 2 to 3 days.
High-Content Imaging
H295R cells were seeded in 96-well black PhenoPlates with optically clear flat bottoms (Perkin Elmer, Waltham, Massachusetts) precoated with 0.2% collagen 1 (3 mg/mL, rat tail) (Gibco, Burlington, Ontario, Canada) at a seeding density of 10 000 cells/well in 100 μL of complete medium. Cells were given a 24 hours acclimation period prior to chemical treatment and then exposed for 48 hours to a vehicle control (0.5% dimethyl sulfoxide [DMSO]) or each chemical (0.001, 0.01, 0.1, 1, 5, 10, 20, 50, or 100 μM). All chemicals were dissolved in DMSO and stored at −20 °C. On the experimental day, the stock solutions were then diluted to the working concentration with complete medium. The final concentration of the solvent DMSO was 0.5%. To assess the effects of exposure on phenotypic characteristics following the chemical treatment period, cells were stained for 30 minutes with 1 of 4 different combinations of cell-permeable fluorescent dyes. Information on the cell-permeable fluorescent dyes, the combinations used, and their dilutions is provided elsewhere (Table S1 (44)).
The Operetta High Content Imaging System (Perkin Elmer) with a nonconfocal 40× high-NA objective was used to read the plates for live cell imaging. For each well, 12 fields were screened; the images that were obtained were analyzed using the Columbus Image Data Storage and Analysis System (Perkin Elmer). The specific parameters assessed, and the detailed settings for each analysis, are provided elsewhere (Methods 1.1 (44)).
Benchmark Concentration Analyses
BMD Express 2.2 (SciOne, Research Triangle Park, North Carolina) was used to derive the benchmark concentrations (BMCs) of the compounds for each phenotypic endpoint. The benchmark response (ie, the predefined level of change from control) was set to 10% according to recommendations from the US Environmental Protection Agency (45). These analytic procedures were described previously by Rajkumar et al (26) and Wang et al (27). In brief, BMC10 values for cytotoxicity were derived using the PROAST 65.5 software package in R console (v.3.6.2); for each phenotypic parameter, values were derived using the BMDExpress 2.2 software. BMC10 values were estimated based on the best-fit model with lowest Akaike information criterion and were reported with the 95% CI (reported as BMCL [lower] and BMCU [upper] limits). For data reliability purposes, the following exclusion criteria were used: the best-fit model should have a global goodness of fit P > .1 and a BMCU/BMCL ratio <40 (45).
Administered Equivalent Dose Analyses
To estimate the AEDs (mg/kg body weight/day), in vitro to in vivo extrapolation modeling was done based on the BMCs and the steady-state concentration (Css) for each compound. The Css values were modeled using the high-throughput toxicokinetics package (v1.10) in R. No additional parameters were required to model the Css for compounds that had input data: (1) that was available in the high-throughput toxicokinetics database (TPHP and TDCIPP), (2) available from Health Canada (TMPP and TCIPP), or (3) that could be collected following the procedures used by Health Canada (BDE-47) (46). For other compounds, ADMET Predictor (version 10) was used for Css derivation. The Css value for each compound and the parameters and formula used in the in vitro to in vivo extrapolation modeling are provided elsewhere (Table S2 (44)). The following formula was used to derive the AED value for each compound (46):
ToxPi Analyses
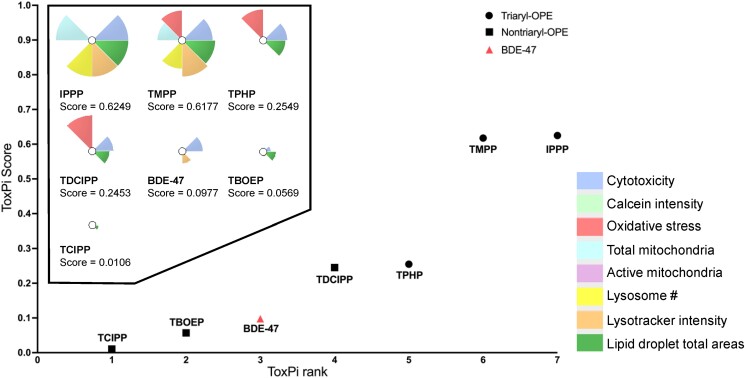
The Toxicological Priority Index (ToxPi) was used as a tool to rank chemicals based on their overall effects on the phenotypic endpoints (v.2.3; available at https://toxpi.org). Endpoints assessed were cytotoxicity, Calcein intensity, oxidative stress, total mitochondria, active mitochondria, number of lysosomes, lysotracker red intensity, and total area of lipid droplets. Specifically, the BMC values for each endpoint were log transformed (Log10BMC) and compared with the log-transformed BMC values of other chemicals. In order to reflect the potency of each chemical on the specific endpoint, they were then scaled between 0 and 1, with 0 being the chemicals inducing no effect and 1 being the most potent chemical. Using the scaled data, the software calculated unitless numbers (ie, the ToxPi score, based on the potency of all the endpoints tested for that chemical) (all endpoints were weighed equally). ToxPi analyses also generated chemical-specific pie charts with each slice representing a phenotypic endpoint; the area of the slice was proportional to the potency of the chemical for that parameter.
Measurement of Basal and Stimulated Production of Cortisol and Aldosterone
H295R cells were seeded in 96 well plates precoated with 0.2% rat tail collagen 1 at a seeding density of 10 000 cells/well in 100 μL of complete medium for 24 hours. The cells were then exposed to 200 μL complete medium containing a triaryl-OPE (IPPP, TMPP, or TPHP) at a concentration of 1 μM or 5 μM in the presence or absence of 10 μM forskolin (Sigma-Aldrich), a steroidogenic stimulus (41), for 48 hours. At the end of the exposure period, cell culture media were pooled from duplicate wells (400 μL in total for each condition) and stored at −80 °C until measurement. To assess the numbers of cells in each well, cells were stained with Hoechst 33342 for 30 minutes with no washing afterwards to prevent cell loss. Plates were then screened with the Operetta High Content Imaging System using a nonconfocal 10× high-NA objective; all fields were screened. The Columbus Image Data Storage and Analysis System was used to quantify the Hoechst-positive cell counts (Methods 1.2 (44)). Cortisol and aldosterone concentrations in the conditioned cell culture media were measured using commercial enzyme-linked immunosorbent assay kits (Cayman Chemical Catalog # 500370, RRID:AB_2935793; Abcam Catalog # ab136933, RRID:AB_2895004, respectively) following the manufacturer's instructions. The SpectraMax Plus 384 microplate reader (Molecular Devices, San Jose, CA, USA) was used to read the enzyme-linked immunosorbent assay plates at a wavelength of 450 nm. The final concentrations were adjusted to the number of cells in each well and are presented as picograms per 1 million cells. The average intra-assay and interassay coefficients of variation were 7.2% and 10.7% for the cortisol assay; they were 4.5% and 13.9% for the aldosterone assay.
Quantitative Real-time Polymerase Chain Reaction
H295R cells were seeded in 6 well plates precoated with collagen at a density of 300 000 cells/well in 1 mL of complete medium (seeding density was adjusted from the density used in the high-content screening experiments based on the surface area ratios of the well). Cells were acclimated for 24 hours prior to exposure to a triaryl-OPE (IPPP, TMPP, or TPHP) at 1 μM or 5 μM for 48 hours, in the presence or absence of 10 μM forskolin (41). Total RNA was extracted using the RNeasy Plus Mini Kit (QIAGEN, Mississauga, Ontario, Canada) following the manufacturer's protocol. The concentration and purity of the extracted RNA were assessed using a NanoDrop 2000 spectrophotometer (ThermoFisher, Waltham, MA, USA).
All primers were obtained from QuantiTect Primer Assays (QIAGEN): HMG-CoA reductase (HMGCR, QT00004081), steroidogenic acute regulatory protein (STAR, QT00091959), steroidogenic factor 1 (NR5A1, QT00088018), cholesterol side-chain cleavage enzyme (CYP11A1, AT00040117), 11-beta-hydroxylase (CYP11B1, QT00028714), aldosterone synthase (CYP11B2, QT00076181), and glyceraldehyde 3-phosphate dehydrogenase (GAPDH, QT00079247). Samples were diluted to 2 ng/μL in RNase-free water. The working concentration was adjusted to 10 ng/μL for transcripts that had moderate to low expression levels in H295R cells (CYP11B1 and CYP11B2). The Power SYBR Green RNA-to-CT 1-Step Kit (Applied Biosystems, Foster City, CA, USA) and the Viia7 real-time polymerase chain reaction (PCR) System (Applied Biosystems) were used to quantify transcript levels. Each 20 μL reaction mix was composed of 0.16 μL of reverse transcriptase, 2 μL of primer, 2.84 μL of RNase-free water, 10 μL of SYBR Green Master Mix, and 5 μL of RNA samples. PCR was conducted under following conditions: 48 °C for 30 minutes, 95 °C for 10 minutes, 40 cycles at 95 °C for 15 seconds, 55 °C for 30 seconds, and 72 °C for 30 seconds. Each reaction was done in triplicate; data were checked to identify and exclude outliers (>0.2 CT values deviating from the average of the other 2). The expression levels of transcripts were calculated based on the average of replicates and were normalized to the amount of the GAPDH transcripts. The QuantStudio Real Time PCR Software (version 1.3) was used for data analysis.
Statistical Analyses
Data were analyzed using GraphPad Prism (version 9.4.1, GraphPad Software Inc., La Jolla, California). For high-content imaging data, Holm–Bonferroni–corrected 1-sample t test was used. For the nonlinear regression analysis, Log (inhibitor) vs response (3 parameters) model was used with the lowest response set as a constant equal to 0. For hormone production levels and mRNA transcript levels, 2-way analysis of variance (ANOVA) was used followed by the Dunnett's test. The minimum level of statistical significance was P < .05. For qRT-PCR data, P < .01 was considered statistically significant. All experiments were repeated independently 5 or 6 times.
Results
Cytotoxicity of OPEs
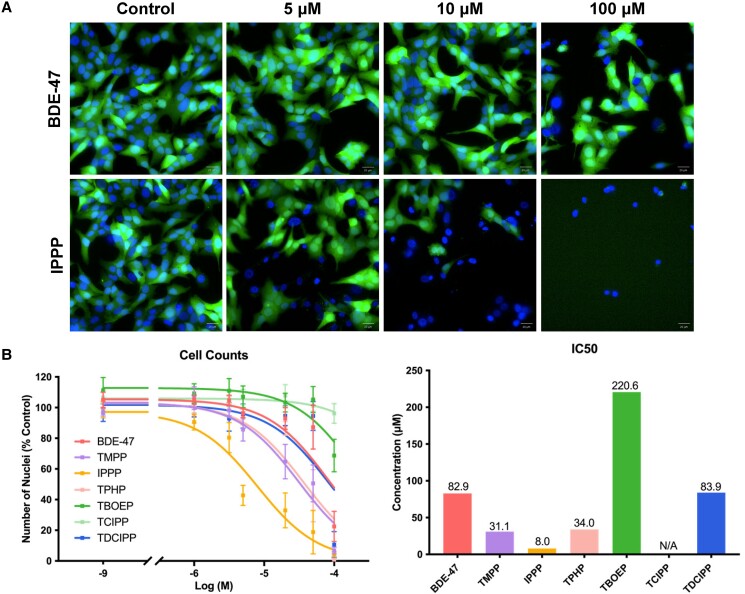
Calcein-positive Hoechst-stained nuclei were assessed as an indicator of cytotoxicity (Fig. 2A). IC50 values, ie, the concentrations that induced a 50% reduction in cell counts, were calculated to compare the cytotoxicity among the test chemicals (Fig. 2B). BDE-47 (IC50: 82.9 μM) served as a reference legacy flame retardant. IPPP was the most cytotoxic OPE tested (IC50: 8.0 μM); cytotoxicity was observed at 5 μM and very few live cells were observed at 100 μM (Fig. 2A; Fig. S1 (44)). TMPP, IPPP, and TPHP also demonstrated higher cytotoxicity than BDE-47. The cytotoxicity of TDCIPP (IC50: 83.9 μM) was similar to that of BDE-47. TBOEP (IC50: 220.6 μM) only demonstrated cytotoxicity at the maximum concentration tested (100 μM) and tris(1-chloro-2-propyl) phosphate (TCIPP) did not demonstrate any cytotoxicity (Fig. S1 (44)). Notably, the OPEs that displayed higher cytotoxicity (TMPP, IPPP, and TPHP) than BDE-47 belonged to the triaryl-OPE group, sharing structural similarities characterized by the presence of 3 phenyl rings. Chemical concentrations that induced more than 30% cytotoxicity were excluded from the assessment of phenotypic endpoints.
Figure 2.
Effects of 2,2′,4,4′-tetrabromodiphenyl ether (BDE-47) and organophosphate esters (OPEs) on cell viability. Cells were exposed to 1 of the chemicals for 48 hours, followed by staining with Hoechst 33342 (blue, nuclei) and Calcein-AM (green, viable cells) fluorescent dyes. The numbers of viable cells were visualized and quantified with the Operetta High Content Imaging System (40× magnification). (A) Representative images of cells exposed to BDE-47 or IPPP at concentrations of 5 μM, 10 μM or 100 μM. (B) Nonlinear regression analyses were conducted to estimate the IC50 values of the test chemicals. Data are shown as percentages relative to controls; values represent means ± SEM; n = 6. Abbreviation: N/A, not available/applicable.
Effect of OPEs on the Phenotypic Characteristics of H295R Cells
Reactive oxygen species
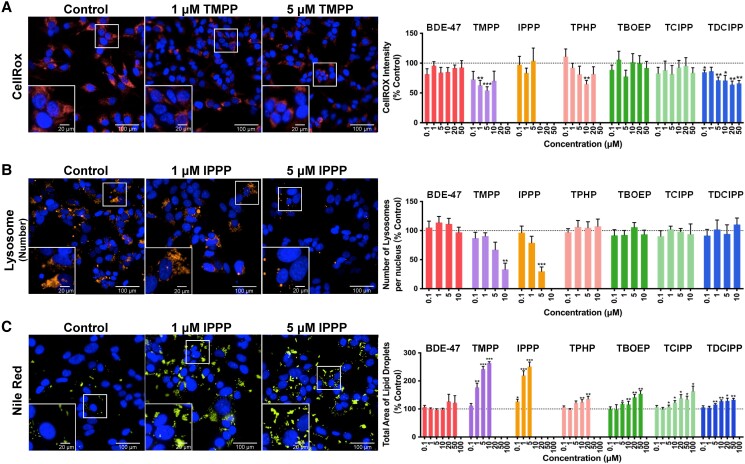
CellROX staining intensity was assessed as an indicator of the production of reactive oxygen species. TMPP, TPHP, and TDCIPP all significantly decreased the level of CellROX staining (Fig. 3A). TMPP reduced CellROX staining to nearly 50% at 1 μM and 5 μM. Exposure to TPHP decreased CellROX staining only at 1 concentration, 10 μM, whereas a wide variety of TDCIPP concentrations, starting as low as 0.1 μM, decreased CellROX staining.
Figure 3.
Effects of 2,2′,4,4′-tetrabromodiphenyl ether (BDE-47) and organophosphate esters (OPEs) on the phenotypic characteristics of H295R cells. Cells were stained with (A) Hoechst 33342 (blue, nuclei) and CellROX (red, an indicator of oxidative stress); (B) Hoechst 33342 (blue, nuclei) and Lysotracker Red (orange, lysosome numbers); (C) Hoechst 33342 (blue, nuclei) and Nile Red (yellow, lipid droplets) fluorescent dyes and were visualized with the Operetta high content imaging system (40× magnification). Data are shown as percentages relative to controls; values represent means ± SEM; n = 6. *P < .05, **P < .01, and ***P < .001 compared to control. Concentrations that induced > 30% cytotoxicity were excluded from the analyses and were not shown.
Mitochondria
The effects of OPEs on mitochondria were assessed using 2 fluorescent dyes. Mitotracker Green accumulates in the mitochondrial matrix regardless of the membrane potential and was used to assess total numbers of mitochondria; Mitotracker Red accumulates only in active mitochondria (47). Exposure to TMPP (1 or 5 μM), IPPP (5 μM), or TPHP (0.1 to 20 μM) induced minor increases (approximately 5-10%) in mitochondrial green intensity (Fig. S2A (44)). The numbers of active mitochondria (Mitotracker red staining) were not affected by any of the chemicals tested (data not shown).
Lysosomes
Lysotracker Red, a dye that consists of a fluorophore linked to a weak base, becomes fluorescent once it is protonated and accumulates in an acidic environment. The intensity of this staining reflects the pH of lysosomes and thus can be used as an indicator of lysosome function (47, 48). Two parameters, lysosome numbers and lysosomal intensity, were assessed using this dye. Exposure to TMPP (10 μM) or IPPP (5 μM) decreased the numbers of lysosomes to 70% of control (Fig. 3B). Lysosome intensity was also decreased by BDE-47 and some OPEs (Fig. S2B (44)). At 50 μM, BDE-47 and TBOEP induced an approximately 30% decrease in Lysotracker Red intensity; exposure to lower concentrations of TMPP (5 or 10 μM) or IPPP (5 μM) also induced a decrease (∼10%) in lysosome intensity.
Lipid droplets
Nile Red, a dye that becomes fluorescent in a hydrophobic (lipid-rich) environment, was used to stain lipid droplets. Lipid droplets were not affected by exposure to BDE-47. However, exposure to all 6 OPEs increased the total area of lipid droplets in a concentration-dependent manner (Fig. 3C). Exposure to TMPP (1-10 μM) or IPPP (0.1-5 μM) induced an up to 3-fold increase, whereas exposure to TPHP (10 or 20 μM), TBOEP (5-50 μM), TCIPP (5 to 100 μM), or TDCIPP (5 to 50 μM) induced a 1.2- to 1.5-fold increase in the area of lipid droplets.
Potency Ranking of OPEs
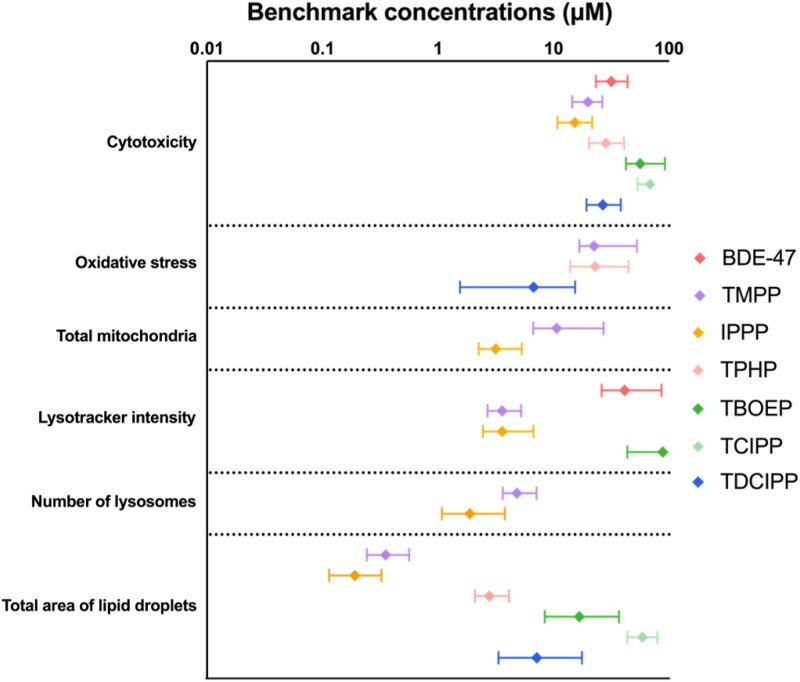
Benchmark concentration analyses were done to calculate the concentrations of test chemicals that induced a 10% change from control (ie, the BMC10 values) (Fig. 4). For each endpoint, BMC10 values were determined only for chemicals that induced a significant change and passed the exclusion criteria. For cytotoxicity, the ranking of chemicals based on their BMC10 values was very similar to that based on their IC50 values: IPPP was the most potent OPE, and the triaryl-OPEs were more cytotoxic than BDE-47 or the nontriaryl-OPEs (Fig. 4).
Figure 4.
Benchmark concentration (BMC, μM) values of the test chemicals for all phenotypic endpoints. Data points represent BMC10 values (concentrations that induced a 10% change from control). Error bars represent means ± upper and lower limits; n = 6. For each endpoint, chemicals that are not shown on the graph either had no effect on that endpoint or failed to generate a significant benchmark model.
The BMC10 values for phenotypic endpoints were usually equivalent to or lower than the BMC10 values associated with the induction of cytotoxicity. In comparison with BDE-47, OPEs affected more endpoints and their BMC10 values were 1 to 2 orders of magnitude lower. TDCIPP had the lowest BMC10 for oxidative stress (6.7 μM). The BMC values for this endpoint for TMPP (BMC10: 22.4 μM) and TPHP (BMC10: 22.9 μM) were essentially the same. It was possible to calculate a BMC value for TMPP (BMC10: 10.6 μM) and IPPP (BMC10: 3.2 μM), but not for TPHP (poor model fit) for effects on the numbers of mitochondria. The BMC values for lysosomal intensity for TMPP (BMC10: 3.6 μM) and IPPP (BMC10: 3.6 μM) were considerably lower than those for BDE-47 (BMC10: 41.3 μM) or TBOEP (BMC10: 88.3 μM). The numbers of lysosomes were also affected by exposure to TMPP (BMC10: 4.8 μM) and IPPP (BMC10: 1.9 μM) at comparable BMC levels. The BMC values for a 10% increase in lipid droplets ranged between 0.2 μM (IPPP) and 58.7 μM (TCIPP), with IPPP being the most potent for this endpoint. The rank order of chemicals based on the lowest observed BMC10 value, regardless of the endpoint, was IPPP > TMPP > TPHP > TDCIPP > TBOEP > BDE-47 > TCIPP.
ToxPi analyses
ToxPi analyses provide a strategy to rank chemicals based on their overall bioactivities; higher ToxPi scores indicate greater potency or toxicity. The ToxPi scores generated for each chemical, taking into consideration all the endpoints tested, are provided in Fig. 5. Based on these ToxPi scores, the rank order of chemicals was IPPP > TMPP > TPHP > TDCIPP > BDE-47 > TBOEP > TCIPP.
Figure 5.
Toxicological Prioritization Index (ToxPi) analyses for chemical ranking. ToxPi profiles for each chemical and their ToxPi scores are displayed in the box. Eight endpoints were analyzed; endpoints were weighted equally. Different symbols were used to differentiate between chemicals with different structural characteristics: triaryl-OPE (circle), nontriaryl-OPE (square), BDE-47 (triangle). Ranking of chemicals was based on their overall bioactivities: chemicals with the highest ToxPi scores were considered the most potent and were ranked accordingly.
Administered equivalent dose analyses
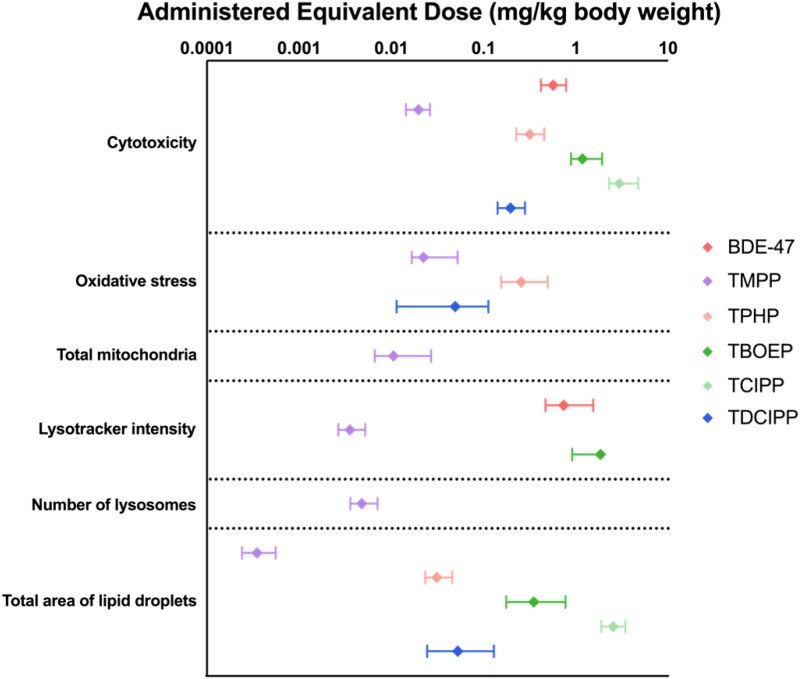
In vitro to in vivo modeling was done to relate the concentrations that induced an effect on in vitro to in vivo exposure doses (ie, the AED) (Fig. 6). The AED for IPPP was not calculated since this chemical had a high LogKow (octanol/water partition coefficient) value. BDE-47 was predicted to affect cell phenotypes at doses that ranged between 0.5 and 0.7 mg/kg body weight/day. In contrast, OPEs were predicted to affect these endpoints at doses as low as 0.0003 mg/kg body weight/day. The overall rank order of chemicals based on the lowest observed AED, regardless of the endpoint, was TMPP > TPHP > TBOEP > TDCIPP > BDE-47 > TCIPP. Aside from TBOEP, the overall ranking was very similar to the rank order determined by the lowest observed BMC10 value approach.
Figure 6.
Administered equivalent dose (AED, mg/kg body weight) values of the test chemical for all phenotypic endpoints. Data are shown as means ± upper and lower limits; n = 6. The AED values for IPPP were not calculated due to its high octanol/water partition coefficient (LogKow) and clearance values.
Using 3 different ranking strategies, the triaryl-OPEs (TMPP, IPPP, and TPHP) were consistently ranked higher, suggesting that they are more potent than BDE-47 and the nontriaryl-OPEs. Thus, in the following assessment of the functional effect of OPEs, we selected the triaryl-OPEs to determine their effect on the steroidogenic function of H295R cells.
Effect of OPEs on the Steroidogenic Function of H295R Cells
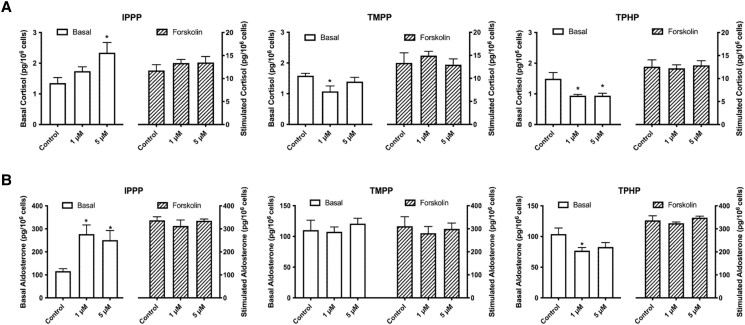
In order to evaluate the potential impact of OPEs on the steroidogenic capacity of H295R cells, we measured the levels of 2 key adrenal hormones, cortisol and aldosterone. The average basal level of cortisol produced by the cells was 1.5 pg/106 cells (Fig. 7A). The presence of a steroidogenic stimulus, forskolin, increased the level of cortisol produced by the cells by approximately 9 times. A 48 hours exposure to 5 μM IPPP doubled the amount of cortisol produced by the cells. However, exposure to either TMPP or TPHP decreased the concentration of cortisol by approximately 40%.
Figure 7.
Effects of IPPP, TMPP, and TPHP on the steroid-producing functions of H295R cells. Cells were exposed to 1 of the chemicals at 1 μM or 5 μM for 48 hours. A concentration of 10 μM forskolin was used for the stimulated condition. Numbers of cells were quantified by Hoechst 33342 staining and high content imaging (10× magnification). Bar graphs show basal (left Y axis, white bars) and stimulated (right Y axis, striped bars) production of cortisol A) and aldosterone B) levels. *P < .05 compared with control; values represent means ± SEM; n = 5.
The baseline level of aldosterone produced by the cells was 100 pg/106 cells (Fig. 7B); stimulation with forskolin increased this level by 3 times. Similar to the effect observed on cortisol production, exposure to IPPP (1 or 5 μM) induced an approximately 2.5-fold increase in the amount of aldosterone produced by the cells. TMPP had no effect on aldosterone production, whereas TPHP (1 μM) decreased the production of aldosterone by 26%. The production of cortisol or aldosterone in response to stimulation was not affected by any of the OPEs tested.
Effects of OPEs on the Expression of key Transcripts Involved in Steroidogenesis
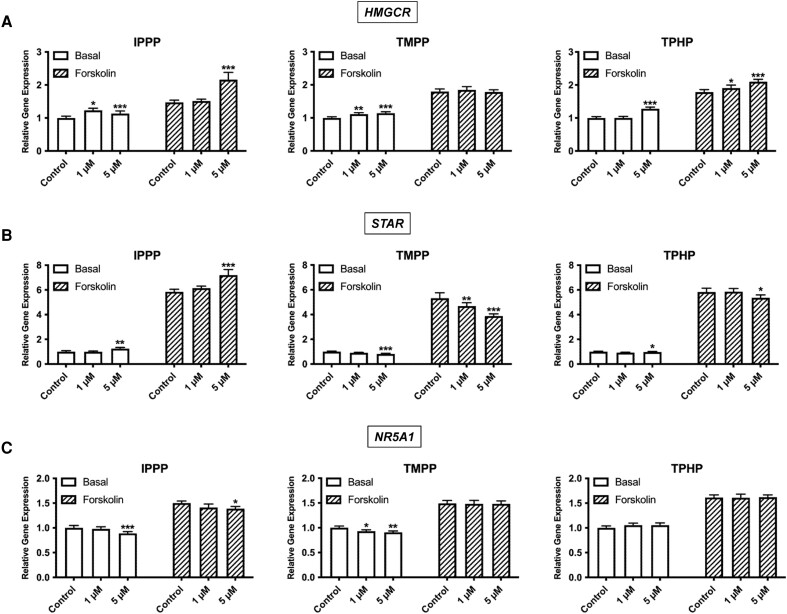
We investigated the effects of OPEs on the expression of key transcripts involved in steroidogenesis under basal and stimulated conditions to determine whether the steroid-producing function of H295R cells was affected at this level. First, we assessed the expression of transcripts involved in the biosynthesis and transport of cholesterol, the precursor of all steroid hormones. The basal expression of HMGCR, the rate-limiting enzyme in cholesterol biosynthesis, was slightly upregulated by all 3 OPEs (Fig. 8A). With forskolin stimulation, IPPP and TPHP induced an approximately 2-fold increase in HMGCR transcripts. The expression of STAR, a key protein involved in transporting cholesterol from the outer to inner mitochondria layer, closely correlated with the chemical-specific effects observed at the hormone level (Fig. 8B). STAR expression was upregulated by IPPP but downregulated by TMPP and TPHP under both basal and stimulated conditions. NR5A1, an upstream regulator of the pathway, was affected only by IPPP and TMPP exposures (Fig. 8C). IPPP (5 μM) induced a slight decrease in NR5A1 expression under both basal and stimulated conditions. TMPP (both 1 and 5 μM) induced a decrease only under basal conditions.
Figure 8.
Effects of IPPP, TMPP, and TPHP on the mRNA expression levels of the rate-limiting enzymes in cholesterol biosynthesis. (A) HMGCR, a rate-limiting enzyme in cholesterol synthesis; (B) STAR, a cholesterol transporter; and (C) NR5A1, an upstream regulator, in H295R cells under basal and stimulated conditions. Cells were exposed to 1 of the chemicals at 1 μM or 5 μM for 48 hours. For the stimulated condition, a concentration of 10 μM forskolin was used. Data represent means ± 95% CI, n = 5. *P < .01, **P < .001, ***P < .0001 compared with control.
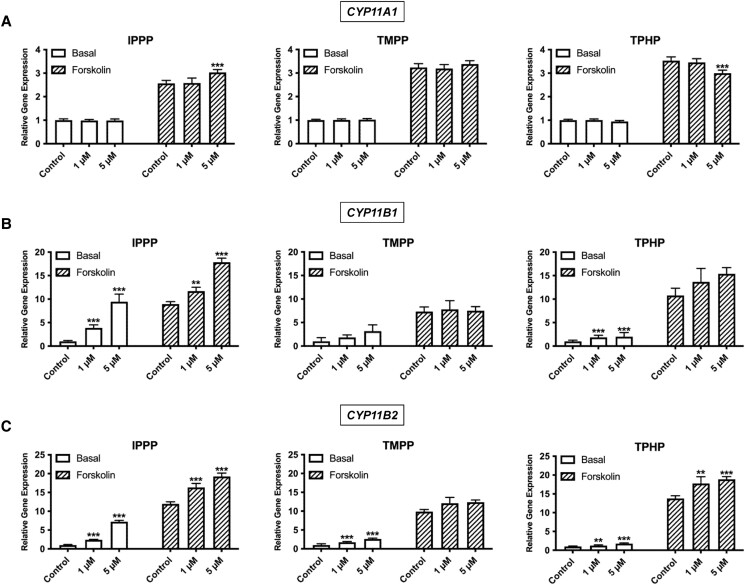
We further assessed whether these 3 OPEs directly affect transcripts in the steroidogenic pathway (Fig. 9). CYP11A1, the rate-limiting enzyme in steroid biosynthesis, was affected by exposure to either IPPP or TPHP, but only under stimulated conditions (Fig. 9A). Of note, the change in expression was similar to the effect observed on hormone levels. IPPP induced an increase in the expression of CYP11A1, whereas a decrease was observed after exposure to TPHP. We then assessed effects on the expression of CYP11B1 and CYP11B2, the key enzymes responsible for the last step in cortisol and aldosterone synthesis, respectively. IPPP induced a concentration dependent increase in basal and stimulated CYP11B1 expression (Fig. 9B). Notably, the increase under basal conditions was nearly 7-fold, in the range of the increase induced by forskolin stimulation. TMPP showed a trend toward an increase in the basal expression of CYP11B1 (P = .05). TPHP induced an approximately 2-fold increase in basal CYP11B1 expression; no effect was observed after stimulation. The largest increase in CYP11B2 expression was observed after exposure to IPPP (Fig. 9C); this concentration dependent increase was observed under both basal and stimulated conditions. Under basal conditions, there was a nearly 8-fold increase in CYP11B2 expression in cells exposed to 5 μM IPPP. In the stimulated cells, the same IPPP concentration induced a ∼2-fold increase. Exposure to TMPP led to a 3-fold increase in CYP11B2 expression under basal conditions. TPHP exposure led to a 2-fold increase in CYP11B2 expression under basal conditions and a 1.4-fold increase in stimulated cells.
Figure 9.
Effects of IPPP, TMPP, and TPHP on the mRNA expression of key steroidogenic enzymes. (A) CYP11A1; (B) CYP11B1; (C) CYP11B2 in H295R cells under basal and stimulated conditions. Cells were exposed to 1 of the chemicals at 1 μM or 5 μM for 48 hours. For the stimulated condition, a concentration of 10 μM forskolin was used. Data represent means ± 95% CI, n = 5. *P < .01, **P < .001, ***P < .0001 compared with control.
Discussion
In this study we demonstrated that OPEs affect H295R adrenal cell phenotypic parameters to a greater extent than BDE-47, a legacy brominated flame retardant. OPE exposures induced chemical-specific effects on adrenal cell steroidogenesis and, at the transcriptional level, on rate-limiting enzymes involved in cholesterol and steroid biosynthesis. To our knowledge, this is the first study to systematically compare the effects of OPEs on adrenal cell phenotypic characteristics and functional endpoints.
Few previous studies have tested the effects of OPEs on adrenal cells. Liu et al (37) reported a 20% decrease in cell viability after the exposure of H295R cells to 30.7 μM of TPHP or 56.1 μM of TMPP. TMPP and TPHP were also among the more cytotoxic OPEs in another study with H295R cells in which they affected cell viability at concentrations an order of magnitude lower than those of TBOEP, TCIPP, or TDCIPP (39). This is also consistent with studies in other steroidogenic cells, such as the MA-10 Leydig cells, in which similar IC50 values (range between 10.3 and 27.5 μM, with IPPP being the most cytotoxic) were reported and all of the OPEs tested were more cytotoxic than BDE-47 (25). Furthermore, a structure-related effect was observed in KGN ovarian granulosa cells, where the triaryl-OPEs demonstrated higher potency in affecting steroid-producing activities than TBOEP (49). Interestingly, an association between the structures of the chemicals and their toxicity was also observed in KGN ovarian granulosa cells (27), in A549 lung epithelial cells (50), in HepG2 liver cells (51), and in CHO-K1 ovary cells (52); these data suggest that the cytotoxicity of OPEs may be related to their lipophilicity (Table S2 (44)).
The adrenal cell phenotypic parameters that were affected by OPEs include measures of reactive oxygen species, the numbers of mitochondria, lysosome numbers and their activity, and lipid droplet areas. These endpoints are key for the maintenance of normal cell functions. Oxidative stress levels were decreased in H295R cells after OPE exposures (Fig. 3A). Indeed, the adrenal gland is well supplied with antioxidants that help to maintain redox homeostasis during steroidogenesis; these include enzymes such as glutathione peroxidases and superoxide dismutase (53). Interestingly, in silver carp larvae, TDCIPP, 1 of the OPEs that reduced oxidative stress levels in H295R cells, increased superoxide dismutase activity but decreased glutathione peroxidase (54). Further studies are required to assess the mechanisms by which some OPEs may decrease oxidative stress in adrenal cells. Mitochondria, the major site for the production of reactive oxygen species in cells, were also affected by some OPEs in H295R cells. Exposure to the 3 triaryl-OPEs induced a slight increase in the total number of mitochondria (Fig. S2A (44)). A similar finding has been observed previously; in AML-12 liver cells, exposure to TPHP, TMPP, or TDCIPP increased the total area of mitochondria, reduced mitochondria network number, and depleted mitochondria membrane potentials (55).
In steroidogenic cells, lysosomes participate in the process of both the uptake of cholesterol from the circulation and the breakdown of lipid droplets to free the stored cholesterol which is the precursor for steroid hormone synthesis (56). A decrease in the number of lysosomes and potential disruption of lysosome function suggest that lipid homeostasis may be affected. Indeed, up to a 3-fold increase in the total area of lipid droplets was observed after OPE exposure (Fig. 3C). This is consistent with findings in KGN ovarian cells (27) and with the accumulation of lipids observed in in vivo experiments with mice or rats (31-35). In these animal studies, the accumulation of lipids in the adrenal gland was observed consistently in the cells of the zona glomerulosa and zona fasciculata. Those regions are actively involved in the biotransformation of cholesterol into cortisol (or corticosterone in mice or rats) and aldosterone. Moreover, Latendresse et al (32) reported that TMPP could inhibit the activity of neutral cholesterol ester hydrolase, an enzyme that catalyzes the conversion of stored cholesterol ester to free cholesterol. This action may lead to the buildup of cholesterol esters in the form of lipid droplets in the adrenal gland.
We next undertook potency ranking analyses based on the phenotypic assessment data demonstrating that OPEs have differential effects on specific endpoints. The lowest BMC approach enabled the identification of chemicals that induced toxic effects on these endpoints at low concentrations. ToxPi analyses take into consideration the effects induced on all endpoints and provide an overall ranking of the chemicals. Both potency ranking approaches ranked the triaryl-OPEs as more potent than the non-triaryl chemicals. Our AED analyses predicted that the bioactive doses of OPEs range from 0.0003-2.96 mg/kg/day; importantly, these doses are much lower than those used in previous in vivo studies assessing the adrenal toxicity of OPEs, where the range was from 5 to 1700 mg/kg/day (31-36).
The 3 triaryl-OPEs with the highest potencies on phenotypic endpoints, IPPP, TMPP, and TPHP, were selected to assess their impact on steroidogenesis in H295R cells. These OPEs showed chemical specific effects on the production of cortisol and aldosterone in the absence of forskolin stimulation. IPPP increased the secretion of cortisol whereas TMPP and TPHP decreased cortisol levels. Similarly, the aldosterone level was increased by IPPP, but decreased with TPHP exposures. Limited information is available in the literature on the effect of OPEs on cortisol and aldosterone levels. In a previous study with H295R cells, Zhang et al (39) reported that TMPP (5 μM) downregulated cortisol levels but had no effect on aldosterone; however, TPHP (5 μM) increased the production of both cortisol and aldosterone. The effect of IPPP was not investigated and forskolin stimulation was not included in this study. In a human study (57), increased urinary OPE diester concentrations were associated with a 18% to 41% increase in cortisol concentration in blood samples. Here, the OPE diesters included diphenyl phosphate (DPHP, a metabolite of IPPP and TPHP), bis(1-chloro-2 propyl) phosphate (BCIPP, a metabolite of TDCIPP), and bis(2-butoxylethyl) phosphate (BBOEP, a metabolite of TBOEP).
To identify the mechanism(s) responsible for the effects of OPEs on cortisol and aldosterone production, we examined the effects of the 3 triaryl-OPEs at the transcriptional level. The expression level of HMGCR, the rate-limiting enzyme in cholesterol biosynthesis, was upregulated by all 3 OPEs (Fig. 8A). In steroidogenic cells cholesterol is mainly stored as cholesterol esters in lipid droplets so an increase in the production of cholesterol may contribute to the increase in lipid droplets that we observed. STAR, which is involved in translocating cholesterol from the outer to inner mitochondrial membrane, may also play a role in regulating the adrenal production of hormones (58). We observed OPE chemical–specific effects on the expression of STAR under both basal and stimulated conditions (Fig. 8B). Previously, Zhang et al (39) reported that TMPP increased HMGCR expression in H295R cells whereas exposure to TPHP decreased STAR expression. Next, we assessed the effects of OPE exposure on the expression of NR5A1, a key regulator of steroidogenesis in the adrenal, since SF-1, the product of this gene, has an essential role in regulating the expression of a number of steroidogenic genes, including CYP11B1 (59). The expression of NR5A1 was downregulated by both IPPP and TPHP, but the effect was small (Fig. 8C).
Exposure to IPPP or TPHP also impacted on the expression of the cytochromes P450 that catalyze critical steps in the biosynthesis of cortisol and aldosterone (CYP11A1, CYP11B1 and CYP11B2) (Fig. 9). The expression of CYP11B1 and CYP11B2, the transcripts that encode the final enzymes required for cortisol and aldosterone biosynthesis, was upregulated by all 3 triaryl-OPEs. It is also possible that OPEs affect the expression or activity of steroid hydroxylases by targeting other pathways. For instance, the ACTH receptor and the angiotensin II receptor regulate the production of cortisol and aldosterone (60, 61); it remains to be elucidated whether OPEs affect the function of those 2 receptors. Moreover, the expression of CYP11B2 is suppressed by the PPARγ receptor (62), which is a known target of TPHP (63). An upregulation of the level of CYP11B2 was also reported by Liu et al (37) in H295R adrenal cells. In another study that assessed the effect of 9 OPEs on the steroidogenic pathway in H295R cells, TPHP and TMPP downregulated the expression of CYP11B1 after a 24 hours of exposure; CYP11B2 was not affected (39). This suggests that OPEs may induce different changes on the transcript levels of these genes at an earlier time point. Note that this study used a different cell culture medium and the cells were starved for 24 hours before chemical treatment. These variations in experimental conditions may have contributed to the observed differences in downstream effects.
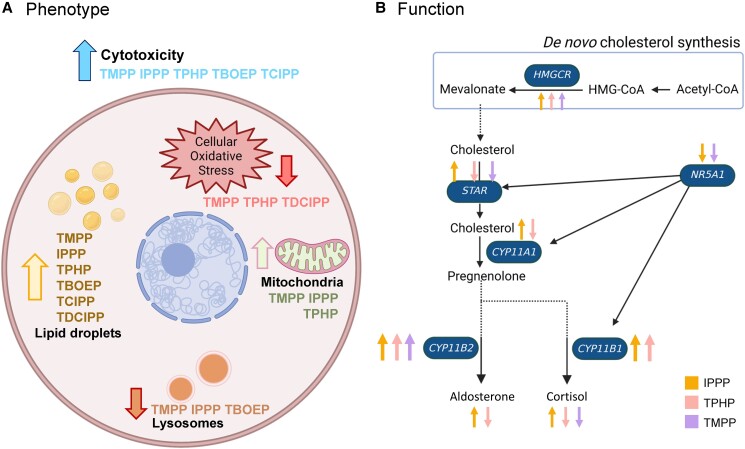
The H295R steroidogenesis assay has been incorporated into the Tier 1 Screening Battery of the United States Environmental Protection Agency Endocrine Disruptor Screening Program (64). Our study expanded upon the H295R steroidogenesis assay and established a link between the impact of OPEs on steroidogenesis and the enzymatic activities of steroidogenic genes, along with the structural alterations observed in H295R cells. This connection provides valuable insights into the structure–function relationships underlying the action of OPEs. The possible targets of OPEs in the H295R human adrenal cells are presented schematically in Fig. 10. Our findings demonstrate that OPEs affect the adrenal gland at both the structural and functional levels, leading to disruptions in the production of cortisol and aldosterone. Abnormal adrenal steroid production is associated with various diseases, including hypertension and metabolic syndrome, such as Addison disease (adrenal steroid insufficiency) and primary aldosteronism (excess mineralocorticoid production). Consequently, our data provide compelling evidence for the endocrine-disrupting properties of OPEs and highlight the adrenal gland as an important target of OPE-induced effects.
Figure 10.
Summary of the (A) phenotypic and (B) functional effects of OPEs on H295R human adrenal cells. (A) Exposure to most OPEs increased cytotoxicity, reduced oxidative stress levels, increased the numbers of mitochondria, decreased lysosome numbers and lysosomal intensity, and increased the area of lipid droplets. (B) The 3 triaryl-OPEs targeted the steroidogenic pathway by affecting the expression of key enzymes involved in the rate-limiting steps in cholesterol and steroid biosynthesis, resulting in alterations in the levels of cortisol and aldosterone. A larger arrow suggests a greater effect size, indicating a more pronounced impact of OPEs on the endpoints. IPPP, yellow arrow; TPHP, pink arrow; TMPP, purple arrow. Created with BioRender.com.
Acknowledgments
We thank Dr. Nicole Kleinstreuer (NICEATM) and Dr. Michael G. Wade (Health Canada) for providing test chemicals. We thank Dr. Nicolas Audet for his technical support in the use of the Operetta and the Columbus systems. We also acknowledge the assistance of Dr. Marc Beal in the derivation of Css values. Image acquisition and analysis was performed with the McGill University Imaging and Molecular Biology Platform (IMBP) equipment and services.
Abbreviations
- AED
administered equivalent dose
- BDE-47
2,2′,4,4′-tetrabromodiphenyl ether
- BMC
benchmark concentration
- Css
steady-state concentration
- CYP P450
cytochrome P450
- IPPP
isopropylated triphenyl phosphate
- OPE
organophosphate ester
- PBDE
polybrominated diphenyl ether
- qRT-PCR
quantitative real-time polymerase chain reaction
- TBOEP
tris(2-butoxyethyl) phosphate
- TCIPP
tris(1-chloro-2-propyl) phosphate
- TDCIPP
tris(1,3-dichloro-2-propyl) phosphate
- TMPP
tris(methylphenyl) phosphate
- ToxPi
Toxicological Priority Index
- TPHP
triphenyl phosphate
Contributor Information
Zixuan Li, Department of Pharmacology & Therapeutics, McGill University, Montreal, QC, H3G 1Y6, Canada.
Bernard Robaire, Department of Pharmacology & Therapeutics, McGill University, Montreal, QC, H3G 1Y6, Canada; Department of Obstetrics & Gynecology, McGill University, Montreal, QC, H3G 1Y6, Canada.
Barbara F Hales, Department of Pharmacology & Therapeutics, McGill University, Montreal, QC, H3G 1Y6, Canada.
Funding
Canadian Institutes of Health Research (CIHR) Institute for Population and Public Health team Grant (FRN IP3-150711), Canadian Institutes of Health Research (CIHR) Project Grant FRN 156239, and McGill University. Z.L. is the recipient of training awards from McGill University and the Centre for Research in Reproduction and Development (CRRD). B.F.H. and B.R. are James McGill Professors.
Author Contributions
Z.L., B.F.H., and B.R. were responsible for the experimental design, data interpretation, and manuscript preparation. Z.L. was responsible for data acquisition and analyses. All authors approved the final version of the article.
Disclosures
The authors declare no potential conflicts of interest with respect to the research, authorship, and/or publication of this article.
Data Availability
All data are available upon request. Supplementary data are included in the data repositories listed in the References.
References
- 1. Sharkey M, Harrad S, Abdallah MAE, Drage DS, Berresheim H. Phasing-out of legacy brominated flame retardants: the UNEP Stockholm convention and other legislative action worldwide. Environ Int. 2020;144:106041. [DOI] [PubMed] [Google Scholar]
- 2. Stapleton HM, Sharma S, Getzinger G, et al. Novel and high volume use flame retardants in US couches reflective of the 2005 PentaBDE phase out. Environ Sci Technol. 2012;46(24):13432‐13439. [DOI] [PMC free article] [PubMed] [Google Scholar]
- 3. van der Veen I, de Boer J. Phosphorus flame retardants: properties, production, environmental occurrence, toxicity and analysis. Chemosphere. 2012;88(10):1119‐1153. [DOI] [PubMed] [Google Scholar]
- 4. Hou R, Xu Y, Wang Z. Review of OPFRs in animals and humans: absorption, bioaccumulation, metabolism, and internal exposure research. Chemosphere. 2016;153:78‐90. [DOI] [PubMed] [Google Scholar]
- 5. Greaves AK, Letcher RJ. A review of organophosphate esters in the environment from biological effects to distribution and fate. B Environ Contam Tox. 2017;98(1):2‐7. [DOI] [PubMed] [Google Scholar]
- 6. Struzina L, Castro MAP, Kubwabo C, et al. Occurrence of legacy and replacement plasticizers, bisphenols, and flame retardants in potable water in Montreal and South Africa. Sci Total Environ. 2022;840:156581. [DOI] [PubMed] [Google Scholar]
- 7. Stapleton HM, Misenheimer J, Hoffman K, Webster TF. Flame retardant associations between children's Handwipes and house dust. Chemosphere. 2014;116:54‐60. [DOI] [PMC free article] [PubMed] [Google Scholar]
- 8. He C, Wang X, Thai P, et al. Organophosphate and brominated flame retardants in Australian indoor environments: levels, sources, and preliminary assessment of human exposure. Environ Pollut. 2018;235:670‐679. [DOI] [PubMed] [Google Scholar]
- 9. Dirtu AC, Ali N, den Eede NV, Neels H, Covaci A. Country specific comparison for profile of chlorinated, brominated and phosphate organic contaminants in indoor dust, case study for eastern Romania, 2010. Environ Int. 2012;49:1‐8. [DOI] [PubMed] [Google Scholar]
- 10. Blum A, Behl M, Birnbaum LS, et al. Organophosphate ester flame retardants: are they a regrettable substitution for polybrominated diphenyl ethers? Environ Sci Tech Let. 2019;6(11):638‐649. [DOI] [PMC free article] [PubMed] [Google Scholar]
- 11. Percy Z, Guardia MJL, Xu Y, et al. Concentrations and loadings of organophosphate and replacement brominated flame retardants in house dust from the home study during the PBDE phase-out. Chemosphere. 2020;239:124701. [DOI] [PMC free article] [PubMed] [Google Scholar]
- 12. Liu LY, Salamova A, He K, Hites RA. Analysis of polybrominated diphenyl ethers and emerging halogenated and organophosphate flame retardants in human hair and nails. J Chromatogr A. 2015;1406:251‐257. [DOI] [PubMed] [Google Scholar]
- 13. Liu LY, He K, Hites RA, Salamova A. Hair and nails as noninvasive biomarkers of human exposure to brominated and organophosphate flame retardants. Environ Sci Technol. 2016;50(6):3065‐3073. [DOI] [PubMed] [Google Scholar]
- 14. Health Canada . Summary of flame retardant assessments and management conducted under the Canadian Environmental Protection Act, 1999. Updated February 22, 2022. Accessed March 27, 2023. https://www.canada.ca/en/environment-climate-change/services/evaluating-existing-substances/summary-flame-retardant-assessments-management-conducted-cepa.html
- 15. United States Environmental Protection Agency (U.S. EPA) . Health and Safety Data Reporting: Addition of 20 High-Priority Substances and 30 Organohalogen Flame Retardants. Updated October 11, 2022. Accessed March 23, 2023. https://www.epa.gov/chemicals-under-tsca/health-and-safety-data-reporting-addition-20-high-priority-substances-and-30
- 16. European chemical agency (ECHA) . Regulatory strategy for flame retardants. Published March 2023. Accessed April 9, 2023. https://echa.europa.eu/documents/10162/2082415/flame_retardants_strategy_en.pdf/9dd56b7e-4b62-e31b-712f-16cc51d0e724? t=1679045593845
- 17. Kojima H, Takeuchi S, Itoh T, Iida M, Kobayashi S, Yoshida T. In vitro endocrine disruption potential of organophosphate flame retardants via human nuclear receptors. Toxicology. 2013;314(1):76‐83. [DOI] [PubMed] [Google Scholar]
- 18. Castorina R, Bradman A, Stapleton HM, et al. Current-use flame retardants: maternal exposure and neurodevelopment in children of the CHAMACOS cohort. Chemosphere. 2017;189:574‐580. [DOI] [PMC free article] [PubMed] [Google Scholar]
- 19. Lipscomb ST, McClelland MM, MacDonald M, Cardenas A, Anderson KA, Kile ML. Cross-sectional study of social behaviors in preschool children and exposure to flame retardants. Environ Health. 2017;16(1):23. [DOI] [PMC free article] [PubMed] [Google Scholar]
- 20. Pei Y, Peng J, Behl M, et al. Comparative neurotoxicity screening in human iPSC-derived neural stem cells, neurons and astrocytes. Brain Res. 2016;1638(Pt A):57‐73. [DOI] [PMC free article] [PubMed] [Google Scholar]
- 21. Fernie KJ, Palace V, Peters LE, et al. Investigating endocrine and physiological parameters of captive American kestrels exposed by diet to selected organophosphate flame retardants. Environ Sci Technol. 2015;49(12):7448‐7455. [DOI] [PubMed] [Google Scholar]
- 22. Meeker JD, Stapleton HM. House dust concentrations of organophosphate flame retardants in relation to hormone levels and semen quality parameters. Environ Health Perspect. 2010;118(3):318‐323. [DOI] [PMC free article] [PubMed] [Google Scholar]
- 23. Siddique S, Farhat I, Kubwabo C, et al. Exposure of men living in the greater Montreal area to organophosphate esters: association with hormonal balance and semen quality. Environ Int. 2022;166:107402. [DOI] [PubMed] [Google Scholar]
- 24. Luo K, Liu J, Wang Y, et al. Associations between organophosphate esters and sex hormones among 6–19-year old children and adolescents in NHANES 2013–2014. Environ Int. 2020;136:105461. [DOI] [PubMed] [Google Scholar]
- 25. Schang G, Robaire B, Hales BF. Organophosphate flame retardants act as endocrine-disrupting chemicals in MA-10 mouse tumor Leydig cells. Toxicol Sci. 2016;150(2):499‐509. [DOI] [PubMed] [Google Scholar]
- 26. Rajkumar A, Luu T, Hales BF, Robaire B. High-content imaging analyses of the effects of bisphenols and organophosphate esters on TM4 mouse Sertoli cells. Biol Reprod. 2022;107(3):858‐868. [DOI] [PMC free article] [PubMed] [Google Scholar]
- 27. Wang X, Luu T, Beal MA, Barton-Maclaren TS, Robaire B, Hales BF. The effects of organophosphate esters used as flame retardants and plasticizers on granulosa, Leydig, and spermatogonial cells analyzed using high-content imaging. Toxicol Sci. 2022;186(2):269‐287. [DOI] [PMC free article] [PubMed] [Google Scholar]
- 28. Hinson JP, Raven PW. Effects of endocrine-disrupting chemicals on adrenal function. Best Pract Res Cl En. 2006;20(1):111‐120. [DOI] [PubMed] [Google Scholar]
- 29. Ribelin WE. The effects of drugs and chemicals upon the structure of the adrenal gland. Fund Appl Toxicol. 1984;4(1):105‐119. [DOI] [PubMed] [Google Scholar]
- 30. Lee S, Martinez–Arguelles D, Campioli E, Papadopoulos V. Fetal exposure to low levels of the plasticizer DEHP predisposes the adult male adrenal gland for endocrine disruption. Endocrinology. 2017;158(2):304‐318. [DOI] [PubMed] [Google Scholar]
- 31. National Toxicology Program . NTP Toxicology and carcinogenesis studies of tricresyl phosphate (CAS No. 1330-78-5) in F344/N rats and B6C3F1 mice (gavage and feed studies). Natl Toxicol Program Tech Rep Ser. 1994;433:1‐321. [PubMed] [Google Scholar]
- 32. Latendresse JR, Azhar S, Brooks CL, Capen CC. Pathogenesis of cholesteryl lipidosis of adrenocortical and ovarian interstitial cells in F344 rats caused by tricresyl phosphate and butylated triphenyl phosphate. Toxicol Appl Pharm. 1993;122(2):281‐289. [DOI] [PubMed] [Google Scholar]
- 33. Latendresse JR, Brooks CL, Capen CC. Pathologic effects of butylated triphenyl phosphate-based hydraulic fluid and tricresyl phosphate on the adrenal gland, ovary, and testis in the Fischer-344 rat. Toxicol Pathol. 1994;22(4):341‐352. [DOI] [PubMed] [Google Scholar]
- 34. Latendresse JR, Brooks CL, Capen CC. Toxic effects of butylated triphenyl phosphate-based hydraulic fluid and tricresyl phosphate in female F344 rats. Vet Pathol. 1995;32(4):394‐402. [DOI] [PubMed] [Google Scholar]
- 35. Wade MG, Kawata A, Rigden M, Caldwell D, Holloway AC. Toxicity of flame retardant isopropylated triphenyl phosphate: liver, adrenal, and metabolic effects. Int J Toxicol. 2019;38(4):279‐290. [DOI] [PubMed] [Google Scholar]
- 36. Akimoto T, Kobayashi S, Nakayama A, et al. Toxicological effects of Tris (1,3-dichloro-2-propyl) phosphate exposure in adult male rats differ depending on the history of exposure in the neonatal period. J Appl Toxicol. 2022;42(9):1503‐1509. [DOI] [PubMed] [Google Scholar]
- 37. Liu X, Ji K, Choi K. Endocrine disruption potentials of organophosphate flame retardants and related mechanisms in H295R and MVLN cell lines and in zebrafish. Aquat Toxicol. 2012;114-115:173‐181. [DOI] [PubMed] [Google Scholar]
- 38. Chang Y, Cui H, Jiang X, Li M. Comparative assessment of neurotoxicity impacts induced by alkyl tri-n-butyl phosphate and aromatic tricresyl phosphate in PC12 cells. Environ Toxicol. 2020;35(12):1326‐1333. [DOI] [PubMed] [Google Scholar]
- 39. Zhang Q, Wang J, Zhu J, Liu J, Zhao M. Potential glucocorticoid and mineralocorticoid effects of nine organophosphate flame retardants. Environ Sci Technol. 2017;51(10):5803‐5810. [DOI] [PubMed] [Google Scholar]
- 40. Zhang Q, Yu C, Fu L, Gu S, Wang C. New insights in the endocrine disrupting effects of three primary metabolites of organophosphate flame retardants. Environ Sci Technol. 2020;54(7):4465‐4474. [DOI] [PubMed] [Google Scholar]
- 41. OECD . Test No. 456: H295R Steroidogenesis Assay: OECD Guidelines for the Testing of Chemicals. OECD Publishing. 2022; Section 4.
- 42. Fan X, Kubwabo C, Rasmussen PE, Wu F. Simultaneous determination of thirteen organophosphate esters in settled indoor house dust and a comparison between two sampling techniques. Sci. Total Environ. 2014;491–492:80‐86. [DOI] [PubMed] [Google Scholar]
- 43. Kubwabo C, Fan X, Katuri GP, Habibagahi A, Rasmussen PE. Occurrence of aryl and alkyl-aryl phosphates in Canadian house dust. Emerg Contam. 2021;7:149‐159. [Google Scholar]
- 44. Li Z, Robaire B, Hales BF. Supplementary data for The organophosphate esters used as flame retardants and plasticizers affect H295R adrenal cell phenotypes and functions. Deposited July 24, 2023. 10.6084/m9.figshare.23672913.v1 [DOI] [PMC free article] [PubMed]
- 45. United States Environmental Protection Agency (U.S. EPA) . Benchmark Dose Technical Guidance. Washington, DC 20460: Risk Assessment Forum, U.S. EPA Report EPA/100/R-12/001. Published June 2012. Accessed April 18, 2023. https://www.epa.gov/risk/benchmark-dose-technical-guidance
- 46. Health Canada . Science Approach Document: Bioactivity Exposure Ratio: Application in Priority Setting and Risk Assessment. Published March 2021. Accessed April 18, 2023. https://www.canada.ca/en/environment-climate-change/services/evaluating-existing-substances/science-approach-document-bioactivity-exposure-ratio-application-priority-setting-risk-assessment.html
- 47. Iain DJ. Chapter 12: probes for organelles. In: Molecular Probes Handbook: A Guide to Fluorescent Probes and Labeling Technologies. 11th ed. Life technologies Inc; 2010:495‐543. [Google Scholar]
- 48. Chazotte B. Labeling lysosomes in live cells with LysoTracker. Cold Spring Harb Protoc. 2011;2011(2):pdb.prot5571. [DOI] [PubMed] [Google Scholar]
- 49. Wang X, Lee E, Hales BF, Robaire B. Organophosphate esters disrupt steroidogenesis in KGN human ovarian granulosa cells. Endocrinology. 2023;164(7):bqad089. [DOI] [PMC free article] [PubMed] [Google Scholar]
- 50. Yuan S, Zhu K, Ma M, Zhu X, Rao K, Wang Z. In vitro oxidative stress, mitochondrial impairment and G1 phase cell cycle arrest induced by alkyl-phosphorus-containing flame retardants. Chemosphere. 2020;248:126026. [DOI] [PubMed] [Google Scholar]
- 51. Zhou Y, Liao H, Yin S, Wang P, Ye X, Zhang J. Aryl-, halogenated- and alkyl- organophosphate esters induced oxidative stress, endoplasmic reticulum stress and NLRP3 inflammasome activation in HepG2 cells. Environ Pollut. 2023;316(Pt 1):120559. [DOI] [PubMed] [Google Scholar]
- 52. Huang C, Li N, Yuan S, et al. Aryl- and alkyl-phosphorus-containing flame retardants induced mitochondrial impairment and cell death in Chinese hamster ovary (CHO-k1) cells. Environ Pollut. 2017;230:775‐786. [DOI] [PubMed] [Google Scholar]
- 53. Prasad R, Kowalczyk JC, Meimaridou E, Storr HL, Metherell LA. Oxidative stress and adrenocortical insufficiency. J Endocrinol. 2014;221(3):R63‐R73. [DOI] [PMC free article] [PubMed] [Google Scholar]
- 54. Yang H, Pu Y, Liu C, et al. Environmentally relevant concentrations of tris (1,3-dichloro-2-propyl) phosphate induce growth inhibition and oxidative stress in silver carp (Hypophthalmichthys molitrix) larvae. Ecotox Environ Safe. 2022;241:113798. [DOI] [PubMed] [Google Scholar]
- 55. Le Y, Shen H, Yang Z, Lu D, Wang C. Comprehensive analysis of organophosphorus flame retardant-induced mitochondrial abnormalities: potential role in lipid accumulation. Environ Pollut. 2021;274:116541. [DOI] [PubMed] [Google Scholar]
- 56. Mesmin B, Antonny B, Drin G. Insights into the mechanisms of sterol transport between organelles. Cell Mol Life Sci. 2013;70(18):3405‐3421. [DOI] [PMC free article] [PubMed] [Google Scholar]
- 57. Ji Y, Yao Y, Duan Y, et al. Association between urinary organophosphate flame retardant diesters and steroid hormones: A metabolomic study on type 2 diabetes mellitus cases and controls. Sci Total Environ. 2021;756:143836. [DOI] [PubMed] [Google Scholar]
- 58. Papadopoulos V, Miller WL. Role of mitochondria in steroidogenesis. Best Pract Res Cl En. 2012;26(6):771‐790. [DOI] [PubMed] [Google Scholar]
- 59. Bassett M, Zhang Y, Clyne C, White P, Rainey W. Differential regulation of aldosterone synthase and 11beta-hydroxylase transcription by steroidogenic factor-1. J Mol Endocrinol. 2002;28(2):125‐135. [DOI] [PubMed] [Google Scholar]
- 60. Nogueira EF, Rainey WE. Regulation of aldosterone synthase by activator transcription factor/cAMP response element-binding protein family members. Endocrinology. 2010;151(3):1060‐1070. [DOI] [PMC free article] [PubMed] [Google Scholar]
- 61. Gallo PN, Payet MD. Mechanism of action of ACTH: beyond cAMP. Microsc Res Tech. 2003;61(3):275‐287. [DOI] [PubMed] [Google Scholar]
- 62. Uruno A, Matsuda K, Noguchi N, et al. Peroxisome proliferator-activated receptor-γ suppresses CYP11B2 expression and aldosterone production. J Mol Endocrinol. 2011;46(1):37‐49. [DOI] [PubMed] [Google Scholar]
- 63. Belcher SM, Cookman CJ, Patisaul HB, Stapleton HM. In vitro assessment of human nuclear hormone receptor activity and cytotoxicity of the flame retardant mixture FM 550 and its triarylphosphate and brominated components. Toxicol Lett. 2014;228(2):93‐102. [DOI] [PMC free article] [PubMed] [Google Scholar]
- 64. United States Environmental Protection Agency (U.S. EPA) . Endocrine Disruptor Screening Program (EDSP); Announcing the Availability of the Tier 1 Screening Battery and Related Test Guidelines. Published October 21, 2009. Accessed June 2, 2023. https://www.regulations.gov/document/EPA-HQ-OPPT-2008-0521-0001
Associated Data
This section collects any data citations, data availability statements, or supplementary materials included in this article.
Data Availability Statement
All data are available upon request. Supplementary data are included in the data repositories listed in the References.


