

Summary
In natural “active” vision, humans and other primates use eye movements (saccades) to sample bits of information from visual scenes. In the visual cortex, non-retinal signals linked to saccades shift visual cortical neurons to a high excitability state as each saccade ends. The extent of this saccadic modulation outside of the visual system is unknown. Here, we show that during natural viewing, saccades modulate excitability in numerous auditory cortical areas, with a temporal pattern complementary to that seen in visual areas. Control somatosensory cortical recordings indicate that the temporal pattern is unique to auditory areas. Bi-directional functional connectivity patterns suggest that these effects may arise from regions involved in saccade generation. We propose that by using saccadic signals to yoke excitability states in auditory areas to those in visual areas, the brain can improve information processing in complex natural settings.
eTOC Blurb
Primates sample visual scenes actively with saccadic eye movements. Leszczynski et al. find that saccades not only influence the visual brain but also modulate neural excitability in numerous auditory areas through multiplexed connectivity with regions generating saccades. Modulation patterns are complementary in the auditory and visual areas.
Introduction
Humans and other primates actively sample the visual environment by systematically shifting eye position several times per second1. These rapid “saccadic” eye movements trigger volleys of retinal input that drive neural activity along the visual pathway2–4 from the lateral geniculate nucleus5,6 through several stages of the visual cortex7–9 to the medial temporal lobe and the hippocampus10–12. The effects of saccades in the dark7,13, and those noted in studies that minimize retinal inputs initiated by saccades14,15, support the idea that the gain of retinal input processing in visual areas is modulated by non-retinal signals, generated in parallel to saccades16. Saccadic perturbation of neural excitability by both driving and modulatory inputs occurs rhythmically at the 3–5 Hz saccadic rate – a key physiological signature of active sensing17–19. Saccade-related reset of neuronal oscillations in this “theta” range provides a possible mechanism for modulation of neuronal activity17,18. The Frontal Eye Fields (FEF), involved in preparing and generating saccadic eye movements20, also coordinate top-down attention allocation and modulate neural activity in the visual system through network connectivity21 oscillating in gamma and beta ranges22.
Intriguingly, several studies suggest that the influence of saccades on neural activity extends beyond the visual system. Sensitivity to static eye position has been noted in both subcortical and cortical auditory pathway structures23–25 and dynamic saccadic modulation has been observed in the non-visual nuclei of the anterior thalamus26 as well as in the auditory cortex27. Notably, in both monkeys and humans, the eardrum moves in synchrony with saccades28. However, the extent of saccadic modulation across auditory cortical regions has not been determined, and the brain circuits projecting these effects into auditory areas have not been identified. Here, we combined eye tracking during natural free viewing with simultaneous intracranial recordings from widespread brain regions in surgical epilepsy patients to address these questions.
We have several key findings. First, saccadic modulation of neural excitability is much more widespread than previously recognized, involving both somatosensory and auditory areas. In the auditory selective networks (ASNs; those responding preferentially to auditory stimuli), saccades modulate low frequency phase and power with distinct anatomical and spectrotemporal profiles indicating there are at least two mechanisms operating in synchrony with saccades. Second, we found that Broadband High-frequency Activity, or BHA29, was increased towards the end of the fixation period and during the ensuing saccade, suggesting the local neuronal excitability in the ASNs is transiently enhanced with a time-course complementary to that of the visual system. Finally, we observed that theta/alpha and beta range patterns of functional connectivity between FEF and the ASNs changed magnitude and direction over the saccade-fixation cycle. The connectivity profile suggests that excitability in the ASNs is modulated by top-down projections from the FEF. These results support a model in which saccadic modulation of neuronal excitability over a wide domain of auditory neocortical areas may complement similar modulation of excitability of the visual pathways to balance information processing during rhythmic saccadic sampling in complex natural environments.
Results
Saccades modulate neural excitability in the auditory selective networks (ASNs).
We investigated the influence of saccades (Figure 1A) on neural activity in ASNs by analyzing the dynamics of field potentials across the saccade-fixation cycle. Using standard auditory and visual localizers in 9 surgical epilepsy patients, we identified 220 auditory-selective sites (i.e., channels that responded to sounds but gave no detectable response to visual stimulation; Figure 1B). Next, patients performed a free-viewing task in which they explored a set of 80 images each presented for the duration of 6 sec in the absence of any auditory stimulation. Using simultaneous eye tracking, we defined time points corresponding to fixation onset and locked the analyses of electrophysiological signals relative to these time points (Figure 1C). As in our earlier studies7,15,26,29, we focus on neural events related to the end of the saccade (fixation onset) as this is an event with clear perceptual relevance; i.e., the point at which retinal inflow drives the ascending visual pathways. However, as discussed below, we also evaluated neural activity time-locked to saccade onset. On average, participants made 1054 fixations (standard deviation of 245) with the median fixation duration of 239 ms (Interquartile-range, IQR of 52 ms). The resulting 4 Hz rate of saccadic exploration during natural free viewing is typical for both human and non-human primates10,11,15,26.
Figure 1. Task, example field potentials and the anatomical distribution of auditory selective channels.
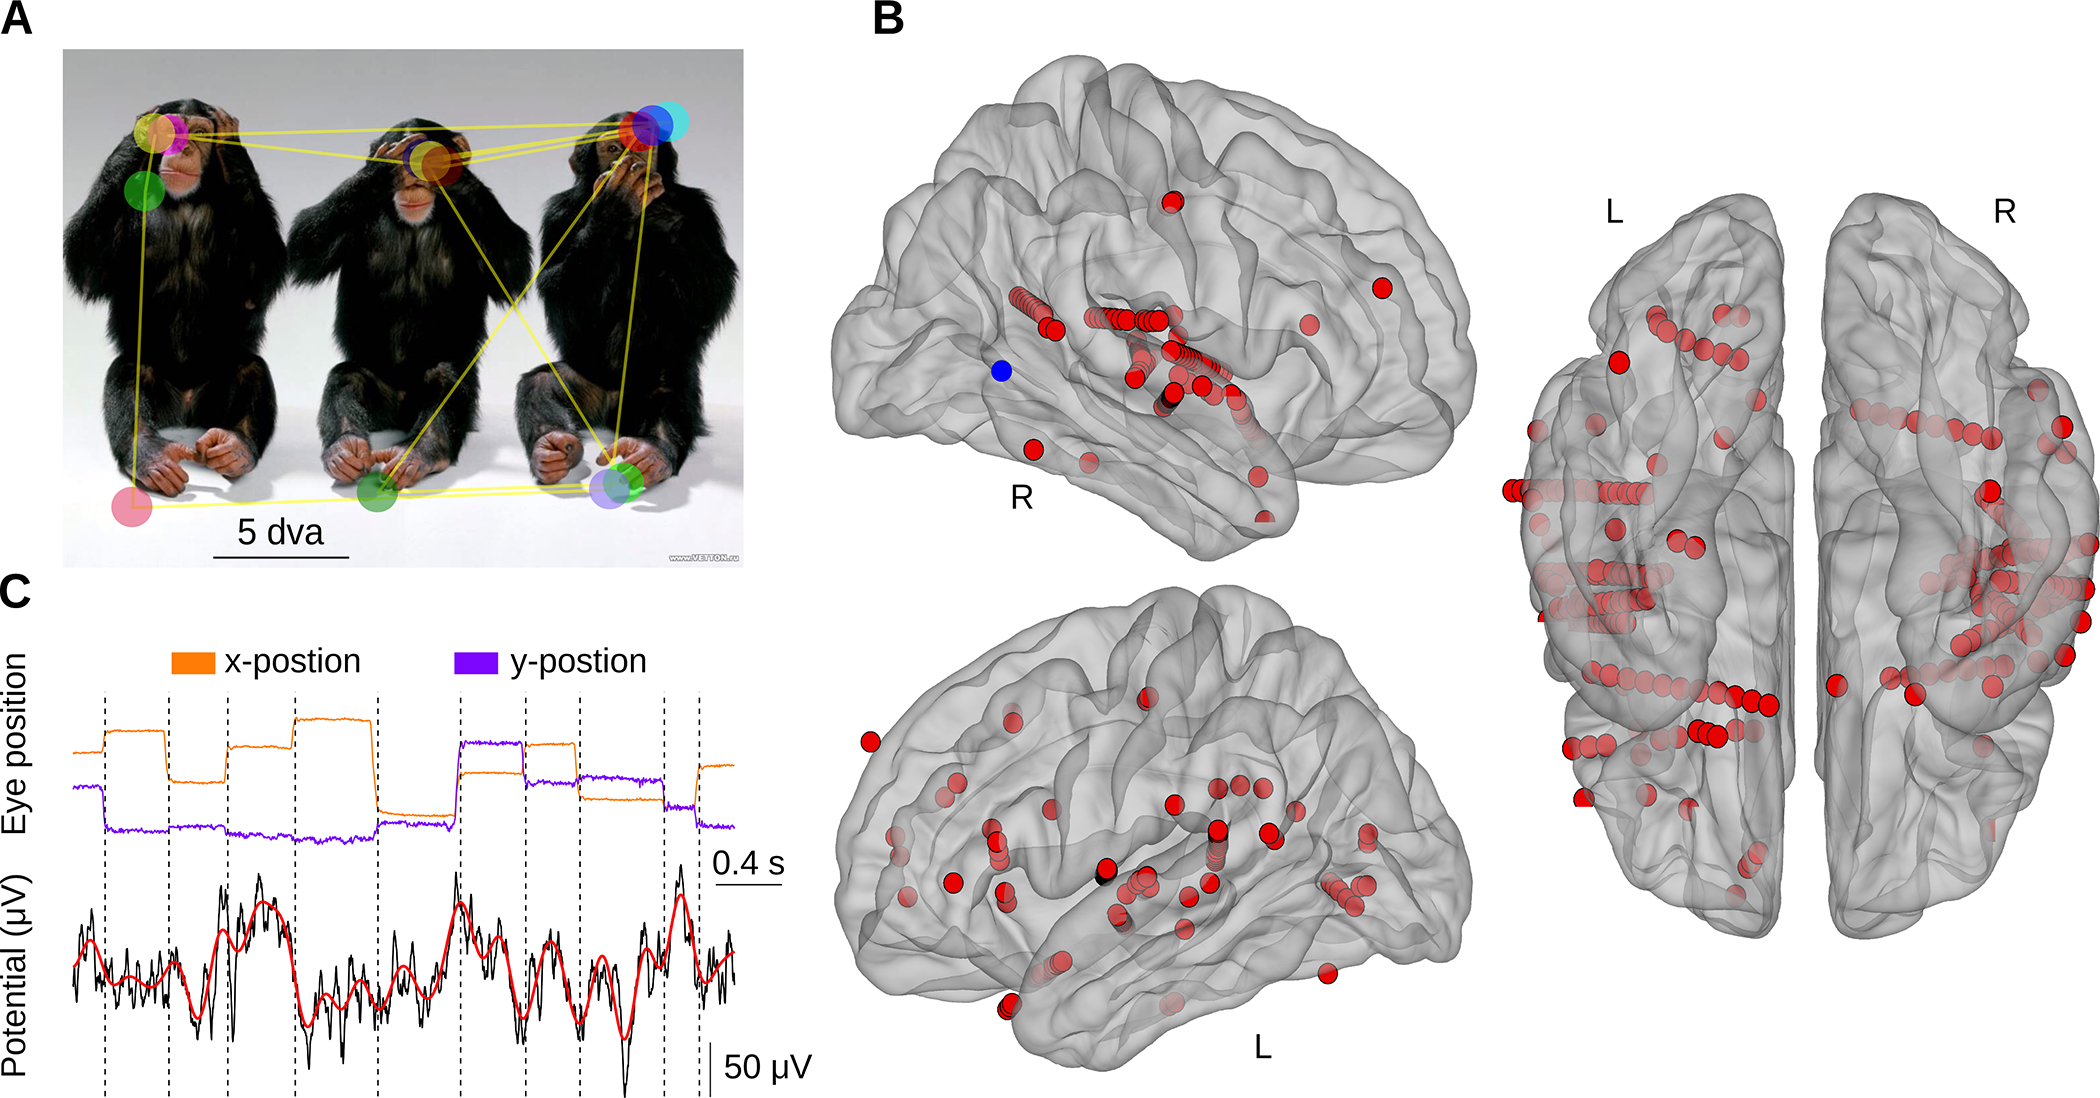
(A) Example image with superimposed trace of eye movements (yellow lines) and fixations (colored circles) during free viewing. (B) Anatomical distribution of auditory selective electrodes (N = 220 electrodes across 9 patients), which responded with an increased BHA to auditory stimuli and no detectable response to visual stimuli during the localizer task. Electrodes from all patients were registered onto an average brain. Left panels: lateral view. Right panels: inferior view (R – right; L – left). The blue dot in the right hemisphere indicates location of an example electrode presented in panel C. (C) Example eye tracking traces (x- and y-position of the eye presented in orange and violet, respectively) and a corresponding intracranial field potential from one electrode (blue dot in panel B). Vertical lines mark points of fixation onset. The lower panel presents raw field potential (black) and low-passed filtered at 5 Hz signal (the maximum saccade rate; red).
To investigate saccadic modulation of neural activity in the ASNs, we studied fixation-related changes in neural dynamics, as indexed by inter-trial phase coherence (ITC; a single-trial measure of phase locking of field potentials to an event) and power in low frequencies (<30 Hz). We also studied fixation-related changes in Broadband High frequency Activity (BHA; the amplitude of signals band-pass filtered within 70–150 Hz), which reflect neuronal processes that are separable from, but highly correlated with, neuronal firing29. We found two spectrotemporal ITC components: 1) an early broad-band component centered at 80–100 ms after fixation onset in the beta frequency range, extending down into alpha and theta ranges (Figure 2A, E, I); 2) a later band-limited component that was strongest 200 ms after fixation onset and limited to the theta range, corresponding to the rate of eye movement exploration (i.e., 3–5 Hz). Quantifying and directly comparing the magnitude of ITC in early (0–100 ms) and late (100–400 ms) post-fixation time windows relative to the pre-stimulus interval (−400 to 0 ms) confirmed the above impressions (Figure 2A, E, I). To ensure that these results are not biased by weak visual evoked responses in a subset of channels, we directly quantified fixation-locked evoked responses and differentiated a subgroup of channels with strong audio and weak visual evoked responses (i.e., below the initial detection threshold). The control analyses confirm that the effects are unchanged when weak fixation-locked evoked response sites are excluded (Figure S1 and S3).
Figure 2. Fixation- and saccade-locked neural activity in the ASNs.

(A) Color map shows average fixation-locked ITC (N = 220 channels, 9 patients; x-axis: time, y-axis: frequency). Vertical line indicates fixation onset. Horizontal lines bracket the frequency range of saccades (3 – 5 Hz). Right panel shows frequency distributions of ITC averaged within three time windows relative to fixation-onset: pre-fixation (gray; −400–0 ms), early-post (0–100 ms; orange) and late-post (100–400 ms; green). Shading reflects standard error of the mean (SEM). (B) Z-scored BHA locked to fixation onset aggregated across all ASNs (lower plot) and corresponding power spectra of the BHA power (upper plot). (C, D) Color maps show fixation-locked power without normalization (C) and normalized (D) by z-scoring each frequency separately to remove the 1/f component (x-axis: time; y-axis: frequency). The right panel (in D) shows frequency range of power fluctuations within three time windows relative to fixation-onset (as in panel A). Plots (E-F) are the same as A-D after removing electrodes with a saccadic spike (N = 204 channels, 9 patients). Plots (I-J) are the same as E-F but all analyses are locked to the saccade onset. (M) Box plots show the time of peak relative to the saccade onset for each signal of interest. Plots indicate 25th, median and 75th percentile, whiskers extend to extreme values not considered outliers. Star symbols indicate p-values: * reflects p < 0.05; *** reflects p < 0.005. “X” symbols in right panels A, D, E, H, I, L indicate p-values < 0.05 separately for the comparison between pre- vs. early- and late-post fixation time window (orange and green, respectively). All results controlled for multiple comparisons with Benjamini & Hochberg/Yekutieli false discovery rate procedure. See also Figure S1 and S2 and S3.
Next, we tested whether saccades modulate BHA signal from the pre- to the post-fixation time interval. We found that overall post-fixation (0–75 ms) BHA magnitude was reduced (z = 3.1, p = 0.001; N = 220; Figure 2B, F, J lower panels) compared to the pre-fixation interval (−75–0 ms). We also noted that fluctuation of BHA amplitude is synchronized with the rhythm of saccadic exploration. Using the Fast Fourier Transform of the BHA we observe a peak in the power spectrum at the rate of eye movements (3–5 Hz) as compared to the average of the directly neighboring ranges (Wilcoxon sign-rank; z = 5.00; p < 0.001; N = 220). To rule out the possibility that the pre-fixation BHA increases spuriously originate from extraocular muscle activity30 we analyzed saccade-related field potentials. We reproduced our results after eliminating any channels that showed “spike” morphology in saccade-related field potentials similar to that of extraocular muscles (see Figure 2E–H and S1). In sum, BHA power fluctuation in the ASNs is synchronized with the rhythm of visual exploration and overall increased in the pre- as compared to the post-fixation time interval.
We also examined spectral power modulations in lower frequencies (<30 Hz). Because we used electrode sites that respond selectively to the auditory classifier, it is not surprising that we did not observe an effect typical for the visual system, i.e., a fixation-locked evoked response. Instead we found a prominent narrow-band power increase in the range just above the rate of visual exploration (7–10 Hz; Figure 2C, G, K). Spectral power decreased in the pre-fixation period compared to both early and late post-fixation time windows. While we observed weak power modulations in a broad range of frequencies, power modulations in both time windows were centered at 7 Hz (Figure 2D, H, L).
In sum, our findings show that neural activity in the ASNs is synchronized with the rhythm of saccades. We find that 1) ITC increases at a number of frequencies (early time window) and at the rate of visual exploration (late time window); 2) alpha-band power decreases and 3) BHA fluctuations are synchronized with saccades having a magnitude increase near the end of fixation and during the ensuing saccade. These findings show that saccades modulate neural activity in the ASNs. Results 2 and 3 suggest additionally that neural excitability is highest just prior to and during saccades.
To determine whether the observed modulations generalize to other non-visual systems, we examined fixation-locked field potentials in electrodes located in the primary somatosensory cortex (S1) in a subset of patients (Figure S2). We found that saccades also modulate neural activity in S1 but with a temporal pattern similar to that observed in the visual system, and complementary to that we observe in the ASNs. This suggests that saccade-dependent modulations are domain general with auditory and somatosensory systems each being tuned with its own temporal dynamics.
To test for possible motor origins of the effects noted above, we studied the same signals but locked to the saccade onset. A peak in ITC, BHA or dip in low frequency power that precedes saccade onset would indicate that this effect is likely of motor rather than sensory origin (Figure 2I–M). Note that we studied the peak of the signal (as opposed to the onset) because this approach minimizes temporal uncertainty associated with the analyses of convoluted signals. We found that peaks of both (i.e., early and late) ITC effects followed saccade onset (both p < 0.02, z > 2.29; N = 204) with median time lag of 24 ms (IQR = 103 ms) and 64 ms (IQR = 432 ms) for the early broad-band and later band-limited component, respectively. Timing of the BHA peak did not differ from the saccade onset (p = 0.88; z = 0.14; N = 204). Importantly, the low frequency power decrease preceded saccade onset by a median of 78 ms (IQR = 308 ms; p < 0.001; z = 4.91; N = 204). Altogether these analyses suggest that the origins of modulations to ASNs include early contributions from the motor (i.e., saccade) system and later effects potentially stemming from the sensory system.
Anatomically specific modulations across the ASNs.
Temporal separation of power effects (preceding fixation onset) and ITC (following fixation onset) suggests there may be two mechanisms operating in synchrony with saccades in the auditory system. On one hand, post-fixation ITC increases may reflect retinal inputs propagating from the visual system to higher level auditory systems, related to multisensory integration (see Schroeder et al.,31). Power effects that precede fixation may, on the other hand, reflect a saccade-related preparatory influence or a momentary deployment of auditory attention which involves widespread anatomical regions32. To explore these possibilities, we studied the anatomical specificity of modulations observed above, and separated fixation-locked ITC, low frequency power, and BHA in distinct regions of interest (ROIs) across the ASNs. Based on individual anatomical landmarks, we divided all auditory selective channels into six ROIs: Heschel’s Gyrus (HG), Superior Temporal Gyrus (STG), Frontal cortex (FC), Parietal cortex (PC), Occipital cortex (OC) and Insular cortex (IC) (N = 41, 69, 28, 24, 11, 26 respectively). While saccades modulate different aspects of neural activity across all these areas (Figure 3 and S3), ITC and BHA/low frequency power modulations indeed concentrate in different ROIs supporting the idea that they reflect two distinct processes operating in synchrony with saccades. ITC in frequencies corresponding to the rate of saccades increased from the pre- to post-fixation interval in auditory selective sites in FC, PC and OC (all p < 0.05; all z > 1.96; Wilcoxon sign-rank test; Figure 3A). This increase was specific to the rate of saccades only in the FC, while it extended into higher beta frequency range in PC and OC. Additionally, STG showed increased ITC only in the beta frequency range (20–30 Hz). In contrast, BHA amplitude was higher before fixation compared to the period immediately after fixation onset in HG and STG (both p < 0.03, both z > 2.07), but it showed the opposite pattern in the OC (p = 0.04; z = 2.04; Figure 3B). Finally, we observed concentration of power around the theta and lower alpha range that was particularly prominent in STG and PC (Figure 3C and S3). We noted similar effects in HG and IC but they did not survive correction for multiple comparisons. Altogether these results show that saccades influence neural activity in all auditory selective ROIs, but post-fixation ITC and pre-fixation changes in BHA/low frequency power are observed in different ROIs (ITC: higher level areas in the FC and PC; BHA: lower-level auditory areas). Temporal and anatomical separation of ITC and BHA effects supports the notion that two distinct mechanisms may operate in synchrony with saccades in the auditory system. These effects were reproduced in control analyses which only considered “pure” auditory selective channels (i.e., after removing channels with potential weak visual input; Figure S3D–F).
Figure 3. Fixation-locked neural activity across anatomical regions in the ASNs.
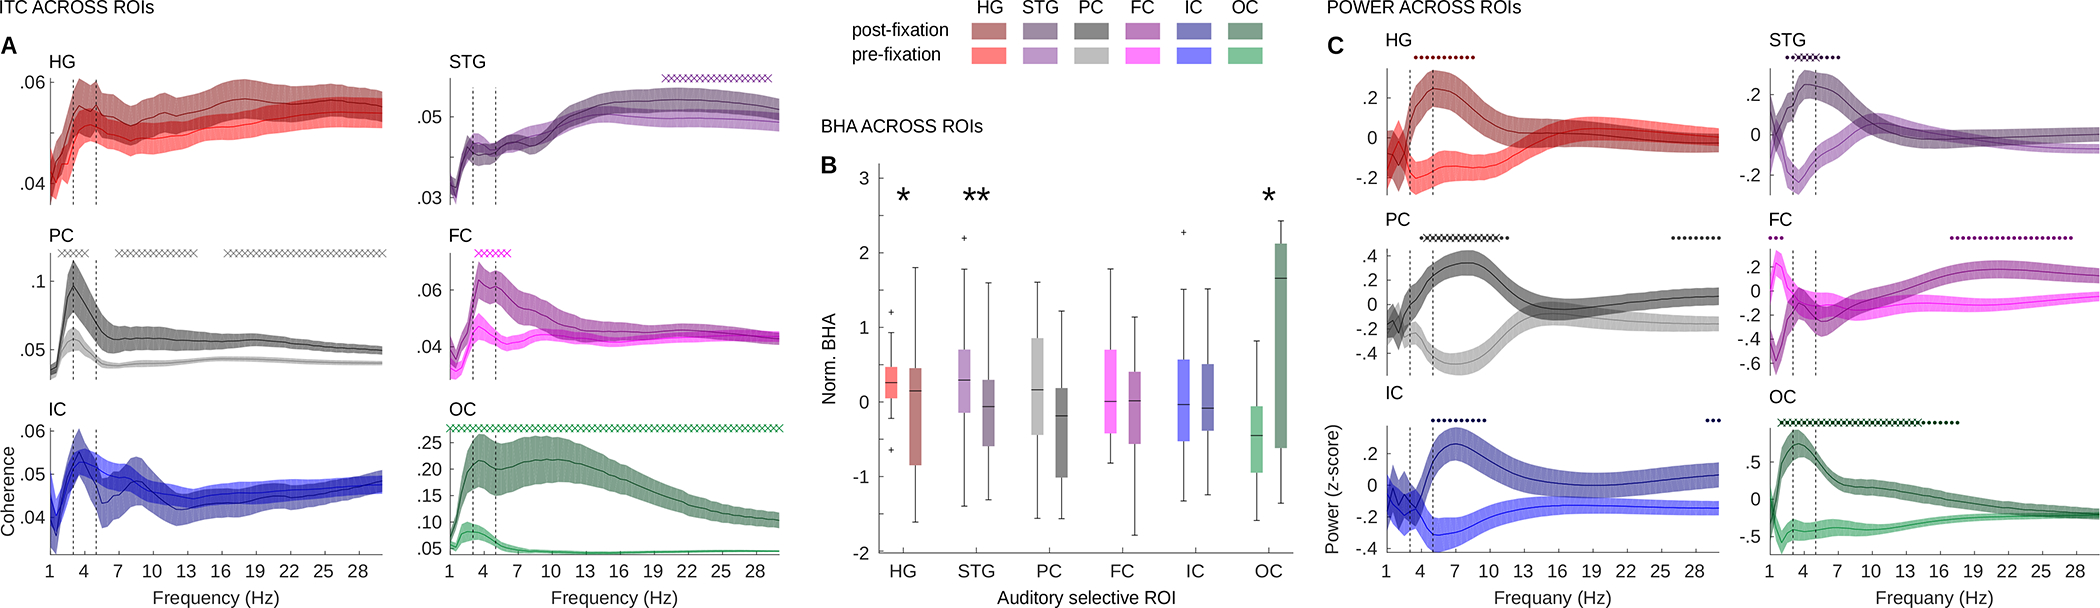
(A) Average ITC before (brighter colors; −400:0 ms) and after (darker colors 0:100 ms; i.e., early time window) fixation onset separately for each ROI (x-axis: frequency; y-axis: ITC magnitude). Vertical lines bracket the frequency range of saccades (3 – 5 Hz). (B) Z-scored BHA before (brighter colors; peak BHA location) and after (darker colors; 0:100 ms) fixation onset separately for each ROI. Plots indicate 25th, median and 75th percentile, whiskers extend to extreme values not considered outliers. (C) Z-scored power before (brighter colors; −400:0 ms) and after (darker colors; 100:400 ms; i.e., late window) fixation onset separately for each ROI (x-axis: frequency; y-axis: power magnitude). Star symbols in B indicate p-values: * reflects p < 0.05; ** reflects p < 0.01. “X” symbols in panels A, C indicate p-values < 0.05. All results are controlled for multiple comparisons with the Benjamini & Hochberg/Yekutieli false discovery rate procedure. “.” symbols in panel C indicate p-values < 0.05 uncorrected. See also Figure S3.
The intriguing phase reversal of BHA modulation between HG, STG and OC merits further analyses. It appears that during saccadic sampling of a scene, BHA oscillates with opposite phases in the HG and STG as compared to OC: a decrease from pre- to post- fixation in the HG and STG is accompanied by an increase in the OC. This suggests that excitability in the auditory system is suppressed during the time when retinal input is invading the occipital cortex and elevated during saccades, when the OC excitability is reduced. To directly test this possibility that BHA in the auditory and occipital regions is modulated at distinct phases of the saccade-fixation cycle, we compared magnitude of BHA in each ROI to that observed in the OC separately in the pre- and post-fixation time windows (i.e., at two distinct phases of the saccade-fixation cycle). In the pre-fixation time interval (−75:0 ms) BHA in all ASN regions was increased compared to the OC (all p < 0.01; all z > 2.37; Wilcoxon rank-sum). In contrast, during the post-fixation time interval BHA in HG and PC (all p < 0.006; all z > 2.71) was decreased compared to the OC. There was no detectable difference between STG, FC, IC and OC (all p > 0.07; all z < 1.79). These results show that saccadic modulations of BHA in OC have a temporal pattern complementary to that in other auditory selective areas. OC sites in our study follow a pattern documented in purely visual areas like V115. Before and during saccades, when excitability in the visual system is suppressed, excitability in the auditory system, as indexed by BHA, increases. Enhanced auditory excitability before and during saccades may improve sampling of the environment when the visual system is suppressed (i.e., during saccadic suppression).
We observed that BHA decreased from the pre-fixation to the post-fixation intervals in HG and STG. Studying BHA in each of these regions we noted that the time-course of the BHA differed between HG and STG. To understand these differences, we quantified the time of BHA peak relative to fixation onset and area under the curve, which confirmed the above impressions about the divergent dynamics of BHA modulation in HG and STG. It appears that the pre-fixation BHA increase in the HG was earlier (peak time = −102 ms vs. −80 ms relative to fixation onset; p = 0.03; z = 2.08; Wilcoxon rank-sum) and more prominent (p = 0.001; z = 3.15) compared to the STG. Although BHA modulation in other regions did not reach statistical significance when comparing pre- to post-fixation intervals, the time-course in these ROIs showed dynamics similar to that in the STG with the peak immediately before fixation onset (see Figure S3F).
Auditory responses are transiently enhanced during saccades.
Next, we investigated modulation of auditory evoked responses across the phases of the saccade-fixation cycle. We reasoned that momentarily increased neural excitability at any point in the saccade-fixation cycle would increase the strength of concomitant neural responses to auditory stimulation. To test this idea, we examined data from an additional experiment recording from patients while they viewed movies with and without a continuous audio stream; this was done in 8 of the 9 patients reported above (N = 187 ASNs channels). We normalized fixation-locked BHA time courses by z-scoring each individual condition so that they were all centered to a common value. This enabled us to directly compare time courses of fixation-locked BHA across the three conditions: free-viewing of movies 1) with, 2) without audio and 3) static images.
The overall dynamics of fixation-locked BHA during free viewing of movies (both with and without the audio stream) were similar to those observed during free viewing of static images – BHA peaked prior to fixation onset followed by a dip around 100 ms after fixation onset (Figure 4A). Importantly, we found that BHA in the time interval prior to fixation onset was elevated during viewing of movies with audio (Figure 4A, B) as compared to both movies with no audio (z = 3.9; p < 0.001; N = 187; Wilcoxon sign-rank) and static images (z = 2.4; p = 0.01; N = 187). There was no detectable difference in BHA magnitude between conditions with no auditory stimulation (z = 1.81, p = 0.07; N = 187) or between any of the conditions in the time window following fixation onset (all z < 1.6; p > 0.1; N = 187). We reproduced these effects in a control analysis in which we excluded weak visual response channels, as discussed above (Figure S4A, B). To ensure these effects are not due simply to the presence or absence of the auditory input we confirmed that the intensity of the auditory stimulus stream did not differ between pre- (−0.1–0 sec) and post-fixation (0–0.1 sec) time windows; this held true whether we considered raw audio input or the envelope of the wide band filtered auditory stream (both z < 1.26, p > 0.20; N = 8 patients). Similarly, there was no detectable difference in wider time windows of +/−0.4 and +/−0.6 sec (all z < 1.12; all p > 0.26; N = 8 patients). Altogether, these results show that during natural free viewing, neural response to the auditory stimulation in the ASNs is transiently amplified just prior to a given fixation onset (i.e., late in the fixation period and during the ensuing saccade). Because auditory stimulation was comparable throughout the saccade-fixation cycle, we conclude that the BHA enhancement results from increased excitability during this part of the fixation-saccade cycle, and not the auditory stimulus.
Figure 4. Neural responses to auditory stimulation are transiently amplified during saccades.

(A) Fixation-locked BHA (z-scored) in three viewing conditions: free viewing of movies with audio stream (blue), movies with no audio (green) and free viewing of static images (red). Data are aggregated across all 187 ASNs. This number is lower than reported in analyses above because only 8 out 9 patients performed all three viewing conditions. X-axis: time relative to fixation onset; Y-axis: magnitude of BHA modulation. Shading reflects SEM. Lines above panel A indicate p-values < 0.05 (controlled for multiple comparisons) separately for two a priori comparisons: movies with audio vs. movies with no audio (green) and movies with audio vs. static images (red). (B) Magnitude of fixation-locked BHA in pre- (−100:0 ms) and post-fixation time windows (0:100 ms). Box plots indicate 25th, median and 75th percentile, whiskers extend to extreme values not considered outliers while outliers are marked with crosses. Star symbols indicate p-values: **, *** signifies p < 0.01, 0.005, respectively; ns signifies p > 0.05. See also Figure S4.
Saccades organize bidirectional communication between the FEF and ASNs.
The finding that saccades modulate input processing in the ASNs suggests that like visual networks, ASNs are modulated by a top-down influence from regions involved in saccade generation, such as the FEF. To test this possibility, we examined the direction of network interactions between the FEF and ASNs using the Phase Slope Index (PSI33). PSI is a network connectivity measure that quantifies the consistency of change in phase difference across frequencies. It computes the slope of the phase of cross-spectra between two time-series for a specified frequency bin (see Figure S5 for simulation results defining optimal bin size). It builds on the idea that interactions between regions require some time and, if the speed at which signals in different frequencies travel are similar, the phase difference between sender and receiver increases with frequency33. Specifically, we focused on channels in the Superior Temporal Gyrus (STG, 54 channels across 4 patients with simultaneous FEF recordings) because this region was present in all patients with FEF electrodes and previous anatomy studies found that neurons in FEF (particularly the rostral part) project primarily to the STG34. It is however worth noting that the results are similar whether we consider all auditory selective channels or only STG sites (Figure S5A).
If signals from the FEF influence neural excitability in the auditory system prior to fixation onset, we expect to see primarily top-down directional network interactions from the FEF to STG towards the end of fixation. This top-down interaction would be reversed to a primarily bottom-up direction after fixation onset when sensory signals propagate up sensory hierarchies to regions programming the next eye movement. Because the sign of the PSI reflects the direction of network interactions, following previous studies33, we tested the magnitude of PSI against a null hypothesis that PSI is not different from zero.
We found significant directional network interactions in theta/alpha (3–12 Hz) and two beta frequencies (lower-beta 12–20 Hz and higher-beta 22–27 Hz; Figure 5C–D). Bottom-up interaction from the STG to FEF was in theta/alpha and higher beta frequencies while top-down from the FEF to STG was in lower beta frequencies. Importantly, we observed that these directional network interactions were changing in time across the saccade-fixation cycle (Figure 5C). The theta/alpha bottom-up interaction was significant throughout the entire saccade-fixation cycle with a noticeable frequency expansion and dip of the effect at fixation onset. The lower beta top-down influence was strongest late in fixation and during saccades. The higher beta bottom-up influence was in turn strongest right after fixation onset. Together, these results suggest that top-down and bottom-up interactions between the FEF and the STG are multiplexed in frequency and change across the saccade-fixation with a burst of top-down interactions concentrated in lower beta frequency range late in fixation period and during the ensuing saccade.
Figure 5. Network connectivity between FEF and STG during free viewing of static images.

Color maps show averaged fixation-locked ITC (A; N = 8 channels, 4 patients; x-axis: time, y-axis: frequency) and power (B) in FEF. Right panels show frequency distributions of ITC (A), power (B) in three time windows relative to fixation-onset: pre-fixation (−400:0 ms; gray), early-post (0:100 ms; orange), late-post (100:400 ms; green). Shading reflects SEM. (C) z-statistics from a Wilcoxon test comparing PSI against a null hypothesis (i.e., PSI not different from zero) relative to fixation onset. Negative values (blue) indicate points when STG leads FEF (i.e., bottom-up), positive values (red) indicate reversed (i.e., top-down) direction. Contours depict significant time-frequency points (p < 0.05 controlled for multiple comparisons). (D) Schematic representation of the network interactions as observed in C. Theta/alpha- (dark blue) and upper beta-band (light blue) interaction from the STG to FEF at about 200 ms prior to fixation (pre-fixation 1). The upper beta activity was attenuated during the saccade and replaced by top-down interaction in lower beta (pre-fixation 2; red), which occurred with theta/alpha-band bottom-up activity (dark blue). After fixation onset, all three activities lasted for about 200 ms (post-early). Vertical line marks fixation onset. Arrows indicate direction of network interaction. See also Figure S5.
Discussion
Combining eye tracking and iEEG in surgical epilepsy patients during naturalistic free viewing, we found that the saccade-fixation cycle is associated with systematic modulation of neural excitability across multiple classical auditory and speech processing regions. We observed fixation-locked phase concentration at the rate of saccades as well as sustained power in the lower part of the alpha spectrum (~7–10 Hz) that dropped before fixation onset. Broadband High-frequency Activity (BHA) was increased late in the fixation period and during the ensuing saccade, and neural responses to auditory stimulation were transiently enhanced during this time frame. In the absence of stimulation that drives the auditory system, we interpret changes to BHA and alpha power as reflecting modulations of excitability. These effects showed distinctive anatomical distributions with phase effects linked to higher order speech regions and power effects observed in primary and secondary auditory regions. Finally, we observed dynamic bi-directional network interactions between the FEF and STG in theta/alpha, higher- and lower-beta frequencies with strongest top-down interaction measured in the lower-beta frequency range late in the fixation period and during saccades. This pattern of results indicates that during natural active vision, local neural activity in auditory areas is dynamically modulated over the course of the saccade-fixation cycle, likely through long-range interactions with networks involved in the generation of saccades.
Saccadic modulation beyond the visual system.
Previous studies found that neural ensembles in the visual system are transiently reorganized to a high-excitability state after fixation onset (i.e., during the time when visual inputs propagate in the visual cortex) which enhances neural responses to sensory input7–9,15). Similarly, in rodents, natural active sensing boosts neural activity in primary sensory areas35–37. Here, we show that a critical form of active sensing in humans, saccadic sampling of the visual scene, modulates neural activity across a much larger network than previously recognized. This network extends into the classical auditory and speech processing regions with distinct effects in the lower and higher order areas. Supplementary analyses indicates that saccadic modulation also occurs in primary (S1) somatosensory cortex, but has a temporal pattern similar to that observed here in OC as well as in a range of visual areas7–9,15, and complementary to that we observe in the ASNs. This suggests that the influence of saccades is domain general with auditory and somatosensory systems each being tuned with its own temporal dynamics. With certain caveats (see Methods), these findings accord reasonably well with results from the macaque primary auditory cortex27.
Saccadic modulation in relation to auditory processes.
We noted a contrast between the increased phase coherence starting around 80 ms after fixation onset in higher order auditory areas in the frontal and parietal regions, and the BHA and alpha power modulations that are strongest before fixation onset in lower-level auditory areas. This contrast raises the possibility that there are two mechanisms operating in synchrony with saccades in the auditory system. On the one hand, phase coherence effects may reflect retinal inputs propagating from the visual system to higher level auditory systems, related to multisensory integration (Schroeder et al.,31). On the other hand, excitability, as indexed here by BHA magnitude and alpha power modulations, appears highest before fixation onset and likely reflects a saccade-related preparatory influence. It is possible that the elevation of excitability across the auditory system before fixation onset reflects a momentary deployment of auditory attention. In support of this, psychophysical findings suggest that as in vision38, auditory attention is spatially and temporally linked to the saccade-fixation cycle39–41. The time course of saccadic influences on auditory discrimination shows that a saccade’s impact starts prior to movement onset and peaks while the eyes are moving40, which corresponds with the timing of BHA and alpha power modulation we observe as well as that of multiunit activity modulation in monkey A127. Our results, together with those of prior psychophysical studies, suggest pre-fixation neural modulations may have a strong attentional component. In support of this idea, we also observed increased directional network interactions from the FEF to the auditory system late in the fixation period and during the ensuing saccade. It is possible that this top-down signal from the FEF modulates excitability in the auditory system implementing a physiological mechanism for transiently enhancing auditory attention21,22,42. If auditory attention is yoked to saccades, one would predict that the auditory environment is sampled periodically at the rate of saccades. Indeed, similar to vision43,44 auditory attention has been suggested to operate in a periodic mode45,46. Whether or not the signal modulating neural activity in auditory areas during saccades indeed reflects attention, it clearly does influence auditory processing (Figure 4 and S4) and likely plays a role in natural active sensing.
What might this role be? One possibility is that audition, and possibly other senses, compensate for reduced visual sensitivity during saccadic suppression. This idea builds on the observation that momentary increases in activity in the auditory system and enhancement of auditory attention coincide with reduced neural response magnitude and depression of sensitivity in the visual system. Such a mechanism may be particularly useful to compensate for loss of sensitivity in the magnocellular visual pathway which is strongly suppressed during saccades38. Given the preferential representation of visual motion in the magnocellular system, it is possible that enhancement of the ASNs during saccades may help preserve object motion perception during saccadic sampling of a complex multisensory environment. This interpretation is supported by the observation that the time course of neural excitability modulation across the visual hierarchy and related perceptual sensitivity modulation correspond well with the time course of modulations observed in our study. We observed that change in power starts 78 ms before saccade onset (alpha power) and peaks during saccade (BHA). Previous psychophysical studies observed that suppression of sensitivity in the visual system starts 50 ms before saccades, peaks at the time of movement onset and outlasts saccades by another 50 ms followed by later post-saccadic facilitation47–49. Similarly, electrophysiological recordings in the motion-sensitive areas of the dorsal stream50,51 as well as the ventral stream and MTL13 and LGN5 in non-human primates match well with the time course of perceptual suppression in humans. Human EEG recordings show an influence of saccade planning on auditory evoked potentials52 that has a similar time course. Motion information is not the only visual quality distorted during saccades. Stimulus location is also mislocalized near saccade onset53–55. This effect is hypothesized to compensate for displacement of an image on the retina. Importantly, the spatial mislocalization starts around 100 ms before the saccade onset which closely corresponds to the timing of alpha power modulations here.
Top-down influences of saccade-generating systems.
Prior studies suggest that the motor system modulates processing in the auditory system by aligning temporal attention with the timing of predictable events56–58. Others have suggested that saccade-generating areas send “corollary discharge/efference copy” signals to sensory areas to prepare them for reafferent input59. Our results do not distinguish between these alternatives. It is worth noting, however, that in contrast to covert attention paradigms, where operation of the higher-order mechanism must be inferred from differential performance, tracking the eyes allows us to simply and precisely define an event (the saccade) with clear causal (motor system) antecedents. Thus, while our findings can fit with an attentional explanation (above), they do not require it. Moreover, while there are multiple top-down, bottom-up and lateral circuits conveying visual input into the auditory pathways31,60, most neurons in auditory areas do not give frank responses to retinal input; i.e., they do not receive “driving” visual input. These factors lend confidence to our conclusion that saccadic effects on processing in classic auditory cortical areas are largely “modulatory” in nature, possibly a primate correlate of effects observed with “head saccades” in the midbrain of the Barn Owl61.
During natural active vision, saccade generation provides predictions that are propagated throughout the brain18. Our findings suggest that in this process, FEF interactions with the auditory system entail top-down and bottom-up interactions that vary dynamically across the saccade-fixation cycle and are multiplexed in frequency. While this observation is novel for FEF-ASN circuitry, similar multiplexing patterns of connectivity have been reported, including theta-alpha/beta multiplexing in the amygdala-hippocampal circuitry in humans62 and prefrontal-hippocampal circuitry in monkeys63. Multiplexing in corresponding frequencies has been proposed between several nodes in the visual system with theta and gamma rhythms proposed to serve feed-forward, the beta rhythm proposed to serve feedback influences in monkeys64 and humans65. Importantly, our results show that processes tightly linked to saccades transiently organize these multiplexed connectivity patterns modulating both the strength and direction of interaction between the FEF and the auditory system. Our results extend these previous multiplexing connectivity models by showing that network interactions in the alpha and beta ranges may serve interactions in bottom-up as well as top-down directions.
STAR Methods
RESOURCE AVAILABILITY
Lead contact
Further information and requests for resources should be directed to and will be fulfilled by the lead contact, Marcin Leszczynski (ml3972@cumc.columbia.edu).
Materials availability
This study did not generate new unique reagents.
Data and code availability
All data needed to evaluate the conclusions in the manuscript are present in the paper and supplement. Additional data available from authors upon request. This paper does not report original code.
EXPERIMENTAL MODEL AND SUBJECT DETAILS
Continuous eye tracking and iEEG data were recorded from 9 patients (average age 38.6; age range 29; 3 females) implanted with electrodes for surgical treatment of refractory epilepsy. All recordings were performed at the North Shore University Hospital, Manhasset, NY. The study was approved by the institutional review board at the Feinstein Institute for Medical Research and all patients gave written informed consent before implantation of electrodes.
METHOD DETAILS
Task.
Participants were presented with a set of 80 images (see Figure 1A for example of an image) each presented for 6 seconds. They were asked to freely explore each image with no constraints or further instructions. After each image participants were asked to rate how much they liked it on a 5 point Likert scale (data not analyzed in the current study). Apart from the free viewing of static images, a subset of patients also performed free viewing of movies with audio (10 min long clip from ‘Despicable Me’ in English; a different 10 min long clip from ‘Despicable Me’ in Hungarian; two repeats of a 4 min long cartoon movie ‘The Present’) and movies with no audio (3 different 5 min long clips of commercially produced nature documentaries; these data are presented in Figure 4 and S4). All movies were encoded at 30 frames/s. Display size was similar for free viewing of static images movies (~25–30 dva; see Figure 1A). Similarly, to the static images condition, participants were asked to freely view each movie with no constraints or further instructions. To ensure our analyses of fixation-locked signals are not contaminated by another saccade/fixation we followed a strategy used in previous works and only considered fixations that lasted 200ms (for similar approach see66,67). This was also applied to movie viewing conditions. This preprocessing decision, important for our analyses of the neural data, creates distributions that are equalized across three conditions and by definition contain fixations above 200 ms. Consequently, the three conditions (i.e., free viewing of static image, movies with audio and movies without audio) did not differ regarding: 1) saccade rate (mdn = 3.1, 2.9, 2.9 for free viewing of static images, movies with and without audio, respectively; Kruskal-Wallis test; chi-sq(2,21) = 2.61, p = 0.27); 2) saccade duration (mdn = 25, 24, 37 ms for free viewing of static images, movies with and without audio, respectively; Kruskal-Wallis test; chi-sq (2,21) = 5.25, p = 0.072; or 3) fixation duration (mdn = 315, 335, 345 ms for free viewing of static images, movies with and without audio, respectively; Kruskal-Wallis test; chi-sq (2,21) = 2.61, p = 0.27).
Electrophysiology data acquisition.
Intracranial EEG (iEEG) data were acquired continuously at 1.5 kHz (16-bit precision, range±8mV, DC; Tucker–Davis Technologies, Alachua, FL, USA). Continuous iEEG and eye tracking data were co-registered based on simultaneous time-stamps. Co-registered data were segmented into 6 sec long epochs relative to a stimulus onset and lasting for the duration of stimulus display. Segmented iEEG was down-sampled to 500 Hz for further preprocessing. Subsequently, we removed line noise using band-stop filters (Butterworth 4th order) at 60 Hz, 120 Hz and 180 Hz and created a bipolar montage to maximize spatial specificity of the signal and also to decrease common noise and contributions from distant sources through volume conduction. To this end, we subtracted signals from neighboring contacts on each electrode shaft.
Auditory selective channels.
We used an auditory localizer to identify auditory selective channels (for a similar approach see for example68). These channels were defined as responding with an increased BHA (70–150 Hz) to auditory but not visual stimuli. Participants were passively presented with a set of auditory stimuli (including white noise bursts, syllable trains, music, speech-native and foreign). Subsequently, we compared the amount of BHA elicited by the auditory stimulus relative to the pre-stimulus baseline. To ensure auditory specificity, we only considered channels that responded to auditory stimulus with strong increase from the baseline BHA level (pairwise t-test; t > 10) and did not show any change in response to the onset of the visual image (at the same t-test threshold). This resulted in 220 channels (and 204 after removing channels that showed saccadic spike) across 9 patients. For analysis presented in Figure 3 and S3, we assigned each of these 204 channels into one of 6 anatomical locations. This was done based on individual anatomical landmarks and confirmed by an experienced neurologist. We defined six regions of interest: Heschel’s gyrus (HG; 41 channels, 6 patients), Superior Temporal Gyrus (STG; 69 channels, 9 patients), Frontal Cortex (FC; 28 channels, 6 patients), Parietal cortex (PC; 24 channels, 4 patients), Insular Cortex (IC; 26 channels, 7 patients), Occipital Cortex (OC; 11 channels, 3 patients). Note that the total sum of channels assigned into these six ROIs is 199. The additional 5 auditory selective channels were in the inferior temporal gyrus (2 channels), entorhinal cortex (2 channels) and middle temporal gyrus (1 channel). These five channels were not included in the ROI analyses.
Saccadic spike potential.
Could our results reflect extraocular muscle activity rather than genuine neural signals? Previous studies identified the spike potential in scalp EEG that is generated by extraocular muscle activity30. Similar spike potentials have been also found in the intracranial recordings69,70. The spectral profile of this spike spares lower frequencies (<30 Hz) but overlaps with BHA range, thus one has to use caution before interpreting the current BHA results. To determine if the BHA signals are contaminated by the extraocular spike, we inspected saccade-locked ERPs (rather than fixation-locked ERPs) in which the spike exceeds neural response by orders of magnitude. The extraocular spike manifests as a bi-phasic transient ERP modulation locked to the onset of the saccade lasting for the duration of the saccade. We identified 16 channels with such a morphology in our data (Figure S1A–C) primarily in the frontal cortex (N = 8) and anterior portion of the STG (N = 5), anterior insula (N = 2) and one on the border between the insula and Heschel’s gyrus (N = 1). Eliminating these channels did not change any of the results (Figure S1D–G). In particular, the morphology of the BHA power fluctuation, its synchronization with the rhythm of visual exploration (Figure S1E), as well as overall decreases from the pre- to the post-fixation interval (z = 2.32, p = 0.01; N = 204) were reproduced after removing these channels. All consecutive analyses are performed on 204 channels which show no detectable sign of extraocular spike potential. While we rule out the possibility of the saccadic spike to explain the current findings, our observations dovetail with previous studies showing that intracranial recordings near the orbits, even with bipolar referencing, are potentially contaminated by extraocular muscle spike potentials69,70.
Control analyses.
One possibility is that phase and power perturbations in low frequencies (<30 Hz) reflect fixation-locked visual evoked response, rather than phase perturbation. We defined the ASNs to be auditory-selective but it is possible that some of these channels have weak fixation-locked evoked responses. To test this possibility, we directly compared field potentials in pre- (−100 to 0 ms) and post-fixation intervals (0 to 400 ms in 50 ms bins; Figure S1H). To account for possible polarity differences across channels, we first rectified and z-scored fixation locked field potentials. Statistically, ASNs showed no detectable modulation of event related field potentials (all p > 0.05 Wilcoxon sign rank test; N = 204; Figure S1H; red time-course on the top). However, by inspection of responses in each individual electrode, we identified a small fraction of channels in the occipital region that showed an evoked type of response as indexed by post-fixation field potential deviation relative to pre-fixation baseline (Figure S1H; blue line on the bottom). The “multisensory” response profiles in these channels may stem from sparse direct projections to the occipital lobe from the auditory system71.To understand whether our results are driven by responses in these sites we performed two control analyses in which we reproduced all our main results with more conservative criteria for classifying electrodes as auditory selective. First, we repeated our analyses after excluding these occipital electrodes, reproducing all our main results without these putative multisensory sites (Figure S1I–L).
To further guard against the possibility that our results depend on activity in similar multisensory channels outside of the occipital lobe (e.g., polysensory projections from the visual system that terminate in auditory regions72,73), we conducted another control analysis in which we identify a subgroup of ASN channels showing what appear to be weak visual evoked potentials. This control analysis splits our total pool of channels into pure auditory selective channels (N = 155) and auditory selective channels with strong audio and weak visual evoked response (i.e., mixed channels; N = 49). Specifically, we labeled as mixed audio selective all these channels that showed strong auditory response (taudio > 10) in the auditory localizer and weak visual evoked response in the visual localizer (tvisual > 1.96 & tvisual < 10). Furthermore, we classified as pure audio selective all these channels that showed strong auditory response (taudio > 10) in the auditory localizer and no detectable visual evoked response in the visual localizer (tvisual < 1.96). Note that the mixed-selective channels did not show a classical strong visual evoked potential (see Figure S3). This control analysis showed that the effects we report do not depend on activity in the mixed auditory selective channels as we reproduced all our main findings in the group of pure auditory selective channels (Figure S3A–C).
We interpret increased BHA just prior to the saccade in the audiovisual movie watching condition as reflecting amplification of auditory evoked activity coincident with the saccade (Figure 4 and S4). An alternative explanation of this BHA increase is that it simply reflects an auditory evoked response to sounds that reliably trigger saccades. Although possible, there are at least two reasons why this explanation is unlikely. First, it relies on the assumption that there is a consistent time interval between a change in auditory stimulus and the offset of most saccades. To test for this possibility, we directly compared the intensity of the auditory stimulus stream before and after fixation onset (+/−0.1, 0.4 and 0.6 sec time intervals) and found no detectable difference. Second, increased BHA was primarily observed on the side contra-lateral to the saccade direction (see Figure S4D–I). This pattern of effects is unlikely to be explained by the evoked response from a salient change to auditory stimulus. In that case one would have expected a similar difference on both contra- and ipsi-lateral sides because both ears were stimulated with an auditory stream of comparable qualities (the sound source is in the monitor the subject is watching). Thus the more parsimonious explanation appears to be that a saccade-linked modulatory process increases neural excitability towards the end of fixation and during ensuing saccade.
Primary somatosensory cortex (S1).
To determine whether the observed modulations generalize to other non-visual systems, we examined fixation-locked field potentials in electrodes located in the primary somatosensory cortex (S1), in a subset of patients with electrodes implanted in the S1 region (N = 4 patients; 15 channels). These electrodes had no detectable saccadic spike artifact and were exclusive of the set of auditory selective channels analyzed above. Channels were classified as primary somatosensory cortex (S1) if they were localized in the postcentral gyrus (Desikan-Killiany Atlas). The analysis revealed clear saccadic modulation in S1, though the precise pattern of effects differed between the auditory system and S1 (Figure S2). For example, fixation-locked ITC appears to be modulated in S1 though such modulation was not detectable in primary auditory cortex (HG). BHA peaks after fixation onset in S1 (Figure S2B), while it peaked before fixation onset in HG (Figure S3F). We also observed that ITC increases across a number of frequencies in theta, alpha and lower beta ranges (i.e., 5–16 Hz; Wilcoxon sign rank test; all z > 1.96, all p < 0.05; N = 15), centered around the 100 – 250 ms post-fixation window. This is different from the low-level auditory system (no detectable low/mid frequency ITC in HG), but similar to higher order auditory areas.
Frontal eye fields channels.
The frontal eye fields were identified during clinical electrical stimulation mapping using intracortical stimulation (bipolar, symmetric bi-phasic squarewave pulses, 0.2ms/phase, 0.5–4mA, 50Hz for ~1 sec). Channels were considered to be located in the frontal eye fields if stimulation elicited forced gaze deviation to the contralateral side of stimulation and the anatomical location was in the dorsolateral prefrontal cortex (see Vernet et al.,74 for review). Eight channels (in four patients) met these criteria. Analyzing fixation-locked spectral ITC and power in the FEF channels we observed phase clustering (Figure 5A) and sustained power above the rate of saccades (7–12 Hz) that extended into beta frequencies (13–30 Hz; Figure 5B). We noticed that both effects appear modulated by the eye movements, although the comparison was not statistically significant most likely due to our small sample. Next, we evaluated directional network interactions between the FEF and ASNs. Note we performed two analyses of directional network interactions – in one we computed connectivity between FEF and STG channels (127 pairs; Figure 5C); and a control analysis where we computed connectivity between FEF and all ASN channels (232 pairs; Figure S5). We focused on the STG channels because this ROI was present in all patients with FEF electrodes and because previous anatomy studies found that neurons in the FEF (particularly the rostral part of the FEF) project primarily to the STG34. It is however worth noting that the results are similar when we consider all auditory selective channels rather than STG only (Figure S5A).
Fixation-locked analyses.
Spectral phase and power were estimated on data segmented around image presentation (6 sec) with additional 2 seconds before and after image onset and offset to account for edge artifacts of filtering. We used 3 cycles wavelets for frequencies 1–30 Hz in steps of 1 Hz. The complex-valued time series was rectified and squared to extract power. All analysis of neural data during movie watching were performed in the same way as analysis of static images with the same parameters with the exception that an initial segmentation was performed relative to the first and last frame of the movie.
Broadband High-frequency Activity (BHA), was calculated for frequencies 70–150 Hz in 2 Hz steps using a sliding Hanning tapered window (150 ms) with 6 Hz spectral smoothing. The complex-valued signal was rectified and squared to extract power. Frequency dimension was averaged to create a single vector of BHA fluctuations. All analyses were performed on continuous signals before segmenting relative to fixation onset.
Subsequently, we identified time points of fixation onsets and re-segment field potential, time-frequency series and BHA relative to these events. We refer to these fixation-related segments as trials throughout the manuscript. BHA, complex-valued time-frequency series and raw field potentials were re-segmented into 1200 ms long windows with 600 ms before and 600 ms after fixation onset. For further analyses we only considered fixations that were at least +/−200ms. We defined epochs containing artifacts as those with the gradient of field potential exceeding 5 standard deviations of the trial mean. On average, about 1 % met this criterion and were removed from further analyses. The overall BHA analysis (Figure 2) compared the magnitude of BHA in an a priori pre- (−75:0 ms) and post-fixation onset window (0:75 ms). Because we observed that the dynamics of BHA differed across ROIs and that it peaked at different time points relative to fixation onset, when analyzing BHA across ROIs we took a different approach. Here, rather than using a fixed window we identified BHA peak and the width of the peak (i.e., distance between the points where the descending signal intercepts a half prominence horizontal reference line). This peak was identified on an ROI averaged BHA signal. Next, BHA magnitude was extracted in a time window around the peak (size defined by the width) and compared to a 100 ms long window after fixation onset. Apart from the OC neither ROI specific nor overall BHA showed a clear peak in the 100 ms post-fixation window (see Figure 3 and S3).
To explore the temporal profile of the BHA used Fast Fourier Transform to calculate power-spectra of single channel BHA across the entire epoch using multitaper frequency transformation with the Hanning window. To increase frequency resolution, we used padding of 4 sec. In control analyses we ensured that the results do not depend on the padding: we observed similar results with padding of different duration and with no padding at all. We then calculated the non-parametric Wilcoxon signed rank test between the mean power in 3–5 Hz (i.e., rate of saccades) and the mean power at frequencies around it (i.e., 1.75–2.75 and 5.25–6.25 Hz). The 3–5 Hz frequency was based on the average rate of visual exploration observed in our data.
Inter-trial phase coherence (ITC) was quantified at each time-frequency point. To this end, we used single trial (i.e., fixation locked) time-frequency series complex-valued signal and previously described formula75 with the following Matlab implementation:
Relation to findings from the macaque A1.
Our BHA findings may appear to conflict with a previous non-human primate study from our group27. To better understand similarities and differences between our studies we examined saccade-locked BHA in our data set. We focused on BHA in Heschel’s gyrus, a human homologue to monkey A1. Albeit not in the exact same window (−200 to −100 ms; p = 0.104; z = 1.626; N = 41), we replicated their findings it in a broader time window, with BHA before saccade onset (−200 to 0) showing higher values compared to the post-saccade onset window (0 to 200 ms; p = 0.025; z = 2.23; N = 41). While both studies report that saccades modulate excitability in the primary auditory cortex, O’Connell et al., found using saccade locked measures that multi-unit activity (MUA) in primary auditory cortex is increased −200 to −100 ms prior to saccade onset as compared to the period from 0–100 ms after saccade onset. Our study found that fixation-locked BHA is increased before fixation onset (−75–0 ms) as compared to the time after fixation onset (0–75 ms). In considering this difference, it is first important to note that in the O’Connell et al., the rhythm of saccades was likely constrained by the rhythm (isochronous) of visual stimulation (see their discussion), whereas in our study, subjects freely viewed natural scenes, at their own preferred pace; this paradigmatic difference by itself may be critical. Second, the difference in the time frame of effects across studies, if not due to a paradigmatic difference, may be explained by the different physiological origins of the BHA and MUA: MUA specifically indexes neuronal firing with a maximal amplitude in in Layer 4, while BHA reflects dendritic activity correlated with, but dissociable from neuronal firing, whose maximal generation site is in the superficial layers29. Additionally, while O’Connell et al., report only on data from A1, we studied activity at a number of auditory cortical sites including the HG. In doing so, we observed that the time course of BHA differed between primary (HG) and higher order (STG) auditory regions. Specifically, BHA peaked earlier and lasted longer in the HG, while it was transient and closer to fixation onset in the STG showing that the time-course of perisaccadic excitability modulation differs across lower and higher level auditory areas. BHA in other auditory selective sites in the FC, PC and IC although did not show detectable perisaccadic modulations they shared a basic morphology with the STG (i.e., a clear peak during saccades). Comparing BHA across ROIs we noted that BHA in the HG starts decreasing around 100 ms before fixation onset and this trend continues throughout the saccade and dips around 50 ms after fixation onset (see Figure S3F). This is the time when BHA in STG as well as FC, PC and IC starts increasing.
Phase Slope Index.
To calculate direction of information flux between FEF and auditory selective channels we used Phase Slope Index (PSI33). The PSI defines relation between two signals exploiting phase differences across the spectrum. To this end, we used the same preprocessing steps – segmented the data into 6 sec long epochs, band-stop filter to eliminate line noise, create bipolar reference montage to maximize spatial specificity and reduce common sources. Then, we used multitaper frequency transformation with 0.5 Hz frequency resolution on the data padded to 4 sec. Finally, we calculated PSI (with the bandwidth of 2 Hz; i.e., PSI is integrated across 4 frequency points) across all possible pairs of FEF (N = 8) and auditory (N = 53) channels in each of four patients with paired recordings (total number of pairs N = 127). The parameters for spectral smoothing and PSI bandwidth were derived from a simulation study, where we designed two signals one leading the other in the frequency ranges where we expected to observe directional connectivity (i.e., alpha and beta; see simulation study in Supplemental Information). Because PSI is a signed quantity (i.e., positive PSI in the current study means FEF is leading, while negative PSI means STG is leading), the null hypothesis is that PSI scores are drawn from a zero mean distribution. To test for significance, we used non-parametric Wilcoxon sign rank test with the null hypothesis that the PSI comes from a distribution whose median is zero (N = 127 paired recordings; corrected for multiple comparisons across time and frequency). Note that PSI detects non-zero delays thus being insensitive to volume conduction.
PSI integration window: a simulation study.
PSI requires calculating a slope across multiple frequencies. Several possible frequency windows may be considered. We run simulations to identify an optimal bandwidth across which the slope should be integrated given frequencies where we hypothesized our effects to be strongest. To this end, we generated two signals (1 sec long sampled at 500 Hz) in a way that one is a copy of the other shifted in time by 50 milliseconds. This temporal lag is within the physiological range of excitability modulations from the FEF to sensory system76. Because the highest frequency range in which we expected network interactions between FEF-ASNs is in the beta range (e.g., 13–17 Hz57) we created oscillations that were centered at this frequency range. We added Gaussian noise to each of these signals and repeated this procedure 100 times to approximate 100 trials. Next, we calculated PSI as described above. To identify optimal bandwidth for the PSI we systematically explored the bandwidth frequency window from 1 to 10 Hz. As expected we noted a trade-off between the window size and frequency precision. We also observed there was no difference in the estimated PSI magnitude for windows over 2–3 Hz (see Figure S5C). However, their frequency resolution and accuracy of frequency estimation was gradually decreasing. To optimize the trade-off between window size and frequency resolution we selected window size of 2 Hz (i.e., 4 frequency points at 0.5 Hz frequency resolution). This selection was also confirmed in another simulation in which we created similar signals with the same lag. However, now we introduced a multiplexed connectivity pattern between these two signals57 - signal 1 was leading in theta (3–7 Hz) and lagging in beta frequency (13–17 Hz; Figure S5D). Altogether, these simulations convinced us that a frequency window of 2 Hz (i.e., 4 frequency points) may be an optimal for the purpose of testing the current hypothesis. It is worth noting that another study found the same bandwidth to be optimal for studying connectivity in a similar frequency range77. Finally, to further ensure that our main results do not depend on a specific bandwidth parameter we re-calculate the PSI between FEF and STG with the bandwidth of 6 Hz (i.e., 12 frequency points). This analysis reproduced all our main effects and conclusions (Figure S5B).
PSI stratified on BHA change in STG.
We propose that top-down signals from the FEF influence local neural activity in the STG. Specifically, we suggest that this top-down signal enhances local neural excitability (as indexed by BHA) towards the end of fixation and during saccades. To further explore this relationship between the local modulations and the functional connectivity, we calculated FEF-STG connectivity separately for trials with differing strength of local modulations. We concentrated on the time epoch centered at the saccade where we expected the effect of local BHA in STG and top-down interaction to be strongest. We reasoned that stronger local BHA could be associated with increased FEF-STG connectivity profile. Specifically, we calculated PSI for two groups of trials (low BHA trials; lowest quartile of BHA modulation in STG and high BHA trials; highest quartile of BHA modulation in STG). These quartiles were defined for each STG electrode that entered into the FEF-STG connectivity analysis. Next, we calculated PSI separately for these high- and low- BHA trial groups. We found no difference between these two groups in lower frequencies (<20 Hz). Importantly, we observed a stronger top-down direction of interaction in the high-BHA group compared to the low-BHA group limited to a higher beta range (i.e., 24–28 Hz) centered at 25 Hz (see Figure S5E). One concern here is that we split epochs into high- and low- BHA groups based on BHA power. Although differences in power do not necessarily lead to spurious differences in phase-based measures, one may nevertheless think that this difference in BHA power spills over to lower frequencies including beta frequency range. An important feature of the current finding which mitigates this concern is that the PSI difference between high-BHA and low-BHA groups is limited to the beta range and fades with frequency (i.e., no detectable difference is observed above 26 Hz). This is precisely opposite to what one would expect from a spurious difference due to BHA power difference leaking into lower frequencies. Altogether these analyses support our interpretation that the local BHA in STG is associated with top-down interactions from the FEF to STG.
Eye tracking data acquisition and processing.
Eye tracking data were recorded simultaneously with iEEG data. We tracked horizontal and vertical movements of each patient’s left and right eye with a Tobii TX300 eye tracker sampled at 300 Hz. The eye tracker was calibrated by collecting data gaze fixations from five known target points. After the calibration sequence the calibration output was inspected. The calibration output was examined for two features. The calibration points that were either without data or that showed dispersed gaze points scattered around the calibration point were re-calibrated. After calibration was successful, the operator initiated an experiment. Calibration was performed separately for free viewing of static images and for each of the movies. To estimate time-points of fixations and saccades, the position of the eye in x and y coordinates, were transformed into velocities. Velocities exceeding a threshold of 6 times the standard deviation of the velocity distribution for the duration of 12 ms were defined as saccades78. The time points of each fixation were further used to analyze perisaccadic field potentials.
QUANTIFICATION AND STATISTICAL ANALYSIS
We used non-parametric Wilcoxon sign rank test to compare the magnitude spectra phase coherence and power, ERPs and BHA in time windows before and after fixation onset. The exact duration of time the window is specified for each analysis in the main text and in figure legends. To test for differences across ROIs we used non-parametric Wilcoxon rank sum test. Unless stated differently, we used Benjamini & Hochberg/Yekutieli false discovery rate procedure to control for multiple comparisons79. Throughout, bipolar-referenced channels (for local analyses) and channel pairs (for connectivity analyses) are denoted by a capital N. Star symbols in figures indicate p-values: *, **, *** signifies p < 0.05, 0.01, 0.005, respectively (see figure captions).
Supplementary Material
Highlights.
During natural viewing saccades modulate neural excitability in the auditory system
Temporal pattern of this modulation is unique to auditory areas
Temporal pattern in the auditory areas is complementary to that seen in visual system
Modulations may arise from bi-directional connectivity with areas generating saccades
Acknowledgments
Funding: ML, SB and CES are supported by a Silvio O. Conte Center Grant P50 MH109429, and by R01 DC012947.
Footnotes
Declarations of interest
The authors declare no competing interests.
Publisher's Disclaimer: This is a PDF file of an unedited manuscript that has been accepted for publication. As a service to our customers we are providing this early version of the manuscript. The manuscript will undergo copyediting, typesetting, and review of the resulting proof before it is published in its final form. Please note that during the production process errors may be discovered which could affect the content, and all legal disclaimers that apply to the journal pertain.
References
- 1.Yarbus AL (1967). Eye Movements During Perception of Complex Objects. In Eye Movements and Vision 10.1007/978-1-4899-5379-7_8. [DOI] [Google Scholar]
- 2.Purpura KP, Kalik SF, and Schiff ND (2003). Analysis of Perisaccadic Field Potentials in the Occipitotemporal Pathway during Active Vision. Journal of Neurophysiology 90, 3455–3478. 10.1152/jn.00011.2003. [DOI] [PubMed] [Google Scholar]
- 3.Bartlett AM, Ovaysikia S, Logothetis NK, and Hoffman KL (2011). Saccades during Object Viewing Modulate Oscillatory Phase in the Superior Temporal Sulcus. Journal of Neuroscience 31, 18423–18432. 10.1523/JNEUROSCI.4102-11.2011. [DOI] [PMC free article] [PubMed] [Google Scholar]
- 4.Hamamé CM, Vidal JR, Perrone-Bertolotti M, Ossandón T, Jerbi K, Kahane P, Bertrand O, and Lachaux JP (2014). Functional selectivity in the human occipitotemporal cortex during natural vision: Evidence from combined intracranial EEG and eye-tracking. NeuroImage 95, 276–286. 10.1016/j.neuroimage.2014.03.025. [DOI] [PubMed] [Google Scholar]
- 5.Lee D, and Malpeli JG (1998). Effects of saccades on the activity of neurons in the cat lateral geniculate nucleus. Journal of Neurophysiology 79, 922–936. 10.1152/jn.1998.79.2.922. [DOI] [PubMed] [Google Scholar]
- 6.Reppas JB, Usrey WM, and Reid RC (2002). Saccadic eye movements modulate visual responses in the lateral geniculate nucleus. Neuron 35, 961–974. 10.1016/S0896-6273(02)00823-1. [DOI] [PubMed] [Google Scholar]
- 7.Rajkai C, Lakatos P, Chen CM, Pincze Z, Karmos G, and Schroeder CE (2008). Transient cortical excitation at the onset of visual fixation. Cerebral Cortex 18, 200–209. 10.1093/cercor/bhm046. [DOI] [PubMed] [Google Scholar]
- 8.Zanos TP, Mineault PJ, Nasiotis KT, Guitton D, and Pack CC (2015). A Sensorimotor Role for Traveling Waves in Primate Article A Sensorimotor Role for Traveling Waves in Primate Visual Cortex. Neuron 85, 615–627. 10.1016/j.neuron.2014.12.043. [DOI] [PubMed] [Google Scholar]
- 9.Zanos TP, Mineault PJ, Guitton D, and Pack CC (2016). Mechanisms of Saccadic Suppression in Primate Cortical Area V4. Journal of Neuroscience 36, 9227–9239. 10.1523/JNEUROSCI.1015-16.2016. [DOI] [PMC free article] [PubMed] [Google Scholar]
- 10.Hoffman KL, Dragan MC, Leonard TK, Micheli C, Montefusco-Siegmund R, and Valiante TA (2013). Saccades during visual exploration align hippocampal 3–8 Hz rhythms in human and non-human primates. Frontiers in Systems Neuroscience 7. 10.3389/fnsys.2013.00043. [DOI] [PMC free article] [PubMed] [Google Scholar]
- 11.Jutras MJ, Fries P, and Buffalo EA (2013). Oscillatory activity in the monkey hippocampus during visual exploration and memory formation. Proceedings of the National Academy of Sciences of the United States of America 110, 13144–13149. 10.1073/pnas.1302351110. [DOI] [PMC free article] [PubMed] [Google Scholar]
- 12.Staudigl T, Leszczynski M, Jacobs J, Sheth SA, Schroeder CE, Jensen O, and Doeller CF (2018). Hexadirectional Modulation of High-Frequency Electrophysiological Activity in the Human Anterior Medial Temporal Lobe Maps Visual Space. Current Biology 28, 3325–3329. 10.1016/j.cub.2018.09.035. [DOI] [PubMed] [Google Scholar]
- 13.Ringo JL, Sobotka S, Diltz MD, and Bunce CM (1994). Eye movements modulate activity in hippocampal, parahippocampal, and inferotemporal neurons. Journal of Neurophysiology 71, 1285–1288. 10.1152/jn.1994.71.3.1285. [DOI] [PubMed] [Google Scholar]
- 14.McFarland JM, Bondy AG, Saunders RC, Cumming BG, and Butts DA (2015). Saccadic modulation of stimulus processing in primary visual cortex. Nature Communications 6, 1–14. 10.1038/ncomms9110. [DOI] [PMC free article] [PubMed] [Google Scholar]
- 15.Barczak A, Haegens S, Ross DA, McGinnis T, Lakatos P, and Schroeder CE (2019). Dynamic Modulation of Cortical Excitability during Visual Active Sensing. Cell Reports 27, 3447–3459. 10.1016/j.celrep.2019.05.072. [DOI] [PMC free article] [PubMed] [Google Scholar]
- 16.Sommer MA, and Wurtz RH (2008). Brain circuits for the internal monitoring of movements. Annual Review of Neuroscience 31, 317–338. 10.1146/annurev.neuro.31.060407.125627. [DOI] [PMC free article] [PubMed] [Google Scholar]
- 17.Ahissar E, and Arieli A (2001). Figuring space by time. Neuron 32, 185–201. 10.1016/S0896-6273(01)00466-4. [DOI] [PubMed] [Google Scholar]
- 18.Leszczynski M, and Schroeder CE (2019). The Role of Neuronal Oscillations in Visual Active Sensing. Frontiers in Integrative Neuroscience 32. 10.3389/fnint.2019.00032. [DOI] [PMC free article] [PubMed] [Google Scholar]
- 19.Kleinfeld D, Ahissar E, and Diamond ME (2006). Active sensation: insights from the rodent vibrissa sensorimotor system. Current Opinion in Neurobiology 16, 435–444. 10.1016/j.conb.2006.06.009. [DOI] [PubMed] [Google Scholar]
- 20.Bruce CJ, and Goldberg ME (1985). Primate frontal eye fields. I. Single neurons discharging before saccades. Journal of neurophysiology 53, 603–635. [DOI] [PubMed] [Google Scholar]
- 21.Moore T, and Armstrong KM (2003). Selective gating of visual signals by microstimulation of frontal cortex. Nature 421, 370–373. [DOI] [PubMed] [Google Scholar]
- 22.Gregoriou GG, Gotts SJ, Zhou H, and Desimone R (2009). High-frequency, long-range coupling between prefrontal and visual cortex during attention. science 324, 1207–1210. [DOI] [PMC free article] [PubMed] [Google Scholar]
- 23.Groh JM, Trause AS, Underhill AM, Clark KR, and Inati S (2001). Eye position influences auditory responses in primate inferior colliculus. Neuron 29, 509–518. [DOI] [PubMed] [Google Scholar]
- 24.Werner-Reiss U, Kelly KA, Trause AS, Underhill AM, and Groh JM (2003). Eye position affects activity in primary auditory cortex of primates. Current Biology 13, 554–562. [DOI] [PubMed] [Google Scholar]
- 25.Fu K-MG, Johnston TA, Shah AS, Arnold L, Smiley J, Hackett TA, Garraghty PE, and Schroeder CE (2003). Auditory cortical neurons respond to somatosensory stimulation. Journal of Neuroscience 23, 7510–7515. [DOI] [PMC free article] [PubMed] [Google Scholar]
- 26.Leszczynski M, Chaieb L, Staudigl T, Enkirch SJ, Fell J, and Schroeder CE (2021). Neural activity in the human anterior thalamus during natural vision. Scientific Reports 11, 1–13. [DOI] [PMC free article] [PubMed] [Google Scholar]
- 27.O’Connell MN, Barczak A, McGinnis T, Mackin K, Mowery T, Schroeder CE, and Lakatos P (2020). The role of motor and environmental visual rhythms in structuring auditory cortical excitability. Iscience 23, 101374. [DOI] [PMC free article] [PubMed] [Google Scholar]
- 28.Gruters KG, Murphy DLK, Jenson CD, Smith DW, Shera CA, and Groh JM (2018). The eardrums move when the eyes move: A multisensory effect on the mechanics of hearing. Proceedings of the National Academy of Sciences 115, E1309–E1318. [DOI] [PMC free article] [PubMed] [Google Scholar]
- 29.Leszczyński M, Barczak A, Kajikawa Y, Ulbert I, Falchier AY, Tal I, Haegens S, Melloni L, Knight RT, and Schroeder CE (2020). Dissociation of broadband high-frequency activity and neuronal firing in the neocortex. Science Advances 6, eabb0977. 10.1126/sciadv.abb0977. [DOI] [PMC free article] [PubMed] [Google Scholar]
- 30.Yuval-Greenberg S, Tomer O, Keren AS, Nelken I, and Deouell LY (2008). Transient induced gamma-band response in EEG as a manifestation of miniature saccades. Neuron 58, 429–441. [DOI] [PubMed] [Google Scholar]
- 31.Schroeder CE, Lakatos P, Kajikawa Y, Partan S, and Puce A (2008). Neuronal oscillations and visual amplification of speech. Trends in cognitive sciences 12, 106–113. [DOI] [PMC free article] [PubMed] [Google Scholar]
- 32.Tzourio N, El Massioui F, Crivello F, Joliot M, Renault B, and Mazoyer B (1997). Functional anatomy of human auditory attention studied with PET. Neuroimage 5, 63–77. [DOI] [PubMed] [Google Scholar]
- 33.Nolte G, Ziehe A, Nikulin VV, Schlögl A, Krämer N, Brismar T, and Müller K-R (2008). Robustly estimating the flow direction of information in complex physical systems. Physical review letters 100, 234101. [DOI] [PubMed] [Google Scholar]
- 34.Barbas H, and Mesulam M (1981). Organization of afferent input to subdivisions of area 8 in the rhesus monkey. Journal of Comparative Neurology 200, 407–431. [DOI] [PubMed] [Google Scholar]
- 35.Niell CM, and Stryker MP (2010). Modulation of visual responses by behavioral state in mouse visual cortex. Neuron 65, 472–479. [DOI] [PMC free article] [PubMed] [Google Scholar]
- 36.Keller GB, Bonhoeffer T, and Hübener M (2012). Sensorimotor mismatch signals in primary visual cortex of the behaving mouse. Neuron 74, 809–815. [DOI] [PubMed] [Google Scholar]
- 37.Stringer C, Pachitariu M, Steinmetz N, Reddy CB, Carandini M, and Harris KD (2019). Spontaneous behaviors drive multidimensional, brainwide activity. Science 364, eaav7893. [DOI] [PMC free article] [PubMed] [Google Scholar]
- 38.Burr DC, Morrone MC, and Ross J (1994). Selective suppression of the magnocellular visual pathway during saccadic eye movements. Nature 371, 511–513. [DOI] [PubMed] [Google Scholar]
- 39.Jones B, and Kabanoff B (1975). Eye movements in auditory space perception. Perception & Psychophysics 17, 241–245. [Google Scholar]
- 40.Rorden C, and Driver J (1999). Does auditory attention shift in the direction of an upcoming saccade? Neuropsychologia 37, 357–377. [DOI] [PubMed] [Google Scholar]
- 41.Després O, Candas V, and Dufour A (2005). Spatial auditory compensation in early-blind humans: involvement of eye movements and/or attention orienting? Neuropsychologia 43, 1955–1962. [DOI] [PubMed] [Google Scholar]
- 42.Fiebelkorn IC, Pinsk MA, and Kastner S (2018). A dynamic interplay within the frontoparietal network underlies rhythmic spatial attention. Neuron 99, 842–853. [DOI] [PMC free article] [PubMed] [Google Scholar]
- 43.Mathewson KE, Gratton G, Fabiani M, Beck DM, and Ro T (2009). To see or not to see: prestimulus α phase predicts visual awareness. Journal of Neuroscience 29, 2725–2732. [DOI] [PMC free article] [PubMed] [Google Scholar]
- 44.Fiebelkorn IC, Saalmann YB, and Kastner S (2013). Rhythmic sampling within and between objects despite sustained attention at a cued location. Current Biology 23, 2553–2558. [DOI] [PMC free article] [PubMed] [Google Scholar]
- 45.Ho HT, Leung J, Burr DC, Alais D, and Morrone MC (2017). Auditory sensitivity and decision criteria oscillate at different frequencies separately for the two ears. Current Biology 27, 3643–3649. [DOI] [PubMed] [Google Scholar]
- 46.Tal I, Leszczynski M, Mesgarani N, and Schroeder CE (2020). Does the phase of ongoing EEG oscillations predict auditory perception? bioRxiv. 10.1101/2020.07.17.209387. [DOI] [Google Scholar]
- 47.Diamond MR, Ross J, and Morrone MC (2000). Extraretinal control of saccadic suppression. Journal of Neuroscience 20, 3449–3455. [DOI] [PMC free article] [PubMed] [Google Scholar]
- 48.Zuber B, and Stark L (1966). Saccadic suppression: elevation of visual threshold associated with saccadic eye movements. Experimental neurology 16, 65–79. [DOI] [PubMed] [Google Scholar]
- 49.Beeler GW Jr (1967). Visual threshold changes resulting from spontaneous saccadic eye movements. Vision research 7, 769–775. [DOI] [PubMed] [Google Scholar]
- 50.Ibbotson MR, Crowder NA, Cloherty SL, Price NS, and Mustari MJ (2008). Saccadic modulation of neural responses: possible roles in saccadic suppression, enhancement, and time compression. Journal of Neuroscience 28, 10952–10960. [DOI] [PMC free article] [PubMed] [Google Scholar]
- 51.Bremmer F, Kubischik M, Hoffmann K-P, and Krekelberg B (2009). Neural dynamics of saccadic suppression. Journal of Neuroscience 29, 12374–12383. [DOI] [PMC free article] [PubMed] [Google Scholar]
- 52.Gherri E, Driver J, and Eimer M (2008). Eye movement preparation causes spatially-specific modulation of auditory processing: new evidence from event-related brain potentials. Brain research 1224, 88–101. [DOI] [PMC free article] [PubMed] [Google Scholar]
- 53.Honda H (2018). Eye movements to a visual stimulus flashed before, during, or after a saccade. In Attention and performance XIII (Psychology Press; ), pp. 567–582. [Google Scholar]
- 54.Honda H (1991). The time courses of visual mislocalization and of extraretinal eye position signals at the time of vertical saccades. Vision research 31, 1915–1921. [DOI] [PubMed] [Google Scholar]
- 55.Ross J, Morrone MC, and Burr DC (1997). Compression of visual space before saccades. Nature 386, 598–601. [DOI] [PubMed] [Google Scholar]
- 56.Morillon B, Schroeder CE, and Wyart V (2014). Motor contributions to the temporal precision of auditory attention. Nature communications 5, 1–9. [DOI] [PMC free article] [PubMed] [Google Scholar]
- 57.Morillon B, and Baillet S (2017). Motor origin of temporal predictions in auditory attention. Proceedings of the National Academy of Sciences 114, E8913–E8921. 10.1073/pnas.1705373114. [DOI] [PMC free article] [PubMed] [Google Scholar]
- 58.Abbasi O, and Gross J (2020). Beta-band oscillations play an essential role in motor–auditory interactions. Human brain mapping 41, 656–665. [DOI] [PMC free article] [PubMed] [Google Scholar]
- 59.Sommer MA, and Wurtz RH (2002). A pathway in primate brain for internal monitoring of movements. Science 296, 1480–1482. 10.1126/science.1069590. [DOI] [PubMed] [Google Scholar]
- 60.Ghazanfar AA, and Schroeder CE (2006). Is neocortex essentially multisensory? Trends in cognitive sciences 10, 278–285. [DOI] [PubMed] [Google Scholar]
- 61.Winkowski DE, and Knudsen EI (2006). Top-down gain control of the auditory space map by gaze control circuitry in the barn owl. Nature 439, 336–339. [DOI] [PMC free article] [PubMed] [Google Scholar]
- 62.Zheng J, Stevenson RF, Mander BA, Mnatsakanyan L, Hsu FPK, Vadera S, Knight RT, Yassa MA, and Lin JJ (2019). Multiplexing of theta and alpha rhythms in the amygdala-hippocampal circuit supports pattern separation of emotional information. Neuron 102, 887–898. [DOI] [PMC free article] [PubMed] [Google Scholar]
- 63.Brincat SL, and Miller EK (2015). Frequency-specific hippocampal-prefrontal interactions during associative learning. Nature neuroscience 18, 576–581. [DOI] [PMC free article] [PubMed] [Google Scholar]
- 64.Bastos AM, Vezoli J, Bosman CA, Schoffelen J-M, Oostenveld R, Dowdall JR, De Weerd P, Kennedy H, and Fries P (2015). Visual areas exert feedforward and feedback influences through distinct frequency channels. Neuron 85, 390–401. [DOI] [PubMed] [Google Scholar]
- 65.Michalareas G, Vezoli J, Van Pelt S, Schoffelen J-M, Kennedy H, and Fries P (2016). Alpha-beta and gamma rhythms subserve feedback and feedforward influences among human visual cortical areas. Neuron 89, 384–397. [DOI] [PMC free article] [PubMed] [Google Scholar]
- 66.Maldonado P, Babul C, Singer W, Rodriguez E, Berger D, and Grun S (2008). Synchronization of neuronal responses in primary visual cortex of monkeys viewing natural images. Journal of neurophysiology 100, 1523–1532. [DOI] [PubMed] [Google Scholar]
- 67.Ito J, Maldonado P, Singer W, and Gr??n S. (2011). Saccade-related modulations of neuronal excitability support synchrony of visually elicited spikes. Cerebral Cortex 21, 2482–2497. 10.1093/cercor/bhr020. [DOI] [PMC free article] [PubMed] [Google Scholar]
- 68.Khalighinejad B, Patel P, Herrero JL, Bickel S, Mehta AD, and Mesgarani N (2021). Functional characterization of human Heschl’s gyrus in response to natural speech. NeuroImage 235, 118003. [DOI] [PMC free article] [PubMed] [Google Scholar]
- 69.Jerbi K, Freyermuth S, Dalal S, Kahane P, Bertrand O, Berthoz A, and Lachaux JP (2009). Saccade related gamma-band activity in intracerebral EEG: Dissociating neural from ocular muscle activity. Brain Topography 22, 18–23. 10.1007/s10548-009-0078-5. [DOI] [PubMed] [Google Scholar]
- 70.Kovach CK, Tsuchiya N, Kawasaki H, Oya H, Howard MA, and Adolphs R (2011). Manifestation of ocular-muscle EMG contamination in human intracranial recordings. NeuroImage 54, 213–233. 10.1016/j.neuroimage.2010.08.002. [DOI] [PMC free article] [PubMed] [Google Scholar]
- 71.Falchier A, Clavagnier S, Barone P, and Kennedy H (2002). Anatomical evidence of multimodal integration in primate striate cortex. Journal of Neuroscience 22, 5749–5759. [DOI] [PMC free article] [PubMed] [Google Scholar]
- 72.Falchier A, Schroeder CE, Hackett TA, Lakatos P, Nascimento-Silva S, Ulbert I, Karmos G, and Smiley JF (2010). Projection from visual areas V2 and prostriata to caudal auditory cortex in the monkey. Cerebral cortex 20, 1529–1538. [DOI] [PMC free article] [PubMed] [Google Scholar]
- 73.Banks MI, Uhlrich DJ, Smith PH, Krause BM, and Manning KA (2011). Descending projections from extrastriate visual cortex modulate responses of cells in primary auditory cortex. Cerebral Cortex 21, 2620–2638. [DOI] [PMC free article] [PubMed] [Google Scholar]
- 74.Vernet M, Quentin R, Chanes L, Mitsumasu A, and Valero-Cabré A (2014). Frontal eye field, where art thou? Anatomy, function, and non-invasive manipulation of frontal regions involved in eye movements and associated cognitive operations. Frontiers in integrative neuroscience 8, 66. [DOI] [PMC free article] [PubMed] [Google Scholar]
- 75.Lachaux JP, Rodriguez E, Martinerie J, and Varela FJ (1999). Measuring phase synchrony in brain signals. Human brain mapping 8, 194–208. . [DOI] [PMC free article] [PubMed] [Google Scholar]
- 76.Veniero D, Gross J, Morand S, Duecker F, Sack AT, and Thut G (2021). Top-down control of visual cortex by the frontal eye fields through oscillatory realignment. Nature communications 12, 1–13. [DOI] [PMC free article] [PubMed] [Google Scholar]
- 77.Jiang H, Bahramisharif A, van Gerven MA, and Jensen O (2015). Measuring directionality between neuronal oscillations of different frequencies. Neuroimage 118, 359–367. [DOI] [PubMed] [Google Scholar]
- 78.Engbert R, and Kliegl R (2003). Microsaccades uncover the orientation of covert attention. Vision Research 43, 1035–1045. 10.1016/S0042-6989(03)00084-1. [DOI] [PubMed] [Google Scholar]
- 79.Benjamini Y, and Yekutieli D (2001). The control of the false discovery rate in multiple testing under dependency. Annals of Statistics 29, 1165–1188. 10.1214/aos/1013699998. [DOI] [Google Scholar]
- 80.Brainard DH, & Vision S (1997). The psychophysics toolbox. Spatial vision, 10(4), 433–436. [PubMed] [Google Scholar]
- 81.Groppe DM, Bickel S, Dykstra AR, Wang X, Mégevand P, Mercier MR, … & Honey CJ. (2017). iELVis: An open source MATLAB toolbox for localizing and visualizing human intracranial electrode data. Journal of neuroscience methods, 281, 40–48. [DOI] [PubMed] [Google Scholar]
Associated Data
This section collects any data citations, data availability statements, or supplementary materials included in this article.
Supplementary Materials
Data Availability Statement
All data needed to evaluate the conclusions in the manuscript are present in the paper and supplement. Additional data available from authors upon request. This paper does not report original code.