PLOS One logoLink to PLOS One
. 2023 Aug 14;18(8):e0290078. doi: 10.1371/journal.pone.0290078

Differential effect of heteronymous feedback from femoral nerve and quadriceps muscle stimulation onto soleus H-reflex

Cristian Cuadra 1,2, Steven L Wolf 1,3, Mark A Lyle 1,*
Editor: Tomoyoshi Komiyama4
PMCID: PMC10424854  PMID: 37578948

Abstract

Excitatory feedback from muscle spindles, and inhibitory feedback from Golgi tendon organs and recurrent inhibitory circuits are widely distributed within the spinal cord to modulate activity between human lower limb muscles. Heteronymous feedback is most commonly studied in humans by stimulating peripheral nerves, but the unique effect of non-spindle heteronymous feedback is difficult to determine due to the lower threshold of excitatory spindle axons. A few studies suggest stimulation of the muscle belly preferentially elicits non-spindle heteronymous feedback. However, there remains a lack of consensus on the differential effect of nerve and muscle stimulation onto the H-reflex, and the relation of the heteronymous effects onto H-reflex compared to that onto ongoing EMG has not been determined. In this cross-sectional study, we compared excitatory and inhibitory effects from femoral nerve and quadriceps muscle belly stimulation onto soleus H-reflex size in 15 able-bodied participants and in a subset also compared heteronymous effects onto ongoing soleus EMG at 10% and 20% max. Femoral nerve stimulation elicited greater excitation of the H-reflex compared to quadriceps stimulation. The differential effect was also observed onto ongoing soleus EMG at 20% max but not 10%. Femoral nerve and quadriceps stimulation elicited similar inhibition of the soleus H-reflexes, and these results were better associated with soleus EMG at 20%. The results support surface quadriceps muscles stimulation as a method to preferentially study heteronymous inhibition at least in healthy adults. The primary benefit of using muscle stimulation is expected to be in persons with abnormal, prolonged heteronymous excitation. These data further suggest heteronymous feedback should be evaluated with H-reflex or onto ongoing EMG of at least 20% max to identify group differences or modulation of heteronymous feedback in response to treatment or task.

Introduction

Proprioceptive feedback from human lower limb muscles have widespread excitatory and inhibitory heteronymous spinal projections within the spinal cord that influence motor output of muscles throughout the limb, even those spanning different joints [17]. The ability of heteronymous connections to influence motor output of distant muscles suggests a functional role in facilitating interjoint coordination (i.e., neural linkages) [8, 9]. Identifying the relative strength and distribution of excitatory feedback from muscle spindles and inhibitory feedback, which arise primarily from Golgi tendon organs and recurrent motoneuron collaterals, is important for understanding the functional role of heteronymous circuits in normal and impaired movement. However, the unique role of inhibitory circuits is currently difficult to study in isolation between many muscles because peripheral nerve stimulation, the most widely used approach in animals and humans, evokes heteronymous monosynaptic excitation prior to inhibition due to the lower threshold of muscle spindle axons to stimulation when compared to Golgi tendon and motor axons [1, 5, 6, 10, 11]. Thus, alternative methods that can preferentially elicit heteronymous inhibitory feedback from Ib afferents or antidromic activation of motoneuron recurrent collaterals could provide new knowledge about the unique role of inhibitory feedback.

Stimulation of the muscle belly with surface electrodes or intramuscular fine wire elicits heteronymous inhibitory effects (e.g. -Golgi tendon organ and recurrent inhibition) with reduced or absent heteronymous muscle spindle excitation in animals [12, 13] and humans [3, 12, 14]. Of most relevance to the current study, Meunier et al. [14] found that stimulating the vastus lateralis motor point resulted in a much smaller increase in soleus motor unit firing probability compared to femoral nerve stimulation. Stimulation of the quadriceps muscle belly with surface electrodes similarly evoked inhibition of ongoing soleus EMG with similar onset, magnitude, and duration but with much reduced heteronymous excitation when compared to femoral nerve (FN) stimulation [3]. In contrast, Barbeau et al. [15] reported that vastus lateralis motor point stimulation elicited a facilitation of the SOL H-reflex of the same magnitude as femoral nerve stimulation. These findings support further evaluation to examine whether there are differential effects of stimulating the femoral nerve compared to stimulating the quadriceps muscle belly over motor points (referred to as muscle stimulation for the remainder of the text) onto soleus H-reflex or ongoing EMG. This clarification is necessary for examining whether impairments in inhibitory heteronymous feedback are present in patient populations exhibiting exaggerated heteronymous excitation of the soleus H-reflex that may mask the true magnitude of heteronymous inhibition, such as reported in persons with stroke [16, 17].

The purpose of this study was to compare heteronymous excitation and inhibition elicited by femoral nerve and quadriceps muscle stimulation onto the soleus H-reflex in healthy adults. We hypothesize that femoral nerve stimulation, but not quadriceps muscle stimulation, will elicit an increase in soleus H-reflex size when spindle afferent volleys from tibial nerve and femoral nerve stimulation are timed to reach the spinal cord concurrently. We also predict that the magnitude of heteronymous inhibition from femoral nerve and quadriceps muscle stimulation onto soleus H-reflex will be similar. A secondary aim was to compare the heteronymous excitatory and inhibitory effects from femoral nerve and quadriceps muscle stimulation onto ongoing soleus EMG when targeting 10% and 20% of maximal effort in a subset of participants. The motivation to compare the two background SOL EMG intensities is to determine if heteronymous feedback onto ongoing SOL EMG of 10% (i.e., low relative physical effort) can achieve equivalent effects since persons with significant motor impairments may have difficulty consistently holding the 20% EMG effort. Lastly, we examined the correlation between heteronymous excitation and inhibition from femoral nerve and quadriceps muscle stimulation onto the SOL H-reflex and ongoing EMG. We hypothesize heteronymous effects examined from femoral nerve and quadriceps stimulation onto soleus H-reflex will be strongly correlated with heteronymous effects observed onto ongoing SOL EMG.

Materials and methods

Fifteen healthy participants (7 males and 8 females, age between 20 to 31 years) with no recent history of lower limb injury or neuromotor disorder participated in this study during 2021. Participants provided written informed consent in accordance with procedures approved by the Emory University Institutional Review Board. Sample size was justified based on pilot data and literature using femoral nerve stimulation [16] suggesting moderate effect sizes. Thus, fourteen participants were found to achieve >83% power to detect a difference of ~5% between nerve and muscle stimulation intensity conditions.

Equipment

All data were acquired at 2000 Hz using an MP150 acquisition unit (Biopac Systems Inc, Goleta, CA, USA). Surface electromyography (EMG) was recorded from soleus (SOL) and vastus lateralis (VL) muscles with a pair of Ag-AgCl electrodes (2.2 × 3.5 cm; Vermed, Buffalo, NY, USA). Skin was first gently abraded and cleaned with isopropyl alcohol. SOL electrodes were then positioned in the midline of the posterior aspect of the shank just below the gastrocnemius muscle. VL electrodes were positioned on the distal third of the muscle (Fig 1). EMG signals were amplified, and hardware filtered from 10–1000 Hz (AMT-8, Bortec Biomedical Ltd, Canada). Nerve and muscle stimulation was completed with STM100C stimulators (Biopac System Inc, CA, USA).

Fig 1. Schematic of the electrode positioning, and example H-reflex and ongoing EMG waveforms from conditioning trials.

Fig 1

A Shown is the positioning of stimulation and recording electrodes on the left thigh (superior view). The FN cathode electrode is shown on the schematic but the rectangular anode electrode positioned on the posterior buttock is not shown. The dotted rectangles on the thigh correspond to the Q stimulation electrodes. B Example waveforms showing control and conditioned H-reflex sizes when FN (top row) was stimulated 6 ms after the tibial nerve (-6, excitatory; left trace) and when FN was stimulated 20 ms prior to tibial nerve (20 ms, inhibitory, right trace). The second row are example control and Q conditioned waveforms (note the Q doublet stimuli were applied 2.5 ms before/after that of FN (i.e. left trace -3.5 and -8.5 ms). All waveforms are the average of 20 trials. C Rectified soleus EMG traces (average of 20 trials) from a participant illustrating the heteronymous excitatory and inhibitory effects from femoral nerve (green trace) and quadriceps stimulation (red trace) onto ongoing SOL EMG. The mean background SOL EMG is displayed as the horizontal solid black line, and the dashed horizontal lines represent 1SD above and below the mean. The vertical dashed line at time 0 reflects stimulation timing for FN, whereas the Q stimulation doublet stimuli was at -2.5 and 2.5 ms. The second vertical dashed line represents the period prior to neural effects; note the presence of a Q stimulation artifact just before/after time 0 and two stimulation artifact harmonics that end prior to 18 ms post-stimulus.

Experimental procedures

Participants sat on a dynamometer chair (Humac Norm, CSMI, Inc, Worcester, MA) with the knee and hip flexed at 40° and 60°, respectively. The dynamometer axis of rotation was aligned with the knee joint and a dynamometer pad was firmly positioned against the distal tibia. An ankle immobilizer boot (United Orthopedics, ROM Walker, Fort Wayne, IN, USA) was positioned on their left lower leg. The immobilizer boot stabilized the ankle in a neutral position. The trunk was stabilized using the dynamometer straps.

Maximal voluntary isometric contractions

To record maximal SOL EMG, participants were asked to maximally plantarflex focusing on the ankle to minimize knee muscle activity. Participants completed three maximal effort isometric contraction (MVIC) trials of 5 s duration. Verbal encouragement and SOL EMG feedback were provided to facilitate best effort. The SOL EMG was bandpass filtered 10–500 Hz, rectified and a 200 ms moving average was used to identify the peak SOL value for each trial. The mean of the three trials determined maximal SOL EMG and was used to normalize target EMG values to provide visual feedback during conditioning trials.

Motor threshold for FN and Q stimulation

Motor threshold was initially identified while the leg was at 90° of knee flexion without being attached to the dynamometer to ensure the mechanical effect of the stimulation resulted in knee extension. The FN was stimulated with cathode in the femoral triangle (1 ms pulse width, circular 2.5 cm or 2.2 x 3.5 cm electrodes) generally just medial to the sartorius and approximately 1 cm distal to the inguinal ligament (Fig 1A). The cathode electrode was systematically moved in this area to identify the location that produced an isolated knee extension twitch and minimal hip flexion with the lowest current. The anode was positioned on the posterolateral buttock (7.5 x 13 cm, ValuTrode, Axelgaard Co., Ltd, CA, USA). One piezoelectric accelerometer (Model A352C65, Model 482C16 Four Channel, PCB Piezotronics, Inc, Depew, NY, USA) was placed on the muscle belly of VL to help confirm motor threshold by identifying the onset of muscle twitches [3]. The criteria for FN stimulation motor threshold was confirmed in the test position (knee flexed at 40 degrees) as the minimal current intensity that produced: 1) a visible M-wave on VL EMG, 2) palpable contraction in VL and VM, 3) and accelerometer onset from VL below ≤20 ms from stimulation [3].

Stimulation of the quadriceps muscles was achieved with two rectangular adhesive electrodes (7.5 x 13 cm ValuTrode, Axelgaard manufacturing Co., Ltd, CA, USA) positioned on motor point areas distally (VM) and proximally (VL-RF) (Fig 1A). Q muscle stimulation motor points were identified with a pen electrode guided by prior anatomical descriptions [18]. Stimulation was a doublet (two unipolar pulses, 50 μs pulse width, 200 Hz) to take advantage of the catchlike property [19, 20] and short pulse width to reduce the likelihood of activating sensory axons [13, 21]. The cathode and anode specification for Q electrodes was based on the configuration that resulted in a concurrent contraction of VM and VL-RF muscles with the lowest intensity. Q motor threshold was confirmed in the test position (knee flexed at 40 degrees) as the minimal current intensity that produced: 1) palpable contraction in VL, RF, and VM.

Soleus H-reflex and M wave recruitment curve

To elicit H-reflexes and M-waves, the tibial nerve was stimulated with a single 1 ms pulse in the popliteal fossa with cathode (2.2 x 2.2 cm; Vermed) and proximal anode (4.4 x 4.4 cm) separated by 3–4 cm and oriented along the course of the tibial nerve. Stimulation location was chosen to minimize the SOL H-reflex threshold, maximize the SOL Mmax size, and minimize the TA excitation. H-reflex/M-wave recruitment curves were obtained while participants maintained a plantarflexion contraction between 6% and 10% of their SOL MVIC to ensure stable motoneuron excitability [2, 22, 23]. Visual feedback of SOL EMG and stimulus triggering was provided by EPOCS software (Fig 1). Tibial nerve stimuli were automatically triggered to occur only if the SOL EMG was held in the target EMG range for at least 2–3 s. Tibial nerve stimulation intensity was increased in increments of 1.0–2.5 mA starting from a current below H-reflex threshold and ending when the intensity elicited a maximum M-wave (MMAX). Approximately 20 different intensities were used to obtain each recruitment curve, and three EMG responses were averaged at each intensity to determine the H-reflex and M-wave at each intensity. The recruitment curve was used to identify the current needed to produce 50% of HMAX, which was the tibial nerve stimulation used when examining heteronymous effects of FN and Q.

Effect of femoral nerve and quadriceps stimulation onto SOL H-reflex and ongoing SOL EMG

The general procedure included randomly alternating control and conditioned H-reflex recordings. The control H-reflex (i.e., test H-reflex) was evoked by a tibial nerve stimulation intensity that resulted in the H-reflex size to be around 50% HMAX. Conditioned H-reflexes included either Q or FN stimulation paired with tibial nerve stimulation at each of six interstimulus intervals (ISI) described below. Stimulation intensity for Q was 2x motor threshold (46 ± 10.9 mA) and the FN stimulation intensity (1.6 ± 0.2 x motor threshold; range 1.5–2 x motor threshold; 20.7 ± 9.5 mA) was chosen to match the peak torque produced by the 2x motor threshold Q stimulation. Control and conditioned H-reflexes were triggered to occur so long as the SOL activity was within the target range of 6–10% MVIC with a minimum of 8 s between stimulations. The control H-reflex size and M-wave magnitudes were monitored during the experiment; tibial nerve stimulation current was adjusted to keep a consistent M-wave and control H-reflex. A total of 20 trials were recorded for each control and conditioned H-reflex ISI timing. Q and FN conditioning trials were conducted on separate days. Tibial nerve and EMG electrodes were placed in the same location using anatomical and skin related landmarks as reference [24]. The average days between sessions was 4.2 ± 2.8 days (range: 1–9 days) for 14 of 15 participants. One participant had to travel after the first session so the second session was completed 54 days apart. The Hmax/Mmax ratio for the participants in this study was consistent across days (Day 1: 0.605 ± 0.13 and Day 2: 0.615 ± 0.14, paired t-test: p = 0.43).

The influence of heteronymous proprioceptive feedback from FN and Q stimulation onto SOL H-reflex was examined with 6 ISIs, chosen to include excitatory and inhibitory timings. Stimulation timings are reported in reference to the time of tibial nerve stimulation relative to FN or Q stimulation. Negative ISI intervals reflect tibial nerve stimulation prior to FN or Q stimulation, whereas positive ISI intervals reflect tibial nerve stimulation after FN or Q stimulation.

The negative (-) ISI values of -8, -6, and -4 were chosen to span the typical period of excitatory heteronymous feedback from quadriceps onto SOL H-reflex) [1, 5, 16]. Since the FN and Q muscle belly stimulation electrodes are closer to the spinal cord than the tibial nerve, the tibial nerve is stimulated prior to FN and Q locations when the goal is to have muscle spindle feedback from SOL and quadriceps arrive at SOL motoneurons at the same time (Fig 1B, left traces). The positive (+) ISI values of 0, +20, +60 were chosen to examine inhibitory heteronymous feedback from recurrent inhibition and likely Ib/Golgi tendon organs (Fig 1B, right traces) [1, 6, 16, 25]. Because Q stimulation was a double pulse with 5 ms interpulse interval, the Q stimulation was timed to occur 2.5 ms before and after that of FN for each ISI (i.e., for ISI -8, Q stimulation pulses occurred at -10.5 and -5.5 ms). This timing was selected to account, in part, for differences in the conduction time since FN stimulation is closer to the spinal cord compared to Q motor points; afferent volleys from the proximal VL motor point to the spinal cord has previously been shown to require about 2 ms longer latency compared to FN [14].

After H-reflex conditioning trials were completed, the influence of Q and FN stimulation onto ongoing SOL EMG targeting 10 and 20% MVIC was examined in a subset of 8 participants as described previously [3]. The Q was stimulated at an intensity of 2x motor threshold (i.e., same current used for H-reflex conditioning) when participants maintained SOL EMG at the target 10% for at least 2 seconds. Twenty repetitions were recorded with at least 8 seconds of rest between each repetition. The same procedures were repeated with FN stimulations onto the ongoing 10% SOL MVIC EMG with an intensity that matched the peak torque produced by Q stimulation. The procedures were then repeated while participants targeted 20% SOL MVIC EMG (Fig 1C).

Data analysis

All data were processed off-line using routines written in MATLAB R2021a (MathWorks, Natick, MA). EMG data were bandpass filtered (0.5–500 Hz, zero phase shift) prior to analysis. To examine whether experimental conditions were consistent within participants, the background SOL EMG activity prior to stimulation and the stimulation evoked peak knee extension torque, and the peak-to-peak SOL M-wave were calculated. Background SOL EMG was computed as the mean of the rectified signal prior to stimulation using a 250 ms window for the H-reflex analyses.

Effects of femoral nerve and quadriceps stimulation onto SOL H-reflex

The SOL H-reflex and M-wave sizes were calculated as the peak-to-peak amplitude within individual specified time windows after stimulation (typically, 6–25 ms for the M-wave and 30–50 ms for H-reflex). Excitatory and inhibitory heteronymous effects of FN and Q stimulation onto the SOL H-reflex are reported as a percentage of the control reflex with the following equation:

H-reflexsize%control=conditioned-control/control*100

Thus, a negative H-reflex size value indicates reduction of the SOL H-reflex size (i.e., inhibition), whereas a positive value indicates an increase in the H-reflex size (i.e., excitation).

Effect of femoral nerve and quadriceps stimulation onto ongoing SOL EMG

Excitatory and inhibitory effects from FN and Q muscle stimulation were evaluated after bandpass filtering (10–500 Hz, zero phase shift) and rectification. The rectified SOL EMG was normalized to each participant’s MVIC value and averaged across the 20 repetitions for FN and Q stimulation. The pre-stimulus SOL EMG means and standard deviations (SD) were calculated over a 400 ms period prior to stimulation. To more clearly express intermuscular effects, the mean pre-stimulation SOL EMG was subtracted from the SOL EMG trace, thus delineating the pre-stimulation mean as 0% MVIC and post-stimulation values above and below 0% MVIC excitatory and inhibitory feedback, respectively.

The pre-stimulus background SOL EMG mean and SD for each condition were used to identify excitation and inhibition onset, duration, and magnitudes as described in detail previously [3]. Excitation onset was determined as the time point when the SOL EMG trace exceeded 1SD above the mean for ≥ 2 ms. The end of excitation was determined as the time at which the SOL EMG trace returned below the 1 SD line for a period of ≥ 2 ms. Only excitatory responses with onset ≥ 23 ms were considered as arising from heteronymous Ia facilitation [1, 5]. Inhibition onset and termination were determined as the SOL EMG moving 1SD below the mean background SOL EMG for a period of ≥ 2 ms and returning above the 1 SD line for ≥ 2 ms. Inhibitory responses were considered in analysis only if the onset was < 45 ms since the fastest transcortical effects could manifest soon thereafter [15]. The durations of excitation and inhibition were calculated as the difference between effect onset and termination. The excitation and inhibition magnitudes were calculated as the area relative to background SOL EMG using trapezoidal numerical integration (trapz in Matlab).

Statistical analysis

All statistical analyses were performed with R-Studio, version 1.3.1073 (© 2009–2020 RStudio, PBC) and SAS 9.4 (The SAS Institute, Cary, NC). Descriptive statistics are reported in the text and figures as mean ± standard deviation.

To test the primary hypotheses examining heteronymous effects of FN and Q stimulation onto the H-reflex, the MIXED procedure was used to calculate separate two-way repeated-measures ANOVAs for excitatory and inhibitory ISI timings where the variable participant was treated as a random factor, and stimulation locations (i.e., FN and Q muscle stimulation) and ISIs (i.e., -8, -6, -4 or 0, 20, 60) were considered fixed effects. The F-values were computed using a compound symmetry variance-covariance structure and the Kenward-Roger method. Pairwise comparisons were completed with Bonferroni correction. The normality assumption was first inspected with the quantile-quartile plots for each variable and condition separately and evaluated with Shapiro-Wilks test. Friedman’s ANOVA was used when ANOVA assumptions of normality and homoscedasticity were not met. In addition, one-sample t-tests (i.e., H-reflex size compared to zero) were used to determine whether FN and Q stimulation elicited significant excitation or inhibition for each ISI.

To examine the heteronymous excitatory and inhibitory effects of FN and Q stimulation onto ongoing SOL EMG, a two-way ANOVA with stimulation location (2 levels: FN and Q) × SOL EMG background level (2 levels: 10% and 20 SOL %MVIC) was used. Paired post-hoc comparisons were used to examine whether excitatory and inhibitory effects elicited by FN and Q stimulation were significantly different. One-sample t-tests (or Wilcoxon signed rank tests) were used to determine if excitation and inhibition were significantly different from zero. Pearson product moment correlation coefficients were used to examine the associations between changes in H-reflex size and ongoing EMG due to FN and Q stimulations separately.

To evaluate whether background EMG and M-wave size changed across the experimental conditions, a repeated measures ANOVA with condition (2 levels: control and conditioned) x stimulation location (2 levels: FN and Q) × ISI (6 levels: -8, -6, -4, 0, 20, 60) was used. To evaluate whether the torque produced by FN and Q stimulation was the same across conditions, a two-way ANOVA with stimulation location (2 levels: FN and Q) × ISI (6 levels: -8, -6, -4,0, 20, 60) was used. Similarly, consistency in the control H-reflex magnitudes were evaluated with a two-way ANOVA stimulation location (2 levels: FN and Q) × ISI (6 levels: -8, -6, -4, 0, 20, 60). Background EMG, M-wave size, control H-reflex magnitude and torque evoked by FN and Q stimulation were all the same across conditions (see S1 File for detailed results). As such, the primary findings of the present study are independent of these factors.

Results

Larger heteronymous excitation was elicited with FN compared to Q stimulation

FN stimulation elicited a greater excitation of the SOL H-reflex compared to Q stimulation (Friedman’s ANOVA Chi-squared = 103.92, df = 2, P < 0.001). The only pairwise difference was found at the –6 ms ISI, where the H-reflex size change due to FN stimulation (13.95 ± 9.03% control) was significantly greater compared to Q stimulation (4.9 ± 4.53% control, P = 0.006, Fig 2A). Furthermore, FN and Q stimulation elicited significant excitation only at the -6 ms ISI (one-sample-test, P< 0.001 and P = 0.002, respectively). After selecting each participants’ largest H reflex size across excitatory ISIs, FN showed larger magnitudes of excitation compared to Q stimulation (14.5 ± 8.87 and 7.68 ± 6.54% control, respectively, Paired t-test: t(12) = 3.005, P = 0.011, Fig 2B).

Fig 2. Heteronymous excitation from femoral nerve (green boxplots) and quadriceps stimulation (orange boxplots) onto the SOL H-reflex.

Fig 2

A Heteronymous excitation for each of the excitatory interstimulus intervals where the largest excitation was observed when the tibial nerve was stimulated 6 ms before the FN or Q (ISI –6, * P = 0.006, ✝ significantly different than zero with one-sample t-test, P< 0.001). Note that the x-axis ISI values reflect FN stimulation timings. Q stimulation was a doublet with 5 ms interpulse interval such that the first stimuli was 2.5 ms before and after that of FN for each ISI (i.e., for ISI -8, Q stimulation pulses occurred at -10.5 and -5.5 ms). B Comparison of participants’ maximal heteronymous excitation from all excitatory interstimulus intervals. FN stimulation resulted in larger excitation of the SOL H-reflex compared to Q stimulation. (*P = 0.011, ✝: significantly different than zero with one-sample t-test for all P<0.001). Box and whiskers plots reflect the distribution of the data with the box representing quartiles and the horizontal line the median; each dot represents an individual participant.

FN and Q stimulation resulted in heteronymous inhibition of the SOL H-reflex

FN and Q stimulation elicited significant inhibition of the SOL H-reflex for all inhibitory ISIs (ISIs: 0, 20, 60 ms; One-sample tests: all P ≤ 0.008 across stimulation location). There was not a significant interaction between the effects of stimulation location and ISI (F2,70 = 1.07, P = 0.349, Fig 3). Conversely, there were significant main effects for stimulation location and ISI. FN stimulation elicited greater inhibition compared to Q stimulation (FN: -32.7 ± 18.9 and Q: -23.2 ± -20.9% control H-reflex, F1,70 = 8.21, P = 0.0055) and the largest inhibition occurred during the 20 ms ISI timing (0 ms: -24.6 ± 21.2, 20 ms: -36.0 ± 20.6, and 60 ms: -23.3 ± 17.7% control H-reflex, F2,70 = 5.91, P = 0.0042). Post hoc pairwise comparisons indicated that FN elicited greater inhibition than Q stimulation at the 0 ms ISI (-32.6 ± 19 and -16.5 ± 20.7% control H-reflex, P = 0.0067), whereas the inhibition was not different between Q and FN at the 20 and 60 ms ISIs (20 ms: -40.0 ± 17.7 and -32.0 ± 22.9% control H-reflex; 60 ms: -25.5 ± 18.6 and -21.0 ± 17.0% control H-reflex, all P >0.05). This finding indicates heteronymous inhibition elicited by Q and FN using 20 and 60 ms ISI timings produce equivalent inhibitory magnitudes.

Fig 3. Heteronymous inhibition from FN and Q stimulation onto SOL H-reflex was observed at each interstimulus interval timing.

Fig 3

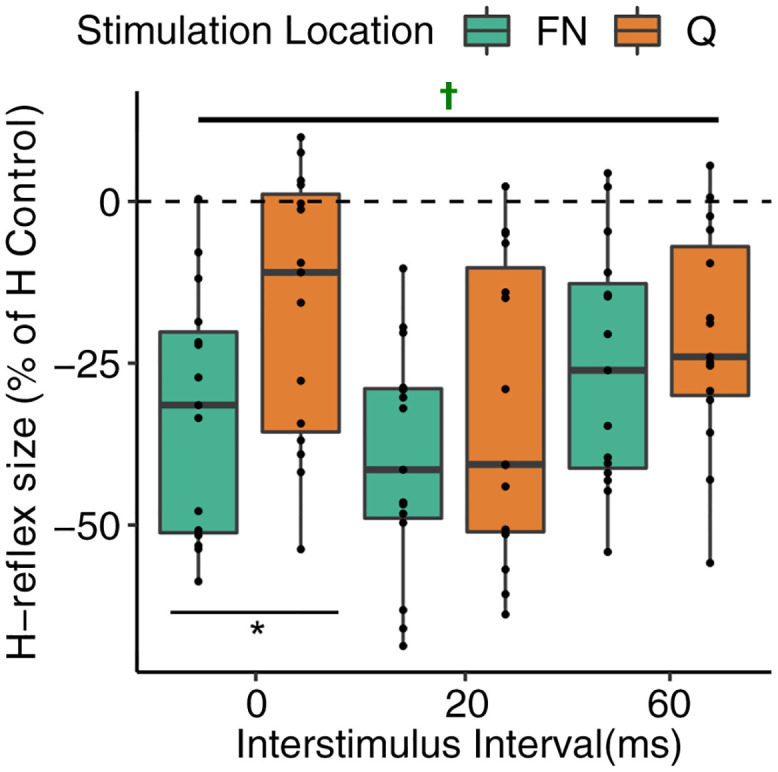
(*P = 0.0067, ✝ significantly different than zero with one-sample t-test, all P ≤ 0.008). Note that the x-axis ISI values reflect FN stimulation timings. Q stimulation was a doublet with 5 ms interpulse interval such that the first stimuli was 2.5 ms before and after that of FN for each ISI (i.e., for ISI 0, Q stimulation pulses occurred at -2.5 and 2.5 ms). Box and whiskers plots reflect the distribution of the data with the box representing quartiles and the horizontal line the median; each dot represents an individual participant.

Heteronymous effects onto ongoing SOL EMG of 10 and 20% MVIC in subset of 8 participants

The two-way ANOVA examining heteronymous excitation from FN and Q stimulation onto ongoing SOL EMG showed significant main effect for stimulation location (F1,21 = 13.36, P = 0.0015) and for SOL EMG background level (F1,21 = 8.31, P = 0.0089) with no interaction. At the 20% SOL EMG target level, FN stimulation resulted in significantly greater excitation compared to Q stimulation (t(21) = 3.96, P = 0.0043, Fig 4A). In addition, FN stimulation resulted in significantly greater excitation onto SOL EMG at the 20% SOL EMG target compared to 10% (t(21) = -3.42, P = 0.016), whereas no differences were found for Q stimulation across SOL EMG levels (Fig 4A). FN and Q stimulation elicited significant excitation for 10% and 20% SOL EMG background levels (One-sample tests: all P ≤ 0.02).

Fig 4. Heteronymous effects of FN (green) and Q (orange) stimulation onto SOL EMG while targeting 10% SOL EMG (Left pair) and 20% SOL EMG (Right pair).

Fig 4

A Heteronymous excitation was observed from FN and Q onto SOL EMG at 10% and 20% (✝ significantly different than zero with one-sample t-test, all P ≤ 0.02). FN stimulation resulted in significantly greater excitation than Q stimulation for the 20% SOL EMG target (P = 0.016). B Heteronymous inhibition from FN and Q stimulation onto SOL background EMG at 10% and 20% MVIC. (✝ significantly different than zero with one-sample t-test, all P ≤ 0.01). Box and whiskers plots reflect the distribution of the data with the box representing quartiles and the horizontal line the median; each dot represents an individual participant.

The two-way ANOVA examining heteronymous inhibition from FN and Q stimulation onto ongoing SOL EMG showed significant main effects for stimulation location (F1,21 = 7.47, P = 0.0125) and for SOL EMG background level (F1,21 = 21.51, P < 0.001) with no interaction (Fig 4B). FN stimulation resulted in significantly greater inhibition than Q stimulation (main effect, P < 0.001), but post-hoc pairwise comparisons were not significantly different with Bonferroni correction (P>0.05). FN stimulation resulted in significantly greater inhibition at the 20% SOL EMG background level compared to 10% (t(21) = 4.18, P = 0.0025), whereas inhibition elicited by Q stimulation was greater when targeting 20% compared to 10% SOL EMG on average but the difference was not significantly different. FN and Q stimulation elicited significant inhibition for 10% and 20% SOL EMG background levels (One-sample tests: all P ≤ 0.01).

Correlation between heteronymous excitatory effects as measured by H-reflex size and ongoing SOL EMG at 10 and 20% MVIC

The excitation elicited by FN stimulation onto the H-reflex (participants’ maximal excitatory H-reflex value across ISIs) was strongly correlated with the excitation elicited during the ongoing SOL EMG targeting 10 and 20% MVIC (r = 0.71, P = 0.047 and r = 0.89, P = 0.002). The excitation elicited by Q stimulation onto the H-reflex (participants’ maximal excitatory H-reflex value across ISIs) was weakly correlated with the excitation elicited during SOL EMG targeting 10% (r = 0.32, P = 0.43) and moderately correlated during targeting of 20% SOL MVIC (r = 0.58, P = 0.13). The scatterplots representing the correlation values above can be found in S1 Fig.

Correlation between heteronymous inhibitory effects as measured by H-reflex size and ongoing SOL EMG at 10 and 20% MVIC

The inhibition elicited by FN stimulation onto the SOL H-reflex (20 ms ISI) was weakly correlated with the inhibition elicited during the ongoing SOL EMG targeting 10% MVIC (r = 0.16, P = 0.7) and moderately correlated with the inhibition elicited during ongoing EMG targeting 20% MVIC (r = 0.52, P = 0.18). The inhibition elicited by Q stimulation onto the H-reflex (20 ms ISI) was strongly correlated with the inhibition elicited during SOL EMG targeting 10% (r = 0.72, P = 0.042) and 20% SOL MVIC (r = 0.82, P = 0.013). The scatterplots representing the correlation values above can be found in S2 Fig.

Discussion

The purpose of this study was to examine the differential influence of FN and Q stimulation onto the SOL H-reflex using ISI timings anticipated to cause excitation and inhibition. Consistent with the hypotheses and prior work [3, 14], heteronymous excitation elicited by FN stimulation was significantly larger than that elicited by Q stimulation (see Fig 2). Moreover, FN and Q stimulation elicited inhibition of the SOL H-reflex with similar magnitudes for 20 and 60 ISI intervals (see Fig 3). These findings suggest stimulation of the muscle belly can evoke similar heteronymous inhibition with less excitation compared to stimulation of the primary nerve trunk (i.e., FN).

Heteronymous excitation from FN and Q onto SOL H-reflex and ongoing EMG

Several studies have reported that FN stimulation elicits excitation onto the SOL H-reflex [1, 16, 26, 27] when the tibial nerve is stimulated just prior to the FN such that feedback from muscle spindle axons from both nerves reach the soleus motoneurons near the same time. Based on this prior work, three excitatory ISI timings (i.e., tibial nerve stimulated 4, 6, and 8 ms prior to FN) were compared between FN and Q stimulation. On average, the largest excitatory effect for FN and Q stimulation was observed when the tibial nerve was stimulated 6 ms prior to FN or Q. The magnitude of the heteronymous excitation from FN stimulation onto the SOL H-reflex (around 14%) in the present study is comparable to a prior report [16]. A primary finding of this study was that Q stimulation resulted in about half the heteronymous excitation of that resulting from FN stimulation. These data are consistent with several studies [3, 1214] that, taken together, support the utility of muscle stimulation as a way to examine non-spindle related heteronymous circuits in healthy young adults with less or no influence from heteronymous excitation.

While the excitation of the H-reflex from FN stimulation was generally larger than that for Q stimulation within a subject and on average, heteronymous excitation elicited by Q stimulation was evident in some individuals. This finding is consistent with a recent report that also found Q stimulation elicited excitation onto ongoing SOL EMG of 20% MVIC in some participants [3] even though the magnitude was about half the heteronymous excitation elicited by FN stimulation. In contrast to our findings, Barbeau et al. [15] reported FN and localized VL motor point stimulation using 1 ms pulse duration evoked the same heteronymous excitation of the SOL H-reflex in four participants. We speculate that the more localized stimulation of the VL motor point and l ms pulse duration could contribute to the more similar heteronymous SOL H-reflex facilitation compared to the present study which used larger surface electrodes and a doublet of 0.05 ms pulses. While the origin of the excitation cannot be determined using the methods in this study, heteronymous excitation elicited by FN stimulation has previously been attributed to activating muscle spindle axons with monosynaptic projections onto SOL motoneurons [1, 5]. Thus, our working hypothesis is that Q stimulation activates fewer spindle axons and/or activates spindle axons with more temporal dispersion than FN stimulation that results in fewer soleus motoneurons reaching threshold; nonetheless, our findings suggests that quadriceps muscle belly stimulation appears to activate a sufficient population of spindle axons in some individuals. The heteronymous effects from presumed muscle spindle axon activation in some persons observed here are in contrast to the fact that muscle stimulation evokes negligible homonymous H-reflexes [28, 29]. Moreover, muscle stretch (i.e., physiological activation of muscle spindle receptors), but not intramuscular stimulation, evokes heteronymous excitation between cat hindlimb muscles that share strong muscle spindle excitatory feedback [13]. Thus, the heteronymous excitation elicited by Q stimulation in some participants in this study remains a surprising finding though appears consistent with a prior report that also found some individuals exhibit greater central effects of electrical stimulation [30]. The primary factors responsible for those exhibiting excitation due to Q stimulation remain to be identified. We speculate anatomical differences, such as more superficially positioned spindle axons (e.g. see Fig 6 in [30]), could be responsible.

Heteronymous excitatory effects were also examined from FN and Q stimulation onto ongoing SOL EMG at 10% and 20% of MVIC in a subset of 8 participants. In our prior work, we examined heteronymous effects onto SOL EMG with background of 20% MVIC [3]. The goal here was to examine whether the differential effects of FN and Q stimulation could be observed using a lower background EMG magnitude of 10% since this circumstance may be more feasible in some patient populations. Overall, heteronymous excitation was observed from FN and Q onto the 10% SOL EMG. However, the excitatory magnitude elicited by FN stimulation was significantly lower when targeting 10% SOL EMG compared to 20%, and the differential effects of FN and Q stimulation were only observed at the 20% SOL MVIC. Moreover, the correlation was stronger between heteronymous excitation as measured by H-reflex and the 20% SOL EMG target when compared to 10%. Taken together, if a low physical effort is required, these results support evaluating heteronymous excitation from FN and Q stimulation onto the SOL H-reflex rather than onto ongoing 10% SOL EMG. The findings further indicate that the same conclusions are expected when examining heteronymous excitation from FN and Q stimulation onto the SOL H-reflex or when targeting 20% SOL EMG, at least in in young otherwise healthy adults.

Heteronymous inhibition from FN and Q stimulation onto SOL H-reflex and ongoing EMG

Heteronymous inhibition from FN onto either the SOL H-reflex or ongoing SOL EMG is a common finding that immediately follows the heteronymous excitation, if present, in the time domain [3, 6, 14, 16, 17]. In the present study, inhibition of the SOL H-reflex was observed for FN and Q stimulation at each of the inhibitory ISI timings examined. Overall, FN stimulation resulted in greater inhibition than Q stimulation and the inhibitory magnitudes due to FN stimulation are in close agreement with a prior report [16]. The larger inhibition due to FN stimulation in the present study was primarily due to the 0 ms ISI (tibial nerve and FN or Q stimulation at the same time) for which the Q stimulation elicited inhibition was significantly less. The inhibition elicited by FN and Q stimulation at the 20 and 60 ms ISI timings was not statistically different indicating Q stimulation produces similar inhibitory results as FN stimulation at these time intervals.

The origin of heteronymous inhibition from FN and Q stimulation has been attributed to direct activation of motor axons evoking recurrent inhibition (i.e., activation of Renshaw cells by recurrent collaterals), direct activation of Golgi tendon organ Ib axons and mechanical activation of Golgi tendon organ receptors due to muscle contraction [3, 6, 13, 14]. Golgi tendon organ feedback immediately follows heteronymous excitation in the time domain, and in fact reduces the latter part of heteronymous excitation [1, 7, 11]. While the precise time course transitioning from heteronymous excitation (Ia) to inhibition (Ib) was not systematically examined in this study, the 0 ms ISI timing likely reflects direct activation of Ib axons acting via interneurons that result in inhibitory postsynaptic potentials onto the soleus motoneuron pool and a reduced H-reflex size [1]. The larger inhibition elicited by FN compared to Q stimulation at the 0 ms ISI may reflect a reduced relative activation of Ib axons from the Q muscle stimulation. The heteronymous inhibition observed when FN and Q muscle were stimulated 20 and 60 ms prior to the tibial nerve could arise from several possibilities. In addition to activation of Golgi tendon Ib axons, heteronymous inhibition at the 20 and 60 ms ISI could also arise from recurrent inhibition and mechanical activation of Golgi tendon organs, and the 60 ms ISI could be further influenced by transcortical effects [15]. The prevailing opinion is that the heteronymous inhibition is predominantly due to recurrent inhibition [6, 15, 31]. An alternative possibility is that the stimulation evoked twitch contractions from FN and Q muscle stimulation result in mechanical activation and subsequent firing of Golgi tendon organs [12, 13]. The Q muscles twitch onset for FN and Q stimulation, estimated from an accelerometer, was 10.5 and 7.8 ms after stimulation, respectively. Thus, there appears to be time for Ib afferent firing to have effects at the 20 ms ISI and certainly at the 60 ms ISI, since the twitch evoked force is rising during this period and peaks around 100 ms after stimulation. We chose to examine the 60 ms ISI due to the presumed effects resulting from twitch evoked mechanical activation of Golgi tendon organ receptors, despite prior studies showing heteronymous inhibition to stop around 40 ms [16, 32]. The heteronymous inhibition observed in the present study at the 60 ms ISI could be influenced by the SOL H-reflex recorded during a low-level tonic contraction, whereas prior reports were completed at rest [16, 32]. An alternative explanation for the heteronymous inhibition at the 60 ms ISI could be attributed to presynaptic inhibition [25].

Heteronymous inhibition from FN and Q stimulation was examined onto ongoing SOL EMG held at 10 and 20% of maximal in 8 of the participants. The goal was to determine whether a lower physical effort (i.e., 10% SOL background EMG) could still be used to identify significant inhibition. The FN and Q stimulation elicited significant inhibition when targeting 10% and 20% SOL EMG. Nonetheless, the inhibition magnitude at 20% was larger and most likely primarily reflects the greater EMG magnitude available to inhibit. This finding is consistent with a prior study that found a significant correlation between the SOL EMG background level and heteronymous inhibition from FN stimulation [33]. As noted for heteronymous excitation and supported by the correlation analysis, the findings suggest that heteronymous inhibition can be observed with 10%; however, targeting 20% background EMG is expected to have a greater discriminant ability across individuals or groups and is more in line with the findings from SOL H-reflex.

Methodological considerations

The primary results evaluating FN and Q stimulation onto SOL H-reflex was completed while participants produced a low-level active contraction of the SOL. While our results were comparable to prior work, most studies recorded the test and conditioned SOL H-reflexes while the SOL was at rest [1, 16, 32]. We found heteronymous inhibition from FN and Q stimulation onto SOL H-reflex at the 60 ms ISI, whereas studies completed while SOL was at rest found heteronymous to end around 40 ms ISI [16, 32]. Thus, a possible explanation is that the active SOL initial condition could be responsible for the observed difference in heteronymous inhibition duration. An additional methodological consideration was that we examined heteronymous excitation with only a few ISI intervals. We were focused on 6 ms ISI which has been a commonly observed and justified interval [1, 14, 16, 32]. The purpose of this study was to compare FN and Q stimulation and thus the limited ISI timings used were adequate to test the hypothesis. Nonetheless, we acknowledge that the limited excitatory ISI timings make us unable to confirm whether the largest excitatory response was recorded for a given individual. The comparisons and correlations between the heteronymous effects onto the SOL H-reflex and ongoing SOL EMG at two background intensities were completed in a subset of 8 participants. While we feel the findings are helpful for interpreting past and informing future research, a larger sample size would be valuable to further clarify the relations. An additional consideration for future research is the relative influence of the pulse width used for muscle belly stimulation. This study found that stimulating the quadriceps muscle belly using a doublet with 50 μs pulse widths results in less heteronymous excitation when compared to stimulation over the FN with a single 1 ms pulse width stimulus. Several studies have also shown a much-reduced apparent activation of muscle spindle afferents even when applying 1 ms pulse width stimulations to the muscle belly compared to the nerve trunk [14, 28, 29, 34]. While the prior studies support stimulus location as the most likely reason for reduced heteronymous excitation in the present study [14, 28, 29, 34], future work should nonetheless examine the effects of pulse width since heteronymous effects attributed to activating sensory axons have been reported when stimulating other muscle nerves (e.g. medial gastrocnemius, SOL) with 1 ms pulse widths [7, 35].

Functional implications

Excitatory and inhibitory heteronymous feedback from muscles or motoneurons project extensively onto other lower limb motoneuron pools providing a potential functional role in facilitating motor coordination [4, 5, 14]. While acknowledging our methodical considerations, the heteronymous inhibition in the present and other studies [e.g., 16] highlight that inhibition typically occurs with greater frequency, magnitude, and duration when compared to heteronymous excitation. We propose that the consistent presence of heteronymous inhibition across participants implies, albeit indirectly, that inhibitory feedback between muscles may have a more prominent role in facilitating synergistic activation of muscles in a phase and task-dependent manner [15, 33] compared to heteronymous excitation. Expanding the options to study heteronymous feedback, particularly the ability to preferentially study specific excitatory and inhibitory spinal circuits, is important for clarifying the functional role of heteronymous feedback. The present study provides evidence that stimulation of the muscle belly may be used to study heteronymous inhibitory feedback more selectively when compared to nerve stimulation at least in healthy neurotypical young adults.

In addition, heteronymous feedback is most commonly examined using either the H-reflex or ongoing EMG. Nevertheless, a comparison of the effects in the same study has not yet been published. Here, we identified that the change in H-reflex size and ongoing SOL EMG at 20% were moderate to strongly correlated, whereas heteronymous effects onto SOL EMG at 10% may reveal significant heteronymous effects but with reduced magnitudes. Importantly, this finding suggests the ability to identify modulation of heteronymous feedback during standing and movement may require ongoing EMG of at least 20% MVIC.

Conclusions

This study compared the heteronymous effects of FN and Q stimulation onto the SOL H-reflex in healthy young adults. We found that Q stimulation resulted in less heteronymous excitation compared to FN stimulation, whereas similar heteronymous inhibition was elicited with FN and Q stimulation. Comparison of heteronymous effects onto the H-reflex and ongoing SOL EMG of 10 and 20% MVIC revealed that the heteronymous excitation and inhibition, as measured with the change in H-reflex size, were moderately to strongly correlated with 20% SOL EMG. Taken together, if the goal is to preferentially study heteronymous inhibition, then Q stimulation is a preferable choice; the motivation and primary benefit for using muscle stimulation will be to quantify inhibition between lower limb muscles in persons that exhibit large heteronymous excitation that may prevent a valid assessment of heteronymous inhibition [e.g., 16].

Supporting information

S1 Fig. Scatter plots showing correlation of heteronymous excitation examined by H-reflex and SOL background EMG 10% on left and 20% on right.

(EPS)

S2 Fig. Scatter plots showing correlation of heteronymous inhibition examined by H-reflex and SOL background EMG 10% on left and 20% on right.

(EPS)

S1 File. Supporting information.

(DOCX)

Acknowledgments

The authors want to thank Dr. Jeremy Hill for his assistance with software configuration, and Creedence Riblett, Christopher Tank, Kelly Jones, and Ignacio Novoa who helped during the data collection sessions.

Data Availability

All relevant data are within the paper and its Supporting information files.

Funding Statement

Research reported in this publication was supported by the Eunice Kennedy Shriver National Institute of Child Health & Human Development of the National Institutes of Health under Award Number K01HD100588 (MAL, https://www.nichd.nih.gov/) and 1R01HD095975-01A1 (SLW, https://www.nichd.nih.gov/), as well as National Institute of Neurological Disorders and Stroke awards 5U01NS086607-05 (SLW, https://www.ninds.nih.gov/funding), U01NS166655 (SLW, https://www.ninds.nih.gov/funding), and 1U01NS102353-01 (SLW, https://www.ninds.nih.gov/funding). The content is solely the responsibility of the authors and does not necessarily represent the official views of the National Institutes of Health. The funders had no role in study design, data collection and analysis, decision to publish, or preparation of the manuscript.

References

  • 1.Hultborn H, Meunier S, Morin C, Pierrot-Deseilligny E. Assessing changes in presynaptic inhibition of I a fibres: a study in man and the cat. J Physiol. 1987;389:729–56. Epub 1987/08/01. doi: 10.1113/jphysiol.1987.sp016680 [DOI] [PMC free article] [PubMed] [Google Scholar]
  • 2.Knikou M. The H-reflex as a probe: pathways and pitfalls. J Neurosci Methods. 2008;171(1):1–12. doi: 10.1016/j.jneumeth.2008.02.012 . [DOI] [PubMed] [Google Scholar]
  • 3.Lyle MA, Cuadra C, Wolf SL. Quadriceps muscle stimulation evokes heteronymous inhibition onto soleus with limited Ia activation compared to femoral nerve stimulation. Exp Brain Res. 2022;240(9):2375–88. Epub 2022/07/27. doi: 10.1007/s00221-022-06422-7 . [DOI] [PMC free article] [PubMed] [Google Scholar]
  • 4.Marque P, Nicolas G, Marchand-Pauvert V, Gautier J, Simonetta-Moreau M, Pierrot-Deseilligny E. Group I projections from intrinsic foot muscles to motoneurones of leg and thigh muscles in humans. J Physiol. 2001;536(Pt 1):313–27. Epub 2001/10/02. doi: 10.1111/j.1469-7793.2001.t01-1-00313.x [DOI] [PMC free article] [PubMed] [Google Scholar]
  • 5.Meunier S, Pierrot-Deseilligny E, Simonetta M. Pattern of monosynaptic heteronymous Ia connections in the human lower limb. Exp Brain Res. 1993;96(3):534–44. doi: 10.1007/BF00234121 . [DOI] [PubMed] [Google Scholar]
  • 6.Meunier S, Pierrot-Deseilligny E, Simonetta-Moreau M. Pattern of heteronymous recurrent inhibition in the human lower limb. Exp Brain Res. 1994;102(1):149–59. doi: 10.1007/BF00232447 . [DOI] [PubMed] [Google Scholar]
  • 7.Pierrot-Deseilligny E, Morin C, Bergego C, Tankov N. Pattern of group I fibre projections from ankle flexor and extensor muscles in man. Exp Brain Res. 1981;42(3–4):337–50. Epub 1981/01/01. doi: 10.1007/BF00237499 . [DOI] [PubMed] [Google Scholar]
  • 8.Nichols TR. Distributed force feedback in the spinal cord and the regulation of limb mechanics. J Neurophysiol. 2018;119(3):1186–200. Epub 2017/12/08. doi: 10.1152/jn.00216.2017 [DOI] [PMC free article] [PubMed] [Google Scholar]
  • 9.Sainburg RL, Poizner H, Ghez C. Loss of proprioception produces deficits in interjoint coordination. J Neurophysiol. 1993;70(5):2136–47. Epub 1993/11/01. doi: 10.1152/jn.1993.70.5.2136 . [DOI] [PMC free article] [PubMed] [Google Scholar]
  • 10.Eccles JC, Eccles RM, Lundberg A. The convergence of monosynaptic excitatory afferents on to many different species of alpha motoneurones. J Physiol. 1957;137(1):22–50. Epub 1957/06/18. doi: 10.1113/jphysiol.1957.sp005794 [DOI] [PMC free article] [PubMed] [Google Scholar]
  • 11.Eccles JC, Eccles RM, Lundberg A. Synaptic actions on motoneurones caused by impulses in Golgi tendon organ afferents. J Physiol. 1957;138(2):227–52. Epub 1957/09/30. doi: 10.1113/jphysiol.1957.sp005849 [DOI] [PMC free article] [PubMed] [Google Scholar]
  • 12.Aguiar SA, Baker SN. Convergent Spinal Circuits Facilitating Human Wrist Flexors. J Neurosci. 2018;38(16):3929–38. Epub 2018/03/23. doi: 10.1523/JNEUROSCI.1870-17.2018 [DOI] [PMC free article] [PubMed] [Google Scholar]
  • 13.Lyle MA, Nichols TR. Evaluating intermuscular Golgi tendon organ feedback with twitch contractions. J Physiol. 2019;597(17):4627–42. Epub 2019/06/23. doi: 10.1113/JP277363 [DOI] [PMC free article] [PubMed] [Google Scholar]
  • 14.Meunier S, Penicaud A, Pierrot-Deseilligny E, Rossi A. Monosynaptic Ia excitation and recurrent inhibition from quadriceps to ankle flexors and extensors in man. J Physiol. 1990;423:661–75. doi: 10.1113/jphysiol.1990.sp018046 [DOI] [PMC free article] [PubMed] [Google Scholar]
  • 15.Barbeau H, Marchand-Pauvert V, Meunier S, Nicolas G, Pierrot-Deseilligny E. Posture-related changes in heteronymous recurrent inhibition from quadriceps to ankle muscles in humans. Exp Brain Res. 2000;130(3):345–61. doi: 10.1007/s002219900260 . [DOI] [PubMed] [Google Scholar]
  • 16.Dyer JO, Maupas E, de Andrade Melo S, Bourbonnais D, Fleury J, Forget R. Transmission in heteronymous spinal pathways is modified after stroke and related to motor incoordination. PLoS One. 2009;4(1):e4123. doi: 10.1371/journal.pone.0004123 [DOI] [PMC free article] [PubMed] [Google Scholar]
  • 17.Dyer JO, Maupas E, de Andrade Melo S, Bourbonnais D, Nadeau S, Forget R. Changes in activation timing of knee and ankle extensors during gait are related to changes in heteronymous spinal pathways after stroke. J Neuroeng Rehabil. 2014;11:148. doi: 10.1186/1743-0003-11-148 [DOI] [PMC free article] [PubMed] [Google Scholar]
  • 18.Botter A, Oprandi G, Lanfranco F, Allasia S, Maffiuletti NA, Minetto MA. Atlas of the muscle motor points for the lower limb: implications for electrical stimulation procedures and electrode positioning. European journal of applied physiology. 2011;111(10):2461–71. Epub 2011/07/29. doi: 10.1007/s00421-011-2093-y . [DOI] [PubMed] [Google Scholar]
  • 19.Binder-Macleod S, Kesar T. Catchlike property of skeletal muscle: recent findings and clinical implications. Muscle & nerve. 2005;31(6):681–93. doi: 10.1002/mus.20290 . [DOI] [PubMed] [Google Scholar]
  • 20.Burke RE, Rudomin P, Zajac FE 3rd. Catch property in single mammalian motor units. Science. 1970;168(3927):122–4. doi: 10.1126/science.168.3927.122 . [DOI] [PubMed] [Google Scholar]
  • 21.Panizza M, Nilsson J, Roth BJ, Grill SE, Demirci M, Hallett M. Differences between the time constant of sensory and motor peripheral nerve fibers: further studies and considerations. Muscle & nerve. 1998;21(1):48–54. Epub 1998/01/14. doi: . [DOI] [PubMed] [Google Scholar]
  • 22.Stein RB, Thompson AK. Muscle reflexes in motion: how, what, and why? Exerc Sport Sci Rev. 2006;34(4):145–53. Epub 2006/10/13. doi: 10.1249/01.jes.0000240024.37996.e5 . [DOI] [PubMed] [Google Scholar]
  • 23.Theodosiadou A, Henry M, Duchateau J, Baudry S. Revisiting the use of Hoffmann reflex in motor control research on humans. European journal of applied physiology. 2023;123(4):695–710. Epub 2022/12/27. doi: 10.1007/s00421-022-05119-7 . [DOI] [PubMed] [Google Scholar]
  • 24.Thompson AK, Pomerantz FR, Wolpaw JR. Operant conditioning of a spinal reflex can improve locomotion after spinal cord injury in humans. J Neurosci. 2013;33(6):2365–75. doi: 10.1523/JNEUROSCI.3968-12.2013 [DOI] [PMC free article] [PubMed] [Google Scholar]
  • 25.Knikou M, Conway BA. Reflex effects of induced muscle contraction in normal and spinal cord injured subjects. Muscle & nerve. 2002;26(3):374–82. doi: 10.1002/mus.10206 . [DOI] [PubMed] [Google Scholar]
  • 26.Koceja DM, Mynark RG. Comparison of heteronymous monosynaptic Ia facilitation in young and elderly subjects in supine and standing positions. Int J Neurosci. 2000;103(1–4):1–17. Epub 2000/08/12. doi: 10.3109/00207450009035005 . [DOI] [PubMed] [Google Scholar]
  • 27.Morita H, Shindo M, Yanagawa S, Yoshida T, Momoi H, Yanagisawa N. Progressive decrease in heteronymous monosynaptic Ia facilitation with human ageing. Exp Brain Res. 1995;104(1):167–70. Epub 1995/01/01. doi: 10.1007/BF00229867 . [DOI] [PubMed] [Google Scholar]
  • 28.Bergquist AJ, Wiest MJ, Collins DF. Motor unit recruitment when neuromuscular electrical stimulation is applied over a nerve trunk compared with a muscle belly: quadriceps femoris. Journal of applied physiology. 2012;113(1):78–89. Epub 2012/05/05. doi: 10.1152/japplphysiol.00074.2011 . [DOI] [PubMed] [Google Scholar]
  • 29.Nakagawa K, Bergquist AJ, Yamashita T, Yoshida T, Masani K. Motor point stimulation primarily activates motor nerve. Neuroscience letters. 2020;736:135246. Epub 2020/07/17. doi: 10.1016/j.neulet.2020.135246 . [DOI] [PubMed] [Google Scholar]
  • 30.Bergquist AJ, Clair JM, Lagerquist O, Mang CS, Okuma Y, Collins DF. Neuromuscular electrical stimulation: implications of the electrically evoked sensory volley. European journal of applied physiology. 2011;111(10):2409–26. doi: 10.1007/s00421-011-2087-9 . [DOI] [PubMed] [Google Scholar]
  • 31.Marchand-Pauvert V, Aymard C, Giboin LS, Dominici F, Rossi A, Mazzocchio R. Beyond muscular effects: depression of spinal recurrent inhibition after botulinum neurotoxin A. J Physiol. 2013;591(4):1017–29. doi: 10.1113/jphysiol.2012.239178 [DOI] [PMC free article] [PubMed] [Google Scholar]
  • 32.Meunier S, Mogyoros I, Kiernan MC, Burke D. Effects of femoral nerve stimulation on the electromyogram and reflex excitability of tibialis anterior and soleus. Muscle & nerve. 1996;19(9):1110–5. doi: [DOI] [PubMed] [Google Scholar]
  • 33.Lamy JC, Iglesias C, Lackmy A, Nielsen JB, Katz R, Marchand-Pauvert V. Modulation of recurrent inhibition from knee extensors to ankle motoneurones during human walking. J Physiol. 2008;586(24):5931–46. doi: 10.1113/jphysiol.2008.160630 [DOI] [PMC free article] [PubMed] [Google Scholar]
  • 34.Bergquist AJ, Clair JM, Collins DF. Motor unit recruitment when neuromuscular electrical stimulation is applied over a nerve trunk compared with a muscle belly: triceps surae. Journal of applied physiology. 2011;110(3):627–37. Epub 2010/12/25. doi: 10.1152/japplphysiol.01103.2010 . [DOI] [PubMed] [Google Scholar]
  • 35.Horslen BC, Inglis JT, Blouin JS, Carpenter MG. Both standing and postural threat decrease Achilles’ tendon reflex inhibition from tendon electrical stimulation. J Physiol. 2017;595(13):4493–506. Epub 2017/03/23. doi: 10.1113/JP273935 [DOI] [PMC free article] [PubMed] [Google Scholar]

Decision Letter 0

Tomoyoshi Komiyama

26 May 2023

PONE-D-23-13190Differential effect of heteronymous feedback from femoral nerve and quadriceps muscle stimulation onto Soleus H-reflexPLOS ONE

Dear Dr. Lyle,

Thank you for submitting your manuscript to PLOS ONE. After careful consideration, we feel that it has merit but does not fully meet PLOS ONE’s publication criteria as it currently stands. Therefore, we invite you to submit a revised version of the manuscript that addresses the points raised during the review process.

Please submit your revised manuscript by Jul 10 2023 11:59PM. If you will need more time than this to complete your revisions, please reply to this message or contact the journal office at plosone@plos.org. When you're ready to submit your revision, log on to https://www.editorialmanager.com/pone/ and select the 'Submissions Needing Revision' folder to locate your manuscript file.

Please include the following items when submitting your revised manuscript:

  • A rebuttal letter that responds to each point raised by the academic editor and reviewer(s). You should upload this letter as a separate file labeled 'Response to Reviewers'.

  • A marked-up copy of your manuscript that highlights changes made to the original version. You should upload this as a separate file labeled 'Revised Manuscript with Track Changes'.

  • An unmarked version of your revised paper without tracked changes. You should upload this as a separate file labeled 'Manuscript'.

If you would like to make changes to your financial disclosure, please include your updated statement in your cover letter. Guidelines for resubmitting your figure files are available below the reviewer comments at the end of this letter.

If applicable, we recommend that you deposit your laboratory protocols in protocols.io to enhance the reproducibility of your results. Protocols.io assigns your protocol its own identifier (DOI) so that it can be cited independently in the future. For instructions see: https://journals.plos.org/plosone/s/submission-guidelines#loc-laboratory-protocols. Additionally, PLOS ONE offers an option for publishing peer-reviewed Lab Protocol articles, which describe protocols hosted on protocols.io. Read more information on sharing protocols at https://plos.org/protocols?utm_medium=editorial-email&utm_source=authorletters&utm_campaign=protocols.

We look forward to receiving your revised manuscript.

Kind regards,

Tomoyoshi Komiyama, Ph.D

Academic Editor

PLOS ONE

Journal Requirements:

When submitting your revision, we need you to address these additional requirements.

1. Please ensure that your manuscript meets PLOS ONE's style requirements, including those for file naming. The PLOS ONE style templates can be found at 

https://journals.plos.org/plosone/s/file?id=wjVg/PLOSOne_formatting_sample_main_body.pdf and 

https://journals.plos.org/plosone/s/file?id=ba62/PLOSOne_formatting_sample_title_authors_affiliations.pdf

2. We note that you have stated that you will provide repository information for your data at acceptance. Should your manuscript be accepted for publication, we will hold it until you provide the relevant accession numbers or DOIs necessary to access your data. If you wish to make changes to your Data Availability statement, please describe these changes in your cover letter and we will update your Data Availability statement to reflect the information you provide.

3. We note that Figures 1 in your submission contain copyrighted images. All PLOS content is published under the Creative Commons Attribution License (CC BY 4.0), which means that the manuscript, images, and Supporting Information files will be freely available online, and any third party is permitted to access, download, copy, distribute, and use these materials in any way, even commercially, with proper attribution. For more information, see our copyright guidelines: http://journals.plos.org/plosone/s/licenses-and-copyright.

We require you to either (1) present written permission from the copyright holder to publish these figures specifically under the CC BY 4.0 license, or (2) remove the figures from your submission:

a. You may seek permission from the original copyright holder of Figure 1 to publish the content specifically under the CC BY 4.0 license. 

We recommend that you contact the original copyright holder with the Content Permission Form (http://journals.plos.org/plosone/s/file?id=7c09/content-permission-form.pdf) and the following text:

“I request permission for the open-access journal PLOS ONE to publish XXX under the Creative Commons Attribution License (CCAL) CC BY 4.0 (http://creativecommons.org/licenses/by/4.0/). Please be aware that this license allows unrestricted use and distribution, even commercially, by third parties. Please reply and provide explicit written permission to publish XXX under a CC BY license and complete the attached form.”

Please upload the completed Content Permission Form or other proof of granted permissions as an "Other" file with your submission. 

In the figure caption of the copyrighted figure, please include the following text: “Reprinted from [ref] under a CC BY license, with permission from [name of publisher], original copyright [original copyright year].”

b. If you are unable to obtain permission from the original copyright holder to publish these figures under the CC BY 4.0 license or if the copyright holder’s requirements are incompatible with the CC BY 4.0 license, please either i) remove the figure or ii) supply a replacement figure that complies with the CC BY 4.0 license. Please check copyright information on all replacement figures and update the figure caption with source information. If applicable, please specify in the figure caption text when a figure is similar but not identical to the original image and is therefore for illustrative purposes only.

4. Please upload a copy of Supporting Information Figure/Table/etc. S1 Fig and S2 Fig which you refer to in your text on page 28.

Additional Editor Comments:

Dear Authors,

Your study compared the homogenous effects of FN and Q stimulation on the SOL H reflex in healthy young adults. You found that Q stimulation resulted in less heteronymous excitation compared to FN stimulation, and that FN and Q stimulation induced similar silence suppression. Also, comparison of the heteronymous effect of the H reflex and 10 and 20% MVIC on ongoing SOL EMG showed that heteronymous excitation and inhibition were moderately to strongly correlated with 20% SOL EMG, as measured by changes in H reflex size.

However, I think you should strengthen the reliability of these results by adding as much information as possible.

We thus have some questions and suggestions for the manuscript that you might consider.

I believe these comments will be very helpful in the revision of your study.

Tomoyoshi Komiyama

[Note: HTML markup is below. Please do not edit.]

Reviewers' comments:

Reviewer's Responses to Questions

Comments to the Author

1. Is the manuscript technically sound, and do the data support the conclusions?

The manuscript must describe a technically sound piece of scientific research with data that supports the conclusions. Experiments must have been conducted rigorously, with appropriate controls, replication, and sample sizes. The conclusions must be drawn appropriately based on the data presented.

Reviewer #1: Yes

Reviewer #2: No

**********

2. Has the statistical analysis been performed appropriately and rigorously?

Reviewer #1: Yes

Reviewer #2: I Don't Know

**********

3. Have the authors made all data underlying the findings in their manuscript fully available?

The PLOS Data policy requires authors to make all data underlying the findings described in their manuscript fully available without restriction, with rare exception (please refer to the Data Availability Statement in the manuscript PDF file). The data should be provided as part of the manuscript or its supporting information, or deposited to a public repository. For example, in addition to summary statistics, the data points behind means, medians and variance measures should be available. If there are restrictions on publicly sharing data—e.g. participant privacy or use of data from a third party—those must be specified.

Reviewer #1: Yes

Reviewer #2: No

**********

4. Is the manuscript presented in an intelligible fashion and written in standard English?

PLOS ONE does not copyedit accepted manuscripts, so the language in submitted articles must be clear, correct, and unambiguous. Any typographical or grammatical errors should be corrected at revision, so please note any specific errors here.

Reviewer #1: Yes

Reviewer #2: Yes

**********

5. Review Comments to the Author

Please use the space provided to explain your answers to the questions above. You may also include additional comments for the author, including concerns about dual publication, research ethics, or publication ethics. (Please upload your review as an attachment if it exceeds 20,000 characters)

Reviewer #1: OVERALL IMPRESSION

In this study, the authors compare in 15 healthy subjects the excitatory or inhibitory effects observed on the Soleus H-reflex, and the Soleus-EMG in a subgroup of 8 subjects, after electrical stimulation of either the Femoral Nerve or the Quadriceps.

The abstract is well constructed and correctly summarizes the study and its main findings.

In the introduction, the authors raise the question of the technical modalities to study specifically the heteronymous inhibitory circuits of the lower limbs.

The authors refer to previous studies focusing on muscle stimulation rather than on the femoral nerve in order to study more specifically the inhibitory circuits in patients who may present an exaggerated heteronymous excitation of soleus H-reflex.

Hypothesis are well made based on knowledge already acquired.

The figures are clear and accurate. The presentation makes the data easy to understand.

The results are clear and easily readable with the titles of the sub-paragraphs : « larger hetenomymous excitation was elicited with FN compared to Q stimulation (fig 2)», « FN and Q stimulation resulted in heteronymous inhibition of the SOL H-reflex (fig 3)» « heteronymous effects onto ongoing SOL EM of 10 and 20 % MVIC in subset of 8 participants ».

Then the correlations between the data received in H- reflex or EMG at 10 or 20% of the MVIC are given (heteronymous excitatory and inhibitory effects). The data are detailed.

The beginning of the discussion effectively summarizes the key data from this study: Consistent with the hypotheses and prior work [3, 15], heteronymous excitation elicited by FN stimulation was significantly larger than that elicited by Q stimulation (see Fig 2). Moreover, FN and Q stimulation 3elicited inhibition of the SOL H-reflex with similar magnitudes (see Fig 3). These findings suggest stimulation of the muscle belly can evoke similar heteronymous inhibition with less excitation compared to stimulation of the primary nerve trunk (i.e., FN).

The data are compared to previous studies.

Limitations of the study are discussed along with methodological considerations and functional implications.

Materials and methods : The procedures are clearly explained as well as the data analysis and the statistical analysis taking into account the post-hoc analysis.

Conclusions: considering these results the authors propose to use Q stimulation rather than FN stimulation to study heteronymous inhibition in the lower limb. One of the applications would be to use this method in patients with early heteronymous excitation e.g. post-stroke patients (ref 17).

DISCUSSION OF SPECIFIC AREAS FOR IMPROVEMENT

No major issues

Minor issues : I just have minor issues to point out

1. Line 143-144 and fig 1 : when you look at the quadriceps stimulation electrodes on figure 1, you get the impression that they do not exactly match the text: « positionned on motor point areas distally (VM) and proximally –VL-RF). The authors should slightly modify the design of the electrodes position.

2. Line 180 : what do the authors mean by « Q and FN conditioning trials were conducted on separate days » ? How long time betwwen the two days ? Did they compare the Hmax/Mmax ratio between the 2 days ?

3. Line 200 : did the study of the influence of Q and FN stimulation onto EMG occur on the same days ? Could you clarify the time course ?

4. Line 413-415 : « The primary factors responsible for those exhibiting excitation due to Q stimulation remain to be identified. We speculate anatomical differences, such as more superficially positioned spindle axons, could be responsible. »

Can you clarify: Is this just speculation or do you have any studies that can explain this?

Reviewer #2: Comments to the Authors:

The article entitled “Differential effect of heteronymous feedback from femoral nerve and quadriceps muscle stimulation onto Soleus H-reflex” is a research article investigating the effect of femoral nerve (FN) stimulation and quadriceps muscle belly (Q) stimulation onto soleus H-reflex and on-going EMG of soleus. The authors showed that FN stimulation elicited greater facilitation of H-reflex compared to Q stimulation. Similar effect was observed in on-going EMG of 20% maximal voluntary contraction (MVC), but not 10% MVC. Whereas heteronymous inhibition was elicited by FN stimulation and Q stimulation. From these results, the authors claim that Q stimulation is preferable choice to activate inhibitory pathway likely via Ib afferents.

The manuscript was unclear because many of measurement values did not describe in current version. So, it is difficult to support the authors’ claim. I suggest that the authors describe your data more precisely.

General Comments

1. To make it easier for non-experts to understand what was measured and analyzed, I strongly suggest showing representative waveforms of H-reflex and on-going EMG.

2. The authors described in statistical data only instead of raw data. I felt that many of individual raw data were ambiguous in this study (For example; knee extension torque induced by FN and Q stimulation, control H-reflex amplitude, M-wave amplitude of FN stimulation for MT…). These data will help replicate this study and will be beneficial in clarifying the results. Therefore, I suggest showing these measurement values.

3. The authors confirm the motor threshold (MT) while the knee flexed at 90° position (line 129), however, actual measurement was performed in 40° knee flexion and 60° hip flexion position. It is speculated that this posture difference affects MT. Why did the authors select this position to measure the threshold?

4. The authors described the MT of FN stimulation was the minimal current intensity that produced: 1) a visible M-wave on VL EMG, 2) palpable contraction in VL and VM, 3) accelerometer onset from VL below ≤20 ms from stimulation, and 4) visible motion of the hanging shank after stimulation (line 138) and the MT of Q stimulation was determined as the minimal current intensity that produced: 1) palpable contraction in VL, RF, and VM, with 2) visible motion of the shank after stimulation(line 147). How much the stimulus intensity did the authors actually used? In addition, what was the amplitude of the M-wave during FN and Q stimulation?

5. Different stimulation pulses were used in this study, i.e., FN stimulation was used a single rectangular pulse with 1 ms duration, however, Q stimulation was used a paired pulse with 50 μs duration at 200 Hz. If the authors want to compare difference in stimulation sites, I suggest the authors should align the stimulus waveform. Did you perform that in preliminary experiment? It is unclear from the current results whether it is due to differences in stimulation sites or differences in stimulation waveforms.

6. It was difficult to understand the contents of the figures. What does the boxplot mean? What does the dot? What did the authors compare? Please add a more detailed explanation.

7. The authors compared the results of H-reflex and on-going EMG, however the background EMG level was quite different (H-reflex, 6~10% of MVC [line 156]; on-going EMG, 10 and 20% of MVC [lines 205, 207]). I suggest examining and comparing the effects on the H-reflex when the amount of contraction is changed.

8. The authors claimed that the heteronymous inhibition induced by Q stimulation was similar to that by FN stimulation (Figure 4). However, Q stimulation has a large outlier at each 10% and 20% MVC (Figure 4B). Because the number of participants was small (8 participants, line 201), I feel that the results of one person have a large impact on the author's claim. If exclude this data, it may appear that there is difference in inhibition area elicited by FN stimulation and Q stimulation similar to H-reflex experiment. Therefore, it is difficult to support the authors’ claim from the current result.

**********

6. PLOS authors have the option to publish the peer review history of their article (what does this mean?). If published, this will include your full peer review and any attached files.

If you choose “no”, your identity will remain anonymous but your review may still be made public.

Do you want your identity to be public for this peer review? For information about this choice, including consent withdrawal, please see our Privacy Policy.

Reviewer #1: No

Reviewer #2: No

**********

[NOTE: If reviewer comments were submitted as an attachment file, they will be attached to this email and accessible via the submission site. Please log into your account, locate the manuscript record, and check for the action link "View Attachments". If this link does not appear, there are no attachment files.]

While revising your submission, please upload your figure files to the Preflight Analysis and Conversion Engine (PACE) digital diagnostic tool, https://pacev2.apexcovantage.com/. PACE helps ensure that figures meet PLOS requirements. To use PACE, you must first register as a user. Registration is free. Then, login and navigate to the UPLOAD tab, where you will find detailed instructions on how to use the tool. If you encounter any issues or have any questions when using PACE, please email PLOS at figures@plos.org. Please note that Supporting Information files do not need this step.

PLoS One. 2023 Aug 14;18(8):e0290078. doi: 10.1371/journal.pone.0290078.r002

Author response to Decision Letter 0


20 Jun 2023

**NOTE: Changes to text noted in each of the responses below are referring to the track changed version of the manuscript.

Reviewer #1: OVERALL IMPRESSION

In this study, the authors compare in 15 healthy subjects the excitatory or inhibitory effects observed on the Soleus H-reflex, and the Soleus-EMG in a subgroup of 8 subjects, after electrical stimulation of either the Femoral Nerve or the Quadriceps.

The abstract is well constructed and correctly summarizes the study and its main findings.

In the introduction, the authors raise the question of the technical modalities to study specifically the heteronymous inhibitory circuits of the lower limbs.

The authors refer to previous studies focusing on muscle stimulation rather than on the femoral nerve in order to study more specifically the inhibitory circuits in patients who may present an exaggerated heteronymous excitation of soleus H-reflex.

Hypothesis are well made based on knowledge already acquired.

The figures are clear and accurate. The presentation makes the data easy to understand.

The results are clear and easily readable with the titles of the sub-paragraphs : « larger hetenomymous excitation was elicited with FN compared to Q stimulation (fig 2)», « FN and Q stimulation resulted in heteronymous inhibition of the SOL H-reflex (fig 3)» « heteronymous effects onto ongoing SOL EM of 10 and 20 % MVIC in subset of 8 participants ».

Then the correlations between the data received in H- reflex or EMG at 10 or 20% of the MVIC are given (heteronymous excitatory and inhibitory effects). The data are detailed.

The beginning of the discussion effectively summarizes the key data from this study: Consistent with the hypotheses and prior work [3, 15], heteronymous excitation elicited by FN stimulation was significantly larger than that elicited by Q stimulation (see Fig 2). Moreover, FN and Q stimulation 3elicited inhibition of the SOL H-reflex with similar magnitudes (see Fig 3). These findings suggest stimulation of the muscle belly can evoke similar heteronymous inhibition with less excitation compared to stimulation of the primary nerve trunk (i.e., FN).

The data are compared to previous studies.

Limitations of the study are discussed along with methodological considerations and functional implications.

Materials and methods : The procedures are clearly explained as well as the data analysis and the statistical analysis taking into account the post-hoc analysis.

Conclusions: considering these results the authors propose to use Q stimulation rather than FN stimulation to study heteronymous inhibition in the lower limb. One of the applications would be to use this method in patients with early heteronymous excitation e.g. post-stroke patients (ref 17).

RESPONSE: We thank Reviewer 1 for his/her encouraging comments/impressions, thorough review, and constructive feedback. We feel that input improved the clarity of this revised manuscript.

DISCUSSION OF SPECIFIC AREAS FOR IMPROVEMENT

No major issues

Minor issues : I just have minor issues to point out

1. Line 143-144 and fig 1 : when you look at the quadriceps stimulation electrodes on figure 1, you get the impression that they do not exactly match the text: « positioned on motor point areas distally (VM) and proximally –VL-RF). The authors should slightly modify the design of the electrodes position.

RESPONSE: Thank you for bringing the misrepresented electrode positioning to our attention. We have significantly modified the figure to show the electrode positioning more clearly with a top-down view.

2. Line 180 : what do the authors mean by « Q and FN conditioning trials were conducted on separate days » ? How long time between the two days ? Did they compare the Hmax/Mmax ratio between the 2 days ?

RESPONSE: Thank you for the question and opportunity to clarify. In all but 1 participant, the 2 sessions were completed within a week of each other (range 1-9 days; mean 4.2 ± 2.8); One of the participants had sessions separated by 54 days due to unanticipated travel. We have added this information for clarification to the methods (Line 196-198)

We previously reported the H/M ratio average across days and have replaced with session 1 and session 2 values separately which were very close across days, see lines 198-199 (Day 1: 0.605 ± 0.13 and Day 2: 0.615 ± 0.14, paired t-test: p = 0.43)

3. Line 200 : did the study of the influence of Q and FN stimulation onto EMG occur on the same days ? Could you clarify the time course?

RESPONSE: The Q stimulation onto Soleus H-reflex and onto EMG occurred on the same day. The FN stimulation onto the Soleus H-reflex and onto EMG occurred on same day. However, the Q and FN stimulation conditioning sessions were completed on separate days as noted above.

4. Line 413-415 : « The primary factors responsible for those exhibiting excitation due to Q stimulation remain to be identified. We speculate anatomical differences, such as more superficially positioned spindle axons, could be responsible. » Can you clarify: Is this just speculation or do you have any studies that can explain this?

RESPONSE: Thank you for the question. We are unaware of any definitive physiological evidence or specific references. Bergquist et al (2011) have nicely reviewed the spatial distribution of axons in their figure 6. We have added this reference to this speculation sentence.

Reviewer #2: Comments to the Authors:

The article entitled “Differential effect of heteronymous feedback from femoral nerve and quadriceps muscle stimulation onto Soleus H-reflex” is a research article investigating the effect of femoral nerve (FN) stimulation and quadriceps muscle belly (Q) stimulation onto soleus H-reflex and on-going EMG of soleus. The authors showed that FN stimulation elicited greater facilitation of H-reflex compared to Q stimulation. Similar effect was observed in on-going EMG of 20% maximal voluntary contraction (MVC), but not 10% MVC. Whereas heteronymous inhibition was elicited by FN stimulation and Q stimulation. From these results, the authors claim that Q stimulation is preferable choice to activate inhibitory pathway likely via Ib afferents.

The manuscript was unclear because many of measurement values did not describe in current version. So, it is difficult to support the authors’ claim. I suggest that the authors describe your data more precisely.

RESPONSE: We thank reviewer 2 for his/her time and constructive comments. We feel your important comments and questions have resulted in a better and more clear manuscript. Our goal is to thoroughly describe our methods and results. We hope your concerns are clarified from the comments that follow.

General Comments

1. To make it easier for non-experts to understand what was measured and analyzed, I strongly suggest showing representative waveforms of H-reflex and on-going EMG.

RESPONSE: We have provided raw data waveforms as illustrative examples as suggested in Figure 1C and 1D.

2. The authors described in statistical data only instead of raw data. I felt that many of individual raw data were ambiguous in this study (For example; knee extension torque induced by FN and Q stimulation, control H-reflex amplitude, M-wave amplitude of FN stimulation for MT…). These data will help replicate this study and will be beneficial in clarifying the results. Therefore, I suggest showing these measurement values.

RESPONSE: We agree with the reviewer’s thoughtful comment. Our goal is to describe our methods and results to allow replication. We provide much of the data relevant to your question is in the supporting information document (i.e. supplementary material). Background activity during the H-reflex testing was consistent across conditions; Torque was not different between Q and FN stimulation conditions (9.2 +/- 2.05 Nm and 8.89 +/- 1.87 Nm, respectively; F1,146 = 3.36, P= 0.07). This information has been added to the supporting information document. Stimulation intensities as multiples of motor threshold were provided (Q=2xMT and FN=1.6) in the original submission. We have also provided stimulation currents in mA (Q stimulation= 46 ± 10.9 mA and FN stimulation: 20.7 ± 9.5 mA) in the revised version of the manuscript (see lines 187-188). We also provide information about the Soleus M-wave and the control H-reflex sizes (FN= 54% Hmax and Q=56% Hmax) in supporting information.

3. The authors confirm the motor threshold (MT) while the knee flexed at 90° position (line 129), however, actual measurement was performed in 40° knee flexion and 60° hip flexion position. It is speculated that this posture difference affects MT. Why did the authors select this position to measure the threshold?

RESPONSE: We appreciate your observation and acknowledge we wrote this in a confusing manner. We used the 90 degree position initially to assure the stimulation produced knee extension. We verified that the criterion (palpable contraction, visible M-wave, etc.) were met in the testing position. We have updated this paragraph in the methods.

4. The authors described the MT of FN stimulation was the minimal current intensity that produced: 1) a visible M-wave on VL EMG, 2) palpable contraction in VL and VM, 3) accelerometer onset from VL below ≤20 ms from stimulation, and 4) visible motion of the hanging shank after stimulation (line 138) and the MT of Q stimulation was determined as the minimal current intensity that produced: 1) palpable contraction in VL, RF, and VM, with 2) visible motion of the shank after stimulation(line 147). How much the stimulus intensity did the authors actually used? In addition, what was the amplitude of the M-wave during FN and Q stimulation?

RESPONSE: We thank the reviewer for the question and have provided the stimulation currents in mA in this revised version (see lines 187-188, Quadriceps stimulation: 46 ± 10.9 mA and femoral nerve stimulation: 20.7 ± 9.5 mA). Regarding the M-wave amplitude, unfortunately, we do not have this data. We did not record VL EMG during the quadriceps stimulation in part because of the large stimulus artifact from the doublet, making M-wave calculation difficult to achieve. We were also challenged to properly place VL surface EMG electrodes due to the large rectangular size relative to the morphology of some participants’ thighs. We agree having a comparison of M-wave size would be ideal; as an alternative, we controlled for the mechanical output of the muscle in response to the stimulation as knee extension torque (values provided in supporting information).

5. Different stimulation pulses were used in this study, i.e., FN stimulation was used a single rectangular pulse with 1 ms duration, however, Q stimulation was used a paired pulse with 50 μs duration at 200 Hz. If the authors want to compare difference in stimulation sites, I suggest the authors should align the stimulus waveform. Did you perform that in preliminary experiment? It is unclear from the current results whether it is due to differences in stimulation sites or differences in stimulation waveforms.

RESPONSE: We thank the reviewer for the question. The muscle stimulation parameters were chosen to reduce likelihood of activation of sensory axons as referenced in methods. The femoral nerve stimulation parameters were chosen based on the traditional approach used in many prior studies (e.g., Meunier et al. 1990; Dyer et al. 2014); thus, we feel this comparison is a valid test to address the study purpose. Future work should examine whether the effects observed due to muscle stimulation would differ using other stim parameters.

While we have not evaluated quadriceps muscle stimulation with 1 ms pulse width, sensory contributions from muscle stimulation evoked contractions has previously been reported to be much smaller compared to nerve stimulation in the quadriceps (Bergquist et al. 2012) and H-reflex responses are not readily elicited with muscle stimulation (e.g. Bergquist et al 2011; Bergquist et al. 2012; Nakagawa et al., 2020). Nonetheless, we agree future work should examine the relative influence of pulse width in the methodological considerations section; In addition, we include and acknowledge evidence in which stimulation with 1 ms pulse widths of other muscle nerves (medial gatsroc, soleus) can elicit heteronymous responses attributed to sensory axons (e.g,. Horslen et al. 2017; Pierrot-Deseilligny et al. 1981). Please see end of methodological considerations paragraph in discussion (Lines 521-532)

6. It was difficult to understand the contents of the figures. What does the boxplot mean? What does the dot? What did the authors compare? Please add a more detailed explanation.

RESPONSE: We thank the reviewer for identifying this oversight. We have included a description in each of the figure captions describing what the boxplot and dots represent (i.e., box represents quartiles of data, horizontal line reflects median, and each dot is individual participant data).

7. The authors compared the results of H-reflex and on-going EMG, however the background EMG level was quite different (H-reflex, 6~10% of MVC [line 156]; on-going EMG, 10 and 20% of MVC [lines 205, 207]). I suggest examining and comparing the effects on the H-reflex when the amount of contraction is changed.

RESPONSE: We appreciate the comment. The H-reflex size is a common dependent variable used to examine the strength of a reflex pathway between two muscles. The H-reflex size recorded during a low level of background EMG (6-10%), as used in the present study, is advocated and a common approach used by many researchers (Knikou 2008; Theodosiadou et al. 2023; Stein and Thompson, 2006). Ongoing EMG is also a common dependent variable used when examining the strength of a reflex pathway between muscles. The influence of heteronymous feedback from femoral nerve onto ongoing soleus emg has been evaluated at 20% MVC (Lyle et al, 2022) and 30% MVC (Dyer et al 2014; Meunier et al. 1996). The motivation to use 10% MVC in this study was to identify whether a lower physical effort (10 vs 20% MVC) could be used to quantify excitatory and inhibitory feedback. A lower physical effort of 10% would be preferable for patient populations with residual muscle weakness. These patients can have a hard time sustaining a 20% or greater MVC.

We feel our comparison of the heteronymous effects from femoral nerve/quadriceps muscle stimulation onto the H-reflex size and ongoing EMG as described in this study are consistent with best practices. While H-reflex size could be evaluated at higher background levels in future studies, we feel that our methodological approach should adhere to best practice principles. Apologies if we do not fully understand your comment.

8. The authors claimed that the heteronymous inhibition induced by Q stimulation was similar to that by FN stimulation (Figure 4). However, Q stimulation has a large outlier at each 10% and 20% MVC (Figure 4B). Because the number of participants was small (8 participants, line 201), I feel that the results of one person have a large impact on the author's claim. If exclude this data, it may appear that there is difference in inhibition area elicited by FN stimulation and Q stimulation similar to H-reflex experiment. Therefore, it is difficult to support the authors’ claim from the current result.

RESPONSE: We appreciate the comment and agree heterogeneity with a small sample can influence results. In relation to H-reflex comparisons, the inhibition was similar between 20 and 60 ms ISI (though inhibition from FN stimulation was larger than Q at 0 ms ISI). Therefore, we have made this explicit in first paragraph of discussion.

In relation to heteronymous effects onto EMG, we have added a sentence in the results expanding upon significant main effect of stimulation location. Femoral nerve inhibition was greater than quadriceps per significant main effect. The pairwise comparisons were not different statistically possibly due to sample size and because 1 participant had larger inhibition relative to the sample for both FN and Q. We acknowledge in the discussion (methodological considerations paragraph) that the small sample size is a limitation. We do state in the discussion that overall FN caused larger inhibition than Q (see line 461-467); the statistical analysis revealed the difference was due to the 0 ms ISI with no differences found between 20 and 60 ms ISI.

Attachment

Submitted filename: Response to Reviewers.docx

Decision Letter 1

Tomoyoshi Komiyama

18 Jul 2023

PONE-D-23-13190R1Differential effect of heteronymous feedback from femoral nerve and quadriceps muscle stimulation onto Soleus H-reflexPLOS ONE

Dear Dr. Lyle,

Thank you for submitting your manuscript to PLOS ONE. After careful consideration, we feel that it has merit but does not fully meet PLOS ONE’s publication criteria as it currently stands. Therefore, we invite you to submit a revised version of the manuscript that addresses the points raised during the review process.

Please submit your revised manuscript by Sep 01 2023 11:59PM. If you will need more time than this to complete your revisions, please reply to this message or contact the journal office at plosone@plos.org. When you're ready to submit your revision, log on to https://www.editorialmanager.com/pone/ and select the 'Submissions Needing Revision' folder to locate your manuscript file.

Please include the following items when submitting your revised manuscript:

  • A rebuttal letter that responds to each point raised by the academic editor and reviewer(s). You should upload this letter as a separate file labeled 'Response to Reviewers'.

  • A marked-up copy of your manuscript that highlights changes made to the original version. You should upload this as a separate file labeled 'Revised Manuscript with Track Changes'.

  • An unmarked version of your revised paper without tracked changes. You should upload this as a separate file labeled 'Manuscript'.

If you would like to make changes to your financial disclosure, please include your updated statement in your cover letter. Guidelines for resubmitting your figure files are available below the reviewer comments at the end of this letter.

If applicable, we recommend that you deposit your laboratory protocols in protocols.io to enhance the reproducibility of your results. Protocols.io assigns your protocol its own identifier (DOI) so that it can be cited independently in the future. For instructions see: https://journals.plos.org/plosone/s/submission-guidelines#loc-laboratory-protocols. Additionally, PLOS ONE offers an option for publishing peer-reviewed Lab Protocol articles, which describe protocols hosted on protocols.io. Read more information on sharing protocols at https://plos.org/protocols?utm_medium=editorial-email&utm_source=authorletters&utm_campaign=protocols.

We look forward to receiving your revised manuscript.

Kind regards,

Tomoyoshi Komiyama, Ph.D

Academic Editor

PLOS ONE

Dear authors,

Thank you for your submitting your revised manuscript.

I think it is easier to understand than the previous version.

However, Reviewer 2 had additional comments.

Please answer these questions as listed below.

Tomoyoshi Komiyama

[Note: HTML markup is below. Please do not edit.]

Reviewers' comments:

Reviewer's Responses to Questions

Comments to the Author

1. If the authors have adequately addressed your comments raised in a previous round of review and you feel that this manuscript is now acceptable for publication, you may indicate that here to bypass the “Comments to the Author” section, enter your conflict of interest statement in the “Confidential to Editor” section, and submit your "Accept" recommendation.

Reviewer #1: All comments have been addressed

Reviewer #2: All comments have been addressed

**********

2. Is the manuscript technically sound, and do the data support the conclusions?

The manuscript must describe a technically sound piece of scientific research with data that supports the conclusions. Experiments must have been conducted rigorously, with appropriate controls, replication, and sample sizes. The conclusions must be drawn appropriately based on the data presented.

Reviewer #1: Yes

Reviewer #2: Yes

**********

3. Has the statistical analysis been performed appropriately and rigorously?

Reviewer #1: Yes

Reviewer #2: Yes

**********

4. Have the authors made all data underlying the findings in their manuscript fully available?

The PLOS Data policy requires authors to make all data underlying the findings described in their manuscript fully available without restriction, with rare exception (please refer to the Data Availability Statement in the manuscript PDF file). The data should be provided as part of the manuscript or its supporting information, or deposited to a public repository. For example, in addition to summary statistics, the data points behind means, medians and variance measures should be available. If there are restrictions on publicly sharing data—e.g. participant privacy or use of data from a third party—those must be specified.

Reviewer #1: Yes

Reviewer #2: Yes

**********

5. Is the manuscript presented in an intelligible fashion and written in standard English?

PLOS ONE does not copyedit accepted manuscripts, so the language in submitted articles must be clear, correct, and unambiguous. Any typographical or grammatical errors should be corrected at revision, so please note any specific errors here.

Reviewer #1: Yes

Reviewer #2: Yes

**********

6. Review Comments to the Author

Please use the space provided to explain your answers to the questions above. You may also include additional comments for the author, including concerns about dual publication, research ethics, or publication ethics. (Please upload your review as an attachment if it exceeds 20,000 characters)

Reviewer #1: I thank the authors for answering my questions and requests for clarification.

The manuscript is now quite clear and deserves publication in an international journal.

Reviewer #2: Comments to the Authors:

The authors have made many of the changes I suggested and the quality of the manuscript is improved, but several minor issues remain:

General Comments

The authors mentioned that excitation and inhibition elicited by FN and Q stimulation was detected by using pre-stimulus background EMG and ±1SD values (line 245~). In addition, the onset latency of excitation/inhibition was set based on the previous reports. However, I think that there are many cases where excitation/inhibition are induced other than the specified latency such as Figure 1C (Quadriceps conditioning; inhibitory like response at -30 ms, facilitatory like response at 15~20 ms). What did the authors do if the reflex was not induced at the desired latency? Did the authors measure several times? Or increase the number of stimulation and averaged? Was 1SD the appropriate for this study (Lines 247, 252)?

Specific Comments

Line 315, 335, 357: What is “a participant”? Should explain more precisely.

Line 482: Does “GTO” mean “Golgi tendon organs”?

Line 422: I cannot follow the author’s claim that Ia afferents contribute the facilitation in the current version. Please describe more why the authors considered Ia afferents contribute to the facilitation in terms that non-experts can understand.

Line 462: How did the previous reports reveal the contribution of Ib afferents to the inhibition? Please describe more why the authors considered the recurrent inhibition and Ib inhibition contribute to the inhibition in terms that non-experts can understand.

Figure 1A: The configuration of stimulation electrodes is difficult to understand from this picture. Does this picture only show the cathode? Where is the anode?

Figure 1B: The authors showed the representative waveforms elicited by FN stimulation. Please show additional waveforms elicited by Q stimulation.

Figure 1B: I think there is a stimulus artifact due to the conditioning stimulation (especially, left waveform; ISI -6 ms). Is it correct?

Figure 2A: I think the horizontal axis is not correct. The authors should describe that the ISI is different for the FN stimulation and Q stimulation as in lines 207~212.

Figure 4: Please add the representative waveforms for 10% and 20% MVIC conditions.

**********

7. PLOS authors have the option to publish the peer review history of their article (what does this mean?). If published, this will include your full peer review and any attached files.

If you choose “no”, your identity will remain anonymous but your review may still be made public.

Do you want your identity to be public for this peer review? For information about this choice, including consent withdrawal, please see our Privacy Policy.

Reviewer #1: No

Reviewer #2: No

**********

[NOTE: If reviewer comments were submitted as an attachment file, they will be attached to this email and accessible via the submission site. Please log into your account, locate the manuscript record, and check for the action link "View Attachments". If this link does not appear, there are no attachment files.]

While revising your submission, please upload your figure files to the Preflight Analysis and Conversion Engine (PACE) digital diagnostic tool, https://pacev2.apexcovantage.com/. PACE helps ensure that figures meet PLOS requirements. To use PACE, you must first register as a user. Registration is free. Then, login and navigate to the UPLOAD tab, where you will find detailed instructions on how to use the tool. If you encounter any issues or have any questions when using PACE, please email PLOS at figures@plos.org. Please note that Supporting Information files do not need this step.

PLoS One. 2023 Aug 14;18(8):e0290078. doi: 10.1371/journal.pone.0290078.r004

Author response to Decision Letter 1


25 Jul 2023

Review Comments to the Author

Reviewer #1: I thank the authors for answering my questions and requests for clarification.

The manuscript is now quite clear and deserves publication in an international journal.

RESPONSE: We thank reviewer 1 for their constructive review.

Reviewer #2: Comments to the Authors:

The authors have made many of the changes I suggested and the quality of the manuscript is improved, but several minor issues remain:

RESPONSE: We appreciate the positive feedback and your constructive review.

General Comments

The authors mentioned that excitation and inhibition elicited by FN and Q stimulation was detected by using pre-stimulus background EMG and ±1SD values (line 245~). In addition, the onset latency of excitation/inhibition was set based on the previous reports. However, I think that there are many cases where excitation/inhibition are induced other than the specified latency such as Figure 1C (Quadriceps conditioning; inhibitory like response at -30 ms, facilitatory like response at 15~20 ms).

RESPONSE: We thank the reviewer for the question. In our methods, we indicate the latency criterion (excitation onset >23 ms and inhibition onset <45 ms post the electrical stimulation) we used that is based on conduction times previously established by other authors. An additional criterion was that the excitatory and inhibitory responses had to last at least 2 ms. The “inhibitory like response at -30 ms” did not last 2 ms. The “quadriceps conditioning facilitatory like response at 15-20 ms” the reviewer questioned in Fig 2C is a stimulus artifact harmonic that occasionally happens. The three peaks you note during this region do not stay above the 1SD line for 2 ms and occur prior to the earliest possible neural effects (3rd peak at 17 ms) from activating muscle spindle axons. We have added new labels on the figure and text in the caption describing the stimulation artifact.

What did the authors do if the reflex was not induced at the desired latency? Did the authors measure several times? Or increase the number of stimulation and averaged? Was 1SD the appropriate for this study (Lines 247, 252)?

RESPONSE: Facilitatory and inhibitory reflex responses were quantified as described in the methods (i.e., excitatory: soleus EMG exceeding 1 SD above the mean background for at least 2 ms so long as after 23 ms from stimulation). We are not sure exactly what is meant by “measured several times” or “increase the number of stimulation and averaged”? The analyses were completed on the rectified soleus EMG as an ensemble average of 20 repetitions. We feel the 1 SD and 2 ms period was appropriate.

For reference from methods (lines 254-261): “Excitation onset was determined as the time point when the SOL EMG trace exceeded 1SD above the mean for ≥ 2 ms. The end of excitation was determined as the time at which the SOL EMG trace returned below the 1 SD line for a period of ≥ 2 ms. Only excitatory responses with onset ≥ 23 ms were considered as arising from heteronymous Ia facilitation [1, 5]. Inhibition onset and termination were determined as the SOL EMG moving 1SD below the mean background SOL EMG for a period of ≥ 2 ms and returning above the 1 SD line for ≥ 2 ms. Inhibitory responses were considered in analysis only if the onset was < 45 ms since the fastest transcortical effects could manifest soon thereafter [15].”

Specific Comments

Line 315, 335, 357: What is “a participant”? Should explain more precisely.

RESPONSE: The comment appears to refer to our figure captions where we use the phrase “each dot represents a participant.” We use the term participant to indicate a person that was recruited and participated in this study. We have modified the phrase to read “each dot represents an individual participant” to hopefully make clear that the data point dots represent separate persons that participated in the study.

Line 482: Does “GTO” mean “Golgi tendon organs”?

RESPONSE: Thank you for identifying the use of the abbreviation without defining this clearly in the text. We have written Golgi tendon organ for all occurrences instead of the abbreviation on lines 62 and 503.

Line 422: I cannot follow the author’s claim that Ia afferents contribute the facilitation in the current version. Please describe more why the authors considered Ia afferents contribute to the facilitation in terms that non-experts can understand.

RESPONSE: The comment is in a paragraph of the discussion that is discussing potential reasons for some participants exhibiting excitation due to quadriceps stimulation. The most widely accepted origin of excitation is from muscle spindle feedback (see Line 437: “Heteronymous excitation elicited by FN stimulation arises from activating muscle spindle axons with monosynaptic projections onto SOL motoneurons [1, 5].” We have added some additional text in the paragraph referenced in your comment and in several other paragraphs (e.g., lines 208-210; 415-417) to help explain for non-experts.

Line 462: How did the previous reports reveal the contribution of Ib afferents to the inhibition? Please describe more why the authors considered the recurrent inhibition and Ib inhibition contribute to the inhibition in terms that non-experts can understand.

RESPONSE: The papers cited are a mix of animal and human studies; we feel the methodological details are difficult to summarize for non-experts due to several approaches (e.g., nerve stimulation and recording from motoneurons in decerebrate cat; controlled pairwise muscle stretches of 2 muscles in the decerebrate cat) and beyond the scope of this paper. We feel the main ideas that apply here are that Golgi tendon organ Ib sensory axons or motor axons (evoke recurrent inhibition) can be activated directly by the stimulation current and the twitch contraction can mechanically activate Golgi tendon organ receptors. We have added text we hope helps non-experts better understand the distinction between effects elicited by current acting on sensory/motor axons and mechanical activation of Golgi tendon organ receptors (e.g. Lines 480-489).

Figure 1A: The configuration of stimulation electrodes is difficult to understand from this picture. Does this picture only show the cathode? Where is the anode?

RESPONSE: Sorry for the confusion. We specifically added a top-down view to make the electrode configuration more clear. The cathode electrode is shown for the femoral nerve electrode but the anode is positioned on the posterior buttock and not shown. We have added a note in the caption about not including the anode here. Two electrodes show the positioning of quadriceps muscle belly stimulation electrodes on the figure and are described in the caption as dotted lines. The cathode and anode specification for the quadriceps was based on the lowest intensity that resulted in a contraction of both VM and VL/RF. We have added this text to the methods section.

Figure 1B: The authors showed the representative waveforms elicited by FN stimulation. Please show additional waveforms elicited by Q stimulation.

RESPONSE: We have added Q stimulation waveforms to Figure 1B.

Figure 1B: I think there is a stimulus artifact due to the conditioning stimulation (especially, left waveform; ISI -6 ms). Is it correct?

RESPONSE: The figure shows a stimulus artifact from the tibial nerve stimulation. There is not a clear stimulus artifact seen on this waveform from the FN stimulation which is typical. Please see the Quadriceps stimulation excitatory waveform has a visible stimulation artifact since the stimuli occur just after the tibial nerve stimulation.

Figure 2A: I think the horizontal axis is not correct. The authors should describe that the ISI is different for the FN stimulation and Q stimulation as in lines 207~212.

RESPONSE: We have added text to the caption to make clear that Q stimuli were applied 2.5 ms before and after the FN single stimulus for each ISI.

Figure 4: Please add the representative waveforms for 10% and 20% MVIC conditions.

RESPONSE: Since representative waveforms illustrating the FN and Q stimulation conditions at 20% MVIC are shown in Fig 1C, we prefer to not include more waveforms here.

Attachment

Submitted filename: Response to Reviewers_Revision2.docx

Decision Letter 2

Tomoyoshi Komiyama

1 Aug 2023

Differential effect of heteronymous feedback from femoral nerve and quadriceps muscle stimulation onto Soleus H-reflex

PONE-D-23-13190R2

Dear Dr. Lyle,

We’re pleased to inform you that your manuscript has been judged scientifically suitable for publication and will be formally accepted for publication once it meets all outstanding technical requirements.

Within one week, you’ll receive an e-mail detailing the required amendments. When these have been addressed, you’ll receive a formal acceptance letter and your manuscript will be scheduled for publication.

An invoice for payment will follow shortly after the formal acceptance. To ensure an efficient process, please log into Editorial Manager at http://www.editorialmanager.com/pone/, click the 'Update My Information' link at the top of the page, and double check that your user information is up-to-date. If you have any billing related questions, please contact our Author Billing department directly at authorbilling@plos.org.

If your institution or institutions have a press office, please notify them about your upcoming paper to help maximize its impact. If they’ll be preparing press materials, please inform our press team as soon as possible -- no later than 48 hours after receiving the formal acceptance. Your manuscript will remain under strict press embargo until 2 pm Eastern Time on the date of publication. For more information, please contact onepress@plos.org.

Kind regards,

Tomoyoshi Komiyama, Ph.D

Academic Editor

PLOS ONE

Additional Editor Comments (optional):

Dear authors,

Thank you for submitting your revised manuscript.

I think it was much easier to understand than the original manuscript.

I am satisfied with the responses and the edits, I am happy to accept this manuscript.

The authors have replied to my remaining questions satisfactorily from two reviewers.

Therefore, I have no further comments to make, all of my previous concerns were adequately addressed.

This manuscript will be satiating the reader's interest.

Tomoyoshi Komiyam

Reviewers' comments:

Reviewer's Responses to Questions

Comments to the Author

1. If the authors have adequately addressed your comments raised in a previous round of review and you feel that this manuscript is now acceptable for publication, you may indicate that here to bypass the “Comments to the Author” section, enter your conflict of interest statement in the “Confidential to Editor” section, and submit your "Accept" recommendation.

Reviewer #2: All comments have been addressed

**********

2. Is the manuscript technically sound, and do the data support the conclusions?

The manuscript must describe a technically sound piece of scientific research with data that supports the conclusions. Experiments must have been conducted rigorously, with appropriate controls, replication, and sample sizes. The conclusions must be drawn appropriately based on the data presented.

Reviewer #2: Yes

**********

3. Has the statistical analysis been performed appropriately and rigorously?

Reviewer #2: Yes

**********

4. Have the authors made all data underlying the findings in their manuscript fully available?

The PLOS Data policy requires authors to make all data underlying the findings described in their manuscript fully available without restriction, with rare exception (please refer to the Data Availability Statement in the manuscript PDF file). The data should be provided as part of the manuscript or its supporting information, or deposited to a public repository. For example, in addition to summary statistics, the data points behind means, medians and variance measures should be available. If there are restrictions on publicly sharing data—e.g. participant privacy or use of data from a third party—those must be specified.

Reviewer #2: Yes

**********

5. Is the manuscript presented in an intelligible fashion and written in standard English?

PLOS ONE does not copyedit accepted manuscripts, so the language in submitted articles must be clear, correct, and unambiguous. Any typographical or grammatical errors should be corrected at revision, so please note any specific errors here.

Reviewer #2: Yes

**********

6. Review Comments to the Author

Please use the space provided to explain your answers to the questions above. You may also include additional comments for the author, including concerns about dual publication, research ethics, or publication ethics. (Please upload your review as an attachment if it exceeds 20,000 characters)

Reviewer #2: Comments to the Authors:

I thank the authors for addressing my previous concerns. Below are my last comments:

Specific Comments

Line 325, 348, 370: “Each dot represents an individual participant”

I think the sentence “mean value of excitation and/or inhibition for each participant” is more appropriate rather than “an individual participant”.

Figure 1: The term “Stimulus artifact” is unclear. Please describe what stimulation caused the artifact (i.e., tibial nerve stimulation, femoral nerve stimulation, quadriceps stimulation). I think that showing the timing of stimulation will help the reader understand the experimental protocol.

**********

7. PLOS authors have the option to publish the peer review history of their article (what does this mean?). If published, this will include your full peer review and any attached files.

If you choose “no”, your identity will remain anonymous but your review may still be made public.

Do you want your identity to be public for this peer review? For information about this choice, including consent withdrawal, please see our Privacy Policy.

Reviewer #2: No

**********

Acceptance letter

Tomoyoshi Komiyama

4 Aug 2023

PONE-D-23-13190R2

Differential effect of heteronymous feedback from femoral nerve and quadriceps muscle stimulation onto Soleus H-reflex

Dear Dr. Lyle:

I'm pleased to inform you that your manuscript has been deemed suitable for publication in PLOS ONE. Congratulations! Your manuscript is now with our production department.

If your institution or institutions have a press office, please let them know about your upcoming paper now to help maximize its impact. If they'll be preparing press materials, please inform our press team within the next 48 hours. Your manuscript will remain under strict press embargo until 2 pm Eastern Time on the date of publication. For more information please contact onepress@plos.org.

If we can help with anything else, please email us at plosone@plos.org.

Thank you for submitting your work to PLOS ONE and supporting open access.

Kind regards,

PLOS ONE Editorial Office Staff

on behalf of

Dr. Tomoyoshi Komiyama

Academic Editor

PLOS ONE

Associated Data

    This section collects any data citations, data availability statements, or supplementary materials included in this article.

    Supplementary Materials

    S1 Fig. Scatter plots showing correlation of heteronymous excitation examined by H-reflex and SOL background EMG 10% on left and 20% on right.

    (EPS)

    S2 Fig. Scatter plots showing correlation of heteronymous inhibition examined by H-reflex and SOL background EMG 10% on left and 20% on right.

    (EPS)

    S1 File. Supporting information.

    (DOCX)

    Attachment

    Submitted filename: Response to Reviewers.docx

    Attachment

    Submitted filename: Response to Reviewers_Revision2.docx

    Data Availability Statement

    All relevant data are within the paper and its Supporting information files.


    Articles from PLOS ONE are provided here courtesy of PLOS

    RESOURCES