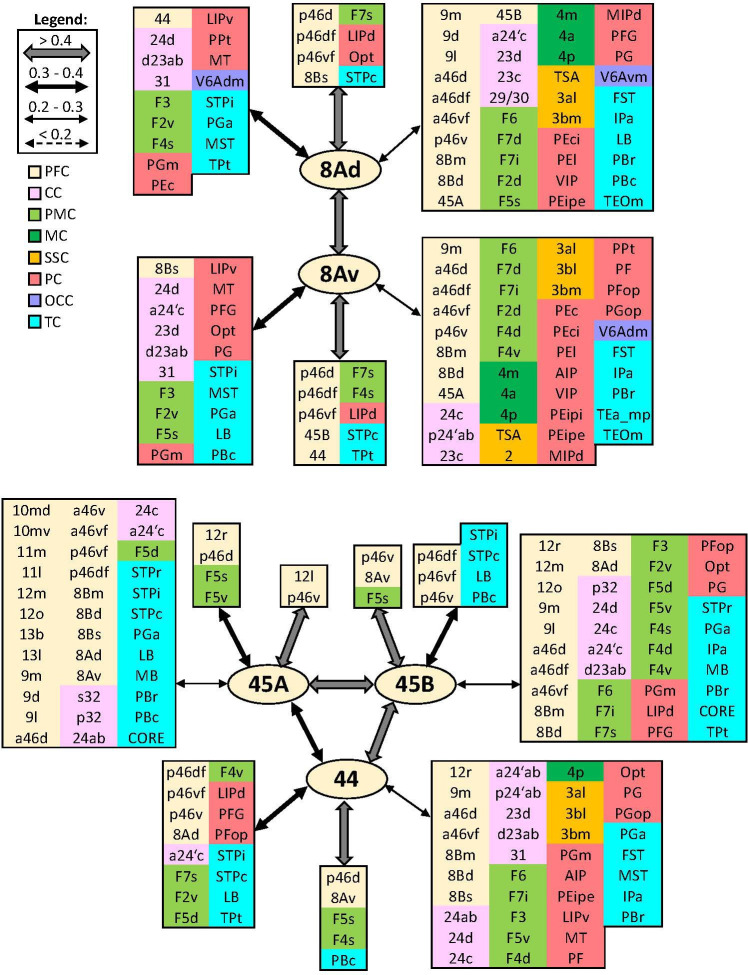
Figure 15. Schematic summary of the functional connectivity analysis between subdivisions of areas 8A and 45, and area 44.
Legend shows the strength of the functional connectivity coefficient (z) is coded by the appearance (wider-thinner-doted) of the connecting arrows. Areas related to different brain region are marked on the scheme with distinct colours; prefrontal cortex (PFC) in light yellow, cingulate cortex (CC) in pink, premotor cortex (PMC) in light green, motor cortex (MC) in dark green, somatosensory cortex (SSC) in orange, parietal cortex (PC) in red, occipital cortex (OCC) in purple, and temporal cortex (TC) in light blue.

