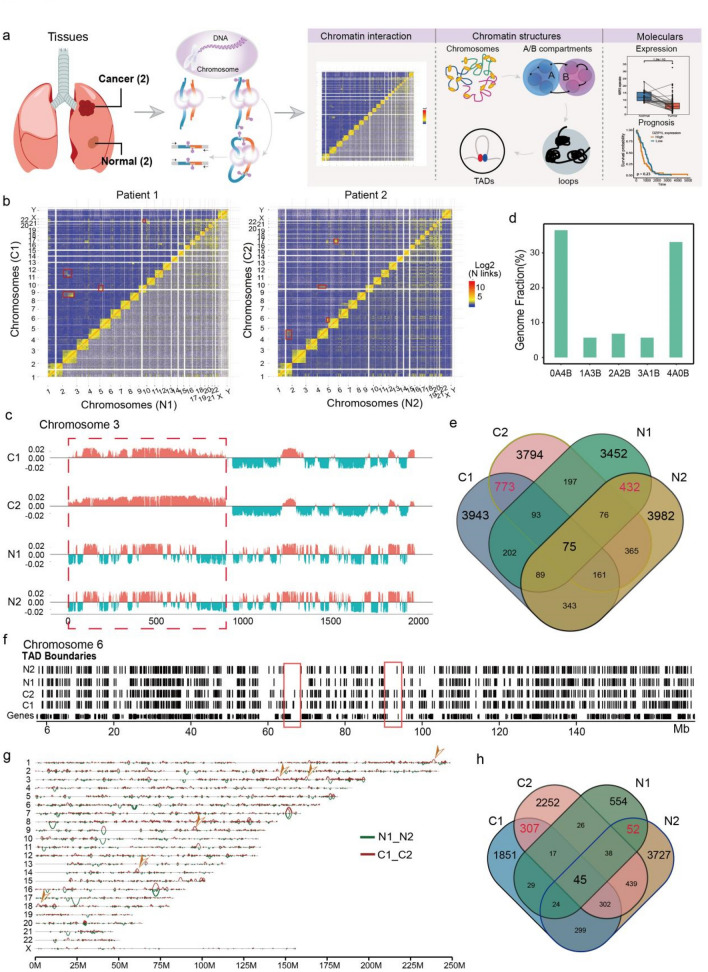
Fig. 1.
Global features of 3D Genome Organization in two LUAD and normal tissues a Sample information and analysis workflow of this study. b Chromatin interaction heatmap of all genome in tumor (C1 and C2) and normal tissues (N1 and N2), and obviously translocation sites were signed by red box. c Genome browser snapshot showing compartment A/B patterns (PC1 value) across Chr3 in four samples. Positive PC1 in red corresponds to compartment A, and negative PC1 in green corresponds to compartment B. Red box representing the significant compartmental transition region on Chr3. d Bar plots showing the degree of conservation of A/B compartment labels of four samples. The y axis is the fraction of the genome conserved by the five possible combinations of compartment A/B designations. The label below each bar represents the composition of the compartment designations. For example, ‘‘1A3B’’ represents the genomic region where one sample exhibits a compartment A label and the other three samples exhibit a compartment B label. e Venn plot showing the overlap of identified TADs in four samples. The red numbers represent the overlapped TADs in tumor and normal tissues. f Genome browser snapshot showing topological domain boundaries across Chr6 in four samples. Boundaries are identified at 40-kb bin resolution, and cancer specific genome regions were signed by red box. g Genome browser snapshot showing chromatin loop across all chromosomes in tumor and normal tissues, and tumor specific loop was marked by yellow arrow. h Venn plot showing the overlap of identified loops in four samples. The red numbers represent the overlapped loops in tumor and normal tissues

