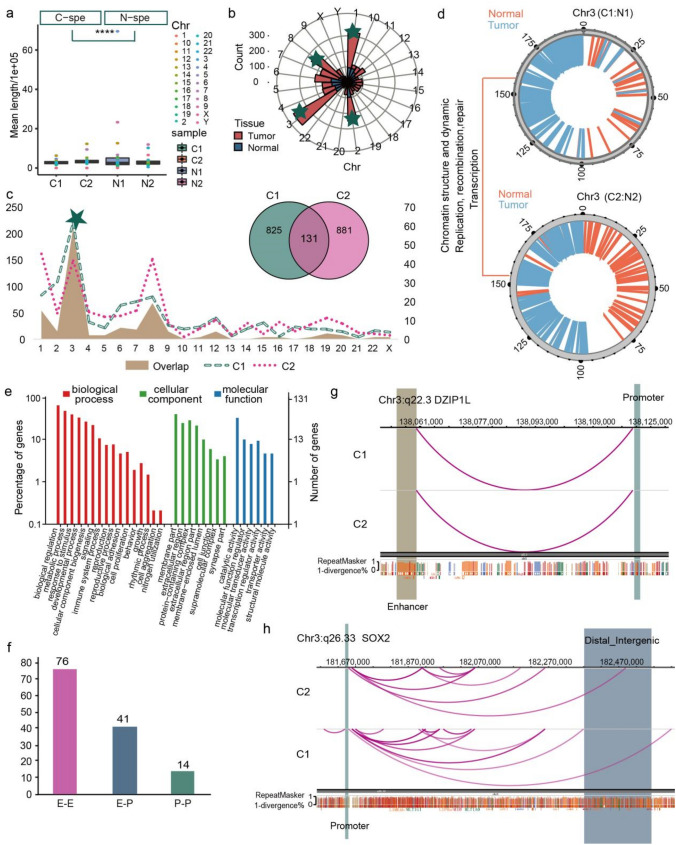
Fig. 4.
Distinct chromatin enhancer–promoter loops were identified in LUAD tissues a Boxplot showing the mean length distribution of tumor and normal specific loops in each sample. T-test was used to calculate the significant difference, ****p < 0.0001. b Polar diagram showing the number of tumor and normal tissue specific loops in each chromosome, and the top four chromosomes were marked by green five-pointed star. c Statistics distribution chart showing the different loops between paired tumor and normal tissues as well as the overlapped loops between two tumor samples in each chromosome, and green five-pointed star signed the Chr3, which with the most number of different and overlapped loops. Venn plot showing the number of overlapped and sample specific loops. d Distribution of tumor and normal specific loops on genome of Chr3, showing the function of these genome regions. e GO enrichment analysis of the tumor specific loops related genes. f Barplot showing the number of different loop type of the 131 overlapped loops in tumor tissues. g Genome browser snapshot of chromatin loop with the annotation of the end anchors at DZIP1L locus, the brown bar represents the enhancer domain of gene, the green bar represents the promoter domain, and the blue bar is the distal enhancers. h The same visualization with g at the SOX2 locus

