

Abstract
Objective:
Minimally traumatic surgical techniques and advances in cochlear implant (CI) electrode array designs have allowed acoustic hearing present in a CI candidate prior to surgery to be preserved post-operatively. As a result, these patients benefit from combined electric-acoustic stimulation (EAS) post-operatively. However, 30–40% of EAS CI users experience a partial loss of hearing up to 30 dB after surgery. This additional hearing loss is generally not severe enough to preclude use of acoustic amplification; however, it can still impact EAS benefits. The use of electrocochleography (ECoG) measures of peripheral hair cell and neural auditory function have shed insight into the pathophysiology of post-implant loss of residual acoustic hearing. The present study aims to assess the long-term stability of ECoG measures and to establish ECoG as an objective method of monitoring residual hearing over the course of EAS CI use. We hypothesize that repeated measures of ECoG should remain stable over time for EAS CI users with stable post-operative hearing preservation. We also hypothesize that changes in behavioral audiometry for EAS CI users with loss of residual hearing should also be reflected in changes in ECoG measures.
Design:
A pool of 40 subjects implanted under hearing preservation protocol was included in the study. Subjects were seen at post-operative visits for behavioral audiometry and ECoG recordings. Test sessions occurred 0.5, 1, 3, 6, 12 months, and annually after 12 months post-operatively. Changes in pure-tone behavioral audiometric thresholds relative to baseline were used to classify subjects into two groups: one group with stable acoustic hearing and another group with loss of acoustic hearing. At each test session, ECoG amplitude growth functions for several low-frequency stimuli were obtained. The threshold, slope, and suprathreshold amplitude at a fixed stimulation level was obtained from each growth function at each time point. Longitudinal linear mixed effects models were used study trends in ECoG thresholds, slopes, and amplitudes for subjects with stable hearing and subjects with hearing loss.
Results:
Preoperative, behavioral audiometry indicated that subjects had an average low-frequency pure tone average (125 to 500 Hz) of 40.88 ± 13.12 dB HL. Postoperatively, results showed that ECoG thresholds and amplitudes were stable in EAS CI users with preserved residual hearing. ECoG thresholds increased (worsened) while ECoG amplitudes decreased (worsened) for those with delayed hearing loss. The slope did not distinguish between EAS CI users with stable hearing and subjects with delayed loss of hearing.
Conclusions:
These results provide a new application of post-operative ECoG as an objective tool to monitor residual hearing and understand the pathophysiology of delayed hearing loss. While our measures were conducted with custom-designed in-house equipment, cochlear implant companies are also designing and implementing hardware and software adaptations to conduct ECoG recordings. Thus, post-operative ECoG recordings can potentially be integrated into clinical practice.
Keywords: Electrocochleography, Hybrid, Electric-Acoustic Simulation, Hearing Preservation
INTRODUCTION
Surgical techniques and cochlear implant (CI) electrode array designs have evolved in the last two decades to the extent that acoustic hearing present in a CI candidate prior to surgery can be preserved post-operatively. As a result, these patients benefit from combined electric-acoustic stimulation (EAS) post-operatively, where the electrode array provides electrical stimulation of the auditory nerve and an integrated hearing aid provides acoustic amplification. Since the proof of concept was demonstrated in the late 1990s (von Ilberg et al 1999; Gantz & Turner 2003), studies in the last two decades have consistently shown the benefits of EAS over conventional electrical-only stimulation for speech understanding in noise (Turner et al, 2004; Tejani & Brown 2020), perception of spectral and temporal cues (Gifford et al. 2008, 2010; Golub et al 2012; Tejani & Brown, 2020), music appreciation (Gfeller et al. 2006; Brockmeier et al. 2010), and localization (Dunn et al, 2010).
The benefits of EAS are maximized if residual acoustic hearing is successfully preserved long-term. It is critical for audiologists to conduct behavioral pure-tone audiometric testing longitudinally to monitor hearing thresholds and program the hearing aid portion of the EAS sound processors appropriately. Cochlear Nucleus L24 Hybrid CI users can generally maintain stable low-frequency audiometric thresholds (125, 250, and 500 Hz) of 50 – 70 dB HL up to five years post-surgery (Gantz et al, 2017; Roland et al, 2018), which is within the capabilities of the integrated hearing aid to provide amplification. However, about 30–40% of EAS CI users experience a partial loss up to 30 dB immediately and/or several months after surgery. In most cases, this additional hearing loss is not severe enough to preclude use of acoustic amplification (Lenarz et al. 2013; Van Abel et al. 2015; Scheperle et al. 2017; Pillsbury et al. 2018; Roland et al. 2018), but the loss of hearing can have a negative effect on performance and is an outcome that clinicians and researchers attempt to minimize.
Several theories are present as to why EAS CI users lose hearing post-operatively. Hearing loss immediately after surgery may result from insertion / structural trauma (Adunka et al, 2010). Delayed hearing loss that occurs months after surgery could be due to intracochlear fibrosis / osteoneogenesis (O’Leary et al. 2013; Quesnel et al. 2016; Foggia et al, 2019; Tejani et al, 2022) which could affect cochlear mechanics (Choi & Oghalai 2005). Histological data have also suggested compromised endocochlear potentials (Tanaka et al. 2014; Reiss et al. 2015) while not implicating hair cell / neural damage. Hair cell, neural, pre-synaptic ribbon counts, and post-synaptic receptor counts are stable post-loss of acoustic hearing (O’Leary et al. 2013; Tanaka et al. 2014; Reiss et al. 2015; Quesnel et al. 2016; but see Li et al. 2020 who reported cochlear neuropathy/synaptopathy).
To address some of these theories, our institution has used electrocochleography (ECoG) as an objective electrophysiological tool to assess peripheral auditory function in EAS CI users (Abbas et al. 2017; Kim et al. 2018; Tejani et al. 2019, 2021; see Eggermont 2017 for review on ECoG). The cochlear microphonic (CM) portion of the electrocochleogram reflects hair cell function, while the auditory nerve neurophonic (ANN) represents sustained phase-locked neural activity. Two other components of the electrocochleogram are the summating potential (SP) and the compound action potential (CAP). The SP presents as a baseline shift and may contain both hair cell and neural contributions (Pappa et al. 2019) while the CAP is a neural response occurring at the stimulus onset and offset. The underlying rational for use of ECoG in EAS studies is that both hair cell and neural function can be assessed in response to acoustic stimulation, thereby providing an objective measure of residual acoustic auditory function. Thus, changes in hair cell potentials and/or neural potentials with loss of residual hearing could shed light on hearing loss etiologies (e.g., Tejani et al, 2021).
Previous studies from our institution and others have validated ECoG as a potential tool to assess residual hearing and cochlear function. CM and ANN thresholds correlate strongly with behavioral audiometric thresholds (Abbas et al, 2017; Koka et al, 2017), which can aid with programming the hearing aid portion of the EAS sound processor (Agrawal et al, 2021). Intraoperative measures of ECoG are used to guide cochlear implantation to minimize cochlear trauma (Bester et al, 2021; Lenarz et al, 2022) and have been shown to correlate with post-operative speech understanding (Fontenot et al, 2019; Canfarotta et al, 2021; Walia et al, 2022). One important aspect of ECoG that hasn’t been sufficiently validated is the long-term stability of these measures. Our previous studies have mainly focused on test-retest reliability of ECoG thresholds at two time points for EAS patients with stable hearing and EAS patients with loss of hearing. These studies also presented limited longitudinal suprathreshold ECoG amplitude data (Abbas et al, 2017; Kim et al 2018; Tejani et al, 2019). These data did indeed show that ECoG measures are stable at two time points for EAS patients with stable hearing while changes in ECoG did mirror changes in behavioral audiometry for EAS patients with fluctuating acoustic hearing or loss of acoustic hearing. However, if ECoG is to be used as an objective method of monitoring residual hearing over the course of EAS CI use, then repeated measures of these potentials should remain stable over time for EAS CI users with stable post-operative hearing preservation. Additionally, changes in behavioral audiometry for EAS CI users with loss of residual hearing should also be reflected in changes in ECoG measures.
METHODS
This study was approved by the University of Iowa Institutional Review Board (IRB 201805740). Subjects signed an informed consent form. Deidentified raw and analyzed data are publicly available on the Open Science Framework via the following link https://osf.io/3v87p/?view_only=fa2996ea6904451ea8441ee64795b4e9.
Subject Population and Classification
A pool of 40 subjects implanted with Cochlear Corporation electrode arrays were included in this study. They were all implanted between the years 2006 and 2021. All subjects were adults who presented with significant residual acoustic hearing at time of implantation. The average pre-operative low-frequency pure tone average (PTA) of 125 to 500 Hz was 40.88 ± 13.12 dB HL.
Subjects were seen at several time points post-operatively for both behavioral audiometry and ECoG recordings. Time points included 0.5, 1, 3, 6, 12 months, and annually after 12 months, though not all subjects were tested at all time points and there were subjects enrolled into the study years post-surgery. While behavioral audiometry was done at initial activation, ECoG recordings were not done at that time point. Changes in pure-tone audiometric thresholds relative to the baseline appointment were used to classify subjects into two groups: one group of subjects with stable acoustic hearing and another group of subjects with loss of acoustic hearing. The baseline appointment was the first appointment at which both audiometry and ECoG recordings were done. In clinical audiometric assessments, there is a ± 5 dB test-retest variability, with hearing threshold changes greater than 5 dB suggesting clinical significance (e.g., Stuart et al, 1991). Thus for purposes of subject classification, loss of acoustic hearing was defined as a > 5 dB decline in behavioral threshold between the subject’s most recent appointment and the baseline appointment. We focused on 250, 500, 750, and 1000 Hz audiometry and, as explained in more details in a subsequent section, we conducted analyses for each frequency separately. Thus, the number of subjects in the stable vs hearing loss group may differ for each frequency.
Table 1 describes subject demographics in more detail, including array type, classification into stable vs hearing loss group, the use of intraoperative ECoG monitoring, and electrode insertion depth. The last two variables are explained in the next section.
Table 1:
Subject Demographics
| PTA = Pure Tone Average, S = Stable Hearing, HL = Hearing Loss | |||||||||||||
|---|---|---|---|---|---|---|---|---|---|---|---|---|---|
| Subject ID | Gender | Ear | Pre-op PTA (125 – 500 Hz) | Array | Implant Date | ECoG monitoring? | Full or Partial Insertion? | Age at Activation (years) | Time points tested post CI activation (months) | 250 Hz Category | 500 Hz Category | 750 Hz Category | 1000 Hz Category |
| A8 | F | R | 18 | S8 | 05/11/2006 | N | Full | 55 | 156, 169 | S | S | S | S |
| L3R | F | R | 45 | L24 | 5/6/2010 | N | Full | 40 | 109, 122 | HL | HL | S | S |
| T10L | F | L | 27 | S12 | 12/10/2010 | N | Full | 41 | 100, 113 | S | S | S | S |
| L13L | F | L | 52 | L24 | 11/9/2012 | N | Full | 46 | 72,81,85 | S | S | S | S |
| T12L | M | L | 20 | S12 | 11/21/2013 | N | Full | 59 | 54, 72 | S | HL | S | S |
| L17L | F | L | 37 | L24 | 11/22/2013 | N | Full | 55 | 72, 84 | S | S | S | S |
| L25L | M | L | 42 | L24 | 8/28/2014 | N | Full | 18 | 55, 60 | S | S | S | S |
| S35L | F | L | 48 | 422 | 9/29/2014 | N | Full | 72 | 60, 72 | S | S | S | S |
| S44R | M | R | 58 | 422 | 2/16/2015 | N | Full | 66 | 37, 49 | S | S | HL | S |
| S36R | M | R | 55 | 422 | 2/27/2015 | N | Full | 73 | 36, 48 | S | S | S | S |
| L33L | F | L | 25 | L24 | 5/15/2015 | N | Full | 62 | 49, 61 | S | S | S | S |
| L44R | M | R | 30 | L24 | 12/4/2015 | N | Full | 52 | 36, 48 | S | HL | HL | S |
| L43R | F | R | 43 | L24 | 6/17/2016 | N | Full | 76 | 36, 48 | S | S | HL | S |
| S12RW-3L | F | L | 21 | S12RW | 12/1/2016 | N | Full | 64 | 6, 12 | S | S | S | S |
| L66R | M | R | 40 | L24 | 4/21/2017 | N | Full | 77 | 12, 22 | HL | S | S | S |
| L67R | F | R | 47 | L24 | 5/11/2017 | N | Full | 63 | 23, 38 | S | S | S | S |
| L77R | M | R | 35 | L24 | 8/21/2017 | N | Full | 77 | 26, 35 | HL | HL | HL | HL |
| L80R | M | R | 22 | L24 | 5/3/2018 | Y | Full | 71 | 0.5, 1, 3 | S | S | S | S |
| L81R | F | R | 27 | L24 | 6/11/2018 | Y | Full | 68 | 0.5, 1, 3, 6 | HL | HL | HL | HL |
| S12RW-6R | M | R | 33 | S12RW | 10/15/2018 | Y | Full | 36 | 0.5, 1, 3, 6, 12 | S | HL | HL | HL |
| L86R | M | R | 41 | L24 | 1/4/2019 | Y | Full | 22 | 0.5, 1, 3, 6 | S | S | S | S |
| 522–11L | F | L | 37 | 522 | 7/22/2019 | Y | Full | 53 | 0.5, 1 | S | S | S | S |
| 622–2R | F | R | 63 | 622 | 11/14/2019 | Y | Full | 70 | 0.5, 1, 3 | S | S | S | S |
| 622–3R | M | R | 47 | 622 | 11/21/2019 | Y | Full | 82 | 0.5, 1, 3 | S | S | S | S |
| 624–20R | F | R | 35 | 624 | 1/15/2020 | Y | Full | 62 | 0.5, 1, 3, 6, 12 | HL | HL | HL | HL |
| 622–5R | M | R | 43 | 622 | 1/23/2020 | Y | 3 Electrodes Extracochlear | 60 | 0.5, 1, 6, 12 | S | S | S | S |
| 624–1R | M | R | 46 | 624 | 5/1/2020 | Y | Full | 66 | 0.5, 1, 3, 9 | HL | HL | HL | HL |
| 624–2R | M | R | 60 | 624 | 5/7/2020 | Y | Full | 42 | 0.5, 1, 3, 6 | HL | HL | HL | HL |
| 624–4R | M | R | 65 | 624 | 6/5/2020 | Y | Full | 62 | 0.5, 1, 3, 8 | HL | HL | HL | HL |
| 624–6R | F | R | 53 | 624 | 6/25/2020 | Y | Full | 74 | 0.5, 1, 3, 6 | S | S | S | S |
| 624–8R | M | R | 43 | 624 | 7/9/2020 | Y | Full | 61 | 0.5, 1, 7 | S | S | S | S |
| 624–9L | M | L | 55 | 624 | 7/17/2020 | Y | Full | 72 | 0.5, 1, 3, 6 | S | S | S | S |
| 624–11R | F | R | 43 | 624 | 8/28/2020 | Y | Full | 62 | 0.5, 1 | S | S | S | S |
| 624–12L | F | L | 35 | 624 | 09/10/20 | Y | Full | 70 | 0.5, 1, 3, 12 | HL | HL | S | S |
| 624–13L | F | L | 30 | 624 | 10/23/2020 | Y | Full | 34 | 0.5, 1, 3, 8 | HL | HL | HL | HL |
| 624–15R | M | R | 52 | 624 | 11/12/2020 | Y | Full | 78 | 0.5, 1 | S | S | S | S |
| 624–16L | F | L | 62 | 624 | 12/4/2020 | Y | Full | 38 | 0.5, 1, 3 | HL | HL | S | S |
| 624–18L | F | L | 27 | 624 | 12/10/2020 | Y | Full | 64 | 0.5, 1, 3 | S | HL | S | S |
| 624–19R | M | R | 20 | 624 | 12/18/2020 | Y | 3 Electrodes Extracochlear | 19 | 0.5, 1 | S | S | HL | S |
| 624–21L | M | L | 53 | 624 | 3/5/2021 | Y | Full | 56 | 0.5, 1, 3, 6 | S | S | S | S |
Cochlear Implantation
Various Cochlear Corporation electrode arrays were used in this study, including the S8 / S12 / L24 Hybrids arrays, CI 422/522/622 slim lateral wall arrays, and the CI 624 Slim 20. Table 2 describes the arrays in detail, including length, insertion depth, and number of electrodes.
Table 2:
Hybrid and Standard Electrode Array Dimensions
| Array | Number of Electrodes | Active Array Length (mm) | Insertion Depth (mm) | No of Subjects Implanted |
|---|---|---|---|---|
| S8 Hybrid * | 6 | 4.05 | 10 | 1 |
| S12 Hybrid * | 10 | 5.7 | 10 | 2 |
| S12RW Hybrid * | 10 | 7.5 | 12 | 2 |
| L24 Hybrid † | 22 | 14.35 | 16 | 13 |
| 422/522/622 (Slim Lateral Wall) § | 22 | 19.1 | 20–25¶ | 7 |
| 624 (Slim 20) § | 22 | 19.1 | 20 | 15 |
Investigational Device
Initially Investigational, but now Commercially Available Device
Commercially Available
Generally inserted to 20 mm at University of Iowa
Implantation was performed by authors BJG and MRH at the University of Iowa Hospitals and Clinics under hearing preservation protocols using soft insertion techniques. Subjects received intravenous dexamethasone during surgery, a 1-week course of prednisone (1 mg/kg/day) beginning immediately postoperatively, and a second 1-week course beginning the day prior to activation of the CI. The steroids were an attempt to reduce inflammatory responses and subsequent loss of hearing that may be associated with surgical trauma (e.g., Rauch et al. 2011). Subjects implanted prior to 2013 were implanted via a cochleostomy while later subjects were implanted via the round window in attempts to minimize cochlear trauma (e.g., Adunka et al. 2004). At the end of insertion, the electrode array was secured to the tegmen mastoideum to reduce chances of electrode migration and ensure stability of the intracochlear array. Cochlear implantation of recent patients was also done in conjunction with intraoperative ECoG measures to guide insertion trajectory and depth (Lenarz et al, 2022; Bester et al, 2021); in two cases partial electrode insertions were purposely performed to attempt to preserve residual acoustic hearing. Table 1 indicates which subjects were implanted in conjunction with intraoperative ECoG and which two subjects had partial insertions performed.
Electrococheography Recordings
Recordings were performed using a custom in-house system that utilizes Python programming and version 2 of the Nucleus Implant Communicator (NIC) routines. These programs were used to trigger acoustic stimulation and record a response from an intracochlear electrode (see Tejani et al, 2019 for specific details on software and hardware adaptations). The stimuli were low-frequency tone bursts that were presented to the implanted ear via an insert earphone. Presentation levels ranged from below behavioral detection threshold to the maximal comfort level. A response was recorded from the most apical electrode in the array. Stimuli were 24-ms tone bursts with a 1-cycle rise / fall time, or 1 ms, whichever was longer, shaped by a cosine-squared window. Stimuli were presented at a 10-Hz stimulation rate in both condensation and rarefaction polarities. Stimuli frequencies were 250, 500, 750, and 1000 Hz.
Recordings were repeated at several time points after activation of the CI, typically coinciding with clinical checkup appointments. Time points included 0.5, 1, 3, 6, 12 months, and annually after 12 months. Exact time points varied based on each subject’s availability. Subjects were also seen for interim appointments if they experienced a loss of acoustic hearing. Additionally, while recordings were attempted for all stimulus frequencies, we focused on 500 Hz if there were time / subject availability limitations.
Statistical Analysis
ECoG recordings were done at several levels from behavioral threshold level to the maximal comfort levels. Our stimulation levels were calibrated in dB SPL when the recordings were performed. Prior to data analysis, levels were converted to dB HL, consistent with behavioral audiometric thresholds. CM and ANN amplitudes were plotted as a function of stimulus level to construct amplitude growth functions. As detailed in the “Electrococheography Amplitude Growth Functions” section of the results section, three parameters were extracted – threshold, slope, and suprathreshold amplitude at a fixed level. These parameters were extracted for all amplitude growth functions at all test frequencies that were collected at every appointment. Changes in threshold, slope, and amplitude at each appointment were calculated relative to baseline. These three metrics served as the dependent variable as part of a linear mixed effects model (LME). The change in each dependent variable over time was evaluated separately with LME models for two groups of subjects: subjects with stable hearing and subjects with loss of hearing. For each LME model the deviation from baseline of the dependent variable was the response variable, the fixed effect was time from baseline, and subject was the random effect. No intercepts were included in the model to force the model to pass through the baseline datapoint. In other words, only slope was considered for the fixed and random effects. Significance values were adjusted using the False Discovery Rate to minimize potential Type I errors from repeated analyses.
RESULTS
Electrococheography Amplitude Growth Functions
Responses to condensation and rarefaction stimuli were subtracted from one another to emphasize the CM and added to one another to emphasize the ANN (Aran and Charlet de Sauvage 1976; Henry 1995; Lichtenhan et al. 2013). As later explained, this difference and summation technique does not result in a pure separation of CM and ANN (Forgues et al. 2014; Abbas et al. 2017), thus we hereafter refer to the potentials as CM/DIFF and ANN/SUM. A Fast Fourier Transform (FFT) analysis of the time domain data into the frequency domain was then performed, resulting in a resolution of 37.74 Hz/bin.
Figure 1 shows an example recording from one subject (622–5R) who was seen at his 12-month appointment. The top left panel shows the resulting response to both condensation and rarefaction polarities for a 500 Hz tone burst. The top middle and top right panels show the resulting CM/DIFF and ANN/SUM recordings. The CM/DIFF waveform oscillates at a 500 Hz frequency while the ANN/SUM waveform oscillates at a 1000 Hz frequency. In addition to the CM and ANN components, there is also evidence of a compound action potential in the ANN/SUM recording, with a latency of about 4 ms. The bottom left, middle. and right panels show the resulting FFT for each recording. Note for the bottom left panel, there are peaks at the fundamental (500 Hz) and all harmonics of the stimulus up to 2000 Hz. For the bottom middle and right panels, note there is a peak at the stimulus frequency for the CM/DIFF and a peak at twice the stimulus frequency for the ANN/SUM. In addition, higher order harmonics are sometimes present due to distortions in the hair cell and neural signal transduction process. More specifically, the summation / difference technique used here does not result in a complete separation of the CM and ANN. Asymmetries in the CM (particularly at high stimulation levels above threshold) result in peaks at the second harmonic (in this case 1000 Hz) in addition to 500 Hz. With respect to the ANN, a majority of the response is periodic with the stimulus frequency (500 Hz). The energy present at the second harmonic (1000 Hz) is the result of asymmetric distortions of the phase-locked neural responses, which occur at each phase of stimulation for condensation and rarefaction stimulation (Forgues et al, 2014).
Figure 1.
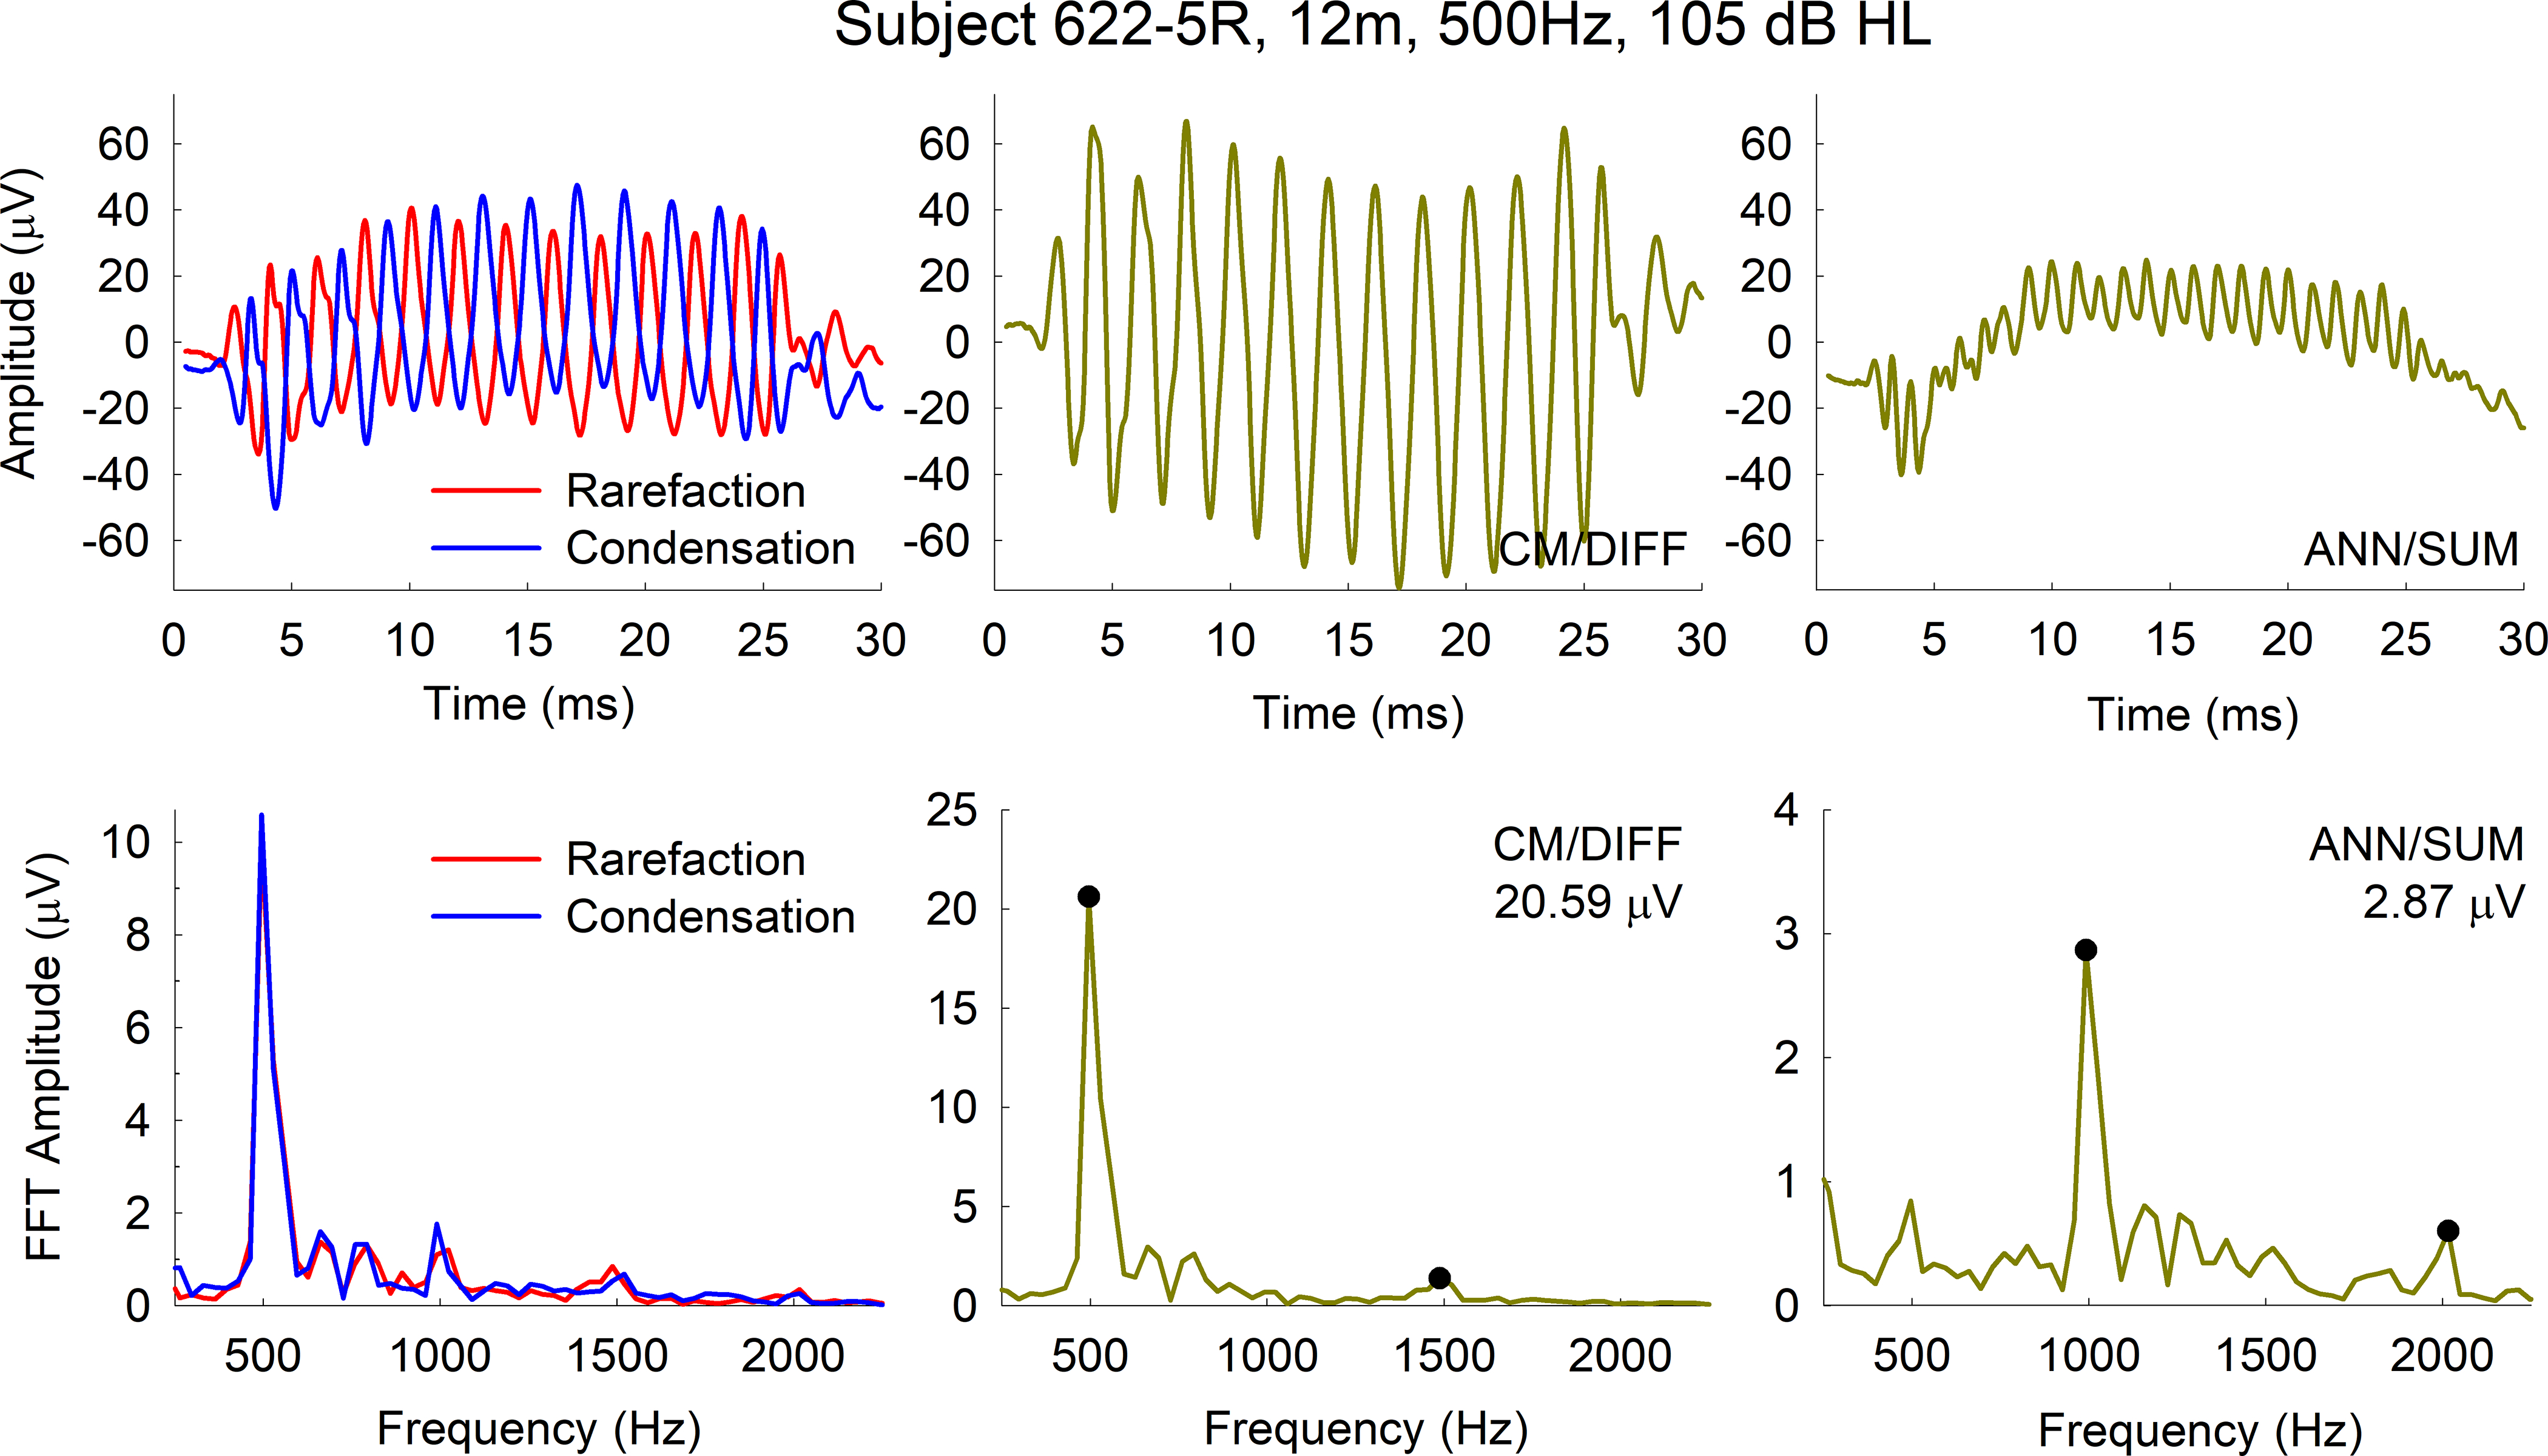
Figure 2 shows amplitude growth functions for the CM/DIFF and ANN/SUM recordings for the same subject (622–5R, top panels) as well as two additional subjects (624–6R, middle panels; 624–1R, bottom panels). The peaks of the FFT at the stimulus frequency for the CM/DIFF recordings were used in plotting the amplitude growth functions. This was similarly done for the peak at twice the stimulus frequency for the ANN/SUM growth functions. As previously mentioned, we extracted threshold, slope, and a suprathreshold amplitude. Note that this results in 12 variables extracted for the CM and 12 variables extracted for the ANN (4 frequencies x 3 variables), all of which were subjected to individual LME analyses. The threshold, measured in dB HL, was determined via visual inspection of the amplitude growth function and is the lowest stimulus level that results in an ECoG response. The slope represents the rate of change in amplitude as the stimulus level increases, calculated using a linear regression, and measured in μV/dB. For the suprathreshold amplitude, we identified the highest stimulus level that was used across all time points for a particular stimulus frequency. We then extracted the corresponding electrocochleogram amplitudes for all those time points. For example, in the case of subject 622–5R represented in Figure 2, the highest level used for the 250 Hz stimulation frequency across all time points was 90 dB HL. The corresponding amplitude in the growth function for that stimulus level was used in the longitudinal analysis. Similarly, amplitudes corresponding to a 100, 110-, and 110-dB HL stimulus levels for 500, 750, and 1000 Hz stimulation frequencies were used in the analysis for this subject. Note that for the two subjects with stable acoustic hearing (622–5R and 624–6R), there is relative stability in the ECoG amplitude growth functions, while subject 624–1R shows changes in the ECoG amplitude growth functions. Specifically, the functions shift to the right as the hearing loss progresses, indicating that higher stimulation levels are needed to evoke an ECoG response.
Figure 2.

Figure 3 shows example longitudinal thresholds, slopes and amplitudes for the same subjects represented in Figure 2. For each subject, the top subpanels show raw values while the bottom subpanels show changes in values over time. In subject 622–5R’s case, he showed improvement in audiometric hearing since initial activation of the CI; this is likely due to resolution of a conductive component of the hearing loss secondary to residual middle ear fluid, as commonly seen immediately post CI surgery. As more clearly seen in the bottom subpanels, the changes in ECoG thresholds and amplitudes mirror changes in behavioral audiometric thresholds. Thresholds and amplitudes are generally stable during periods of stable hearing. Thresholds and amplitudes worsen with loss of hearing, and vice-versa.
Figure 3.

Stability of ECoG measures
As previously mentioned, the primary question of interest was evaluating the stability of ECoG metrics over time in the stable hearing group and the hearing loss group. Thus, the change in each ECoG metric was calculated relative to baseline for each subject (e.g bottom subpanels of Figure 3). These metrics were obtained for all subjects, and separate LME models for each ECoG metric at each frequency were conducted to analyze whether longitudinal trends were statistically significant.
Table 3 summarizes the results of the LME models. For those with stable hearing, there are no changes noted in CM/DIFF or ANN/SUM thresholds or amplitude over time for any frequencies (except for the 250 Hz CM/DIFF threshold). In contrast, there are changes in thresholds and amplitudes noted in most cases for those with loss of hearing. As evidenced by the β -values, amplitudes generally decreased (β < 0) and thresholds generally increased (β > 0) with loss of hearing. Additionally, though there was some evidence of the slope becoming shallower for the hearing loss group, (β < 0), the slope metric was generally not statistically significant.
Table 3:
Results of LME analysis. P-values were adjusted using a False Discovery Rate. Italicized numbers indicate results that are statistically significant.
| Stable Hearing | Hearing Loss | |||||
|---|---|---|---|---|---|---|
| Dependent variable | β | Statistics | pFDR | β | Statistics | pFDR |
| CM/DIFF Amplitude 250 Hz | 0.059 | t(81)=0.90, p=0.370 | 0.241 | −0.310 | t(25)=−2.73, p=0.012 | 0.016 |
| CM/DIFF Amplitude 500 Hz | 0.041 | t(77)=0.54, p=0.591 | 0.318 | −0.399 | t(34)=−2.10, p=0.043 | 0.049 |
| CM/DIFF Amplitude 750 Hz | 0.266 | t(73)=0.95, p=0.346 | 0.241 | −0.841 | t(35)=−3.66, p=0.001 | 0.002 |
| CM/DIFF Amplitude 1000 Hz | 0.117 | t(79)=1.49, p=0.139 | 0.130 | −1.683 | t(26)=−3.78, p=0.001 | 0.002 |
| CM/DIFF Slope 250 Hz | 0.001 | t(71)=0.33, p=0.743 | 0.384 | −0.003 | t(18)=−1.19, p=0.251 | 0.187 |
| CM/DIFF Slope 500 Hz | 0.007 | t(62)=1.54, p=0.130 | 0.127 | −0.005 | t(27)=−1.48, p=0.150 | 0.130 |
| CM/DIFF Slope 750 Hz | 0.003 | t(63)=0.32, p=0.749 | 0.384 | 0.015 | t(29)=1.17, p=0.251 | 0.187 |
| CM/DIFF Slope 1000 Hz | 0.002 | t(63)=1.46, p=0.149 | 0.130 | 0.050 | t(25)=2.35, p=0.027 | 0.033 |
| CM/DIFF Threshold 250 Hz | −0.600 | t(78)=−3.60, p=0.001 | 0.002 | 2.491 | t(22)=3.26, p=0.004 | 0.007 |
| CM/DIFF Threshold 500 Hz | −0.004 | t(74)=−0.03, p=0.977 | 0.447 | 2.509 | t(34)=4.26, p=0.000 | 0.001 |
| CM/DIFF Threshold 750 Hz | −0.002 | t(70)=−0.00, p=0.996 | 0.447 | 1.265 | t(35)=2.39, p=0.022 | 0.028 |
| CM/DIFF Threshold 1000 Hz | −0.111 | t(76)=−0.66, p=0.511 | 0.298 | 1.992 | t(25)=4.17, p=0.000 | 0.002 |
| ANN/SUM Amplitude 250 Hz | 0.015 | t(81)=1.68, p=0.097 | 0.100 | −0.124 | t(25)=−3.14, p=0.004 | 0.008 |
| ANN/SUM Amplitude 500 Hz | 0.009 | t(77)=0.82, p=0.417 | 0.260 | −0.074 | t(34)=−2.94, p=0.006 | 0.009 |
| ANN/SUM Amplitude 750 Hz | −0.002 | t(73)=−0.21, p=0.837 | 0.410 | −0.100 | t(35)=−2.94, p=0.006 | 0.009 |
| ANN/SUM Amplitude 1000 Hz | −0.001 | t(79)=−0.08, p=0.935 | 0.447 | −0.196 | t(26)=−4.91, p=0.000 | 0.001 |
| ANN/SUM Slope 250 Hz | 0.001 | t(63)=0.81, p=0.423 | 0.260 | −0.001 | t(15)=−0.79, p=0.441 | 0.264 |
| ANN/SUM Slope 500 Hz | 0.004 | t(49)=1.16, p=0.251 | 0.187 | 0.001 | t(17)=1.87, p=0.079 | 0.085 |
| ANN/SUM Slope 750 Hz | 0.001 | t(32)=0.57, p=0.574 | 0.317 | 0.013 | t(16)=0.95, p=0.357 | 0.241 |
| ANN/SUM Slope 1000 Hz | −0.004 | t(22)=−3.80, p=0.001 | 0.002 | 0.022 | t(13)=4.49, p=0.001 | 0.002 |
| ANN/SUM Threshold 250 Hz | −0.054 | t(79)=−0.28, p=0.780 | 0.391 | 0.630 | t(17)=0.93, p=0.365 | 0.241 |
| ANN/SUM Threshold 500 Hz | −0.081 | t(64)=−0.60, p=0.548 | 0.311 | 2.559 | t(24)=4.72, p=0.000 | 0.001 |
| ANN/SUM Threshold 750 Hz | −0.003 | t(43)=−0.01, p=0.988 | 0.447 | 1.756 | t(28)=3.19, p=0.003 | 0.007 |
| ANN/SUM Threshold 1000 Hz | −0.395 | t(30)=−1.36, p=0.185 | 0.153 | 1.443 | t(20)=2.82, p=0.011 | 0.015 |
Comparisons of CM/DIFF and ANN/SUM losses
It is evident from the previous analysis that both CM/DIFF and ANN/SUM metrics decline with declines in audiometric hearing. It was also of interest to see if there are equal drops in both CM/DIFF and ANN/SUM potentials, or if there is a greater decline in one potential compared to the other. If there is a greater decline in one potential, it may shed more insight into the pathophysiology of delayed hearing loss.
Figure 4 plots changes in the CM/DIFF metric relative to the changes in ANN/SUM metric that occurs at the time point where hearing loss was identified. The two metrics of interest were threshold and amplitude, as those metrics were affected by loss of hearing. The slope of the ECoG amplitude growth function was not analyzed here since it was not sensitive to loss of acoustic hearing.
Figure 4.

For the threshold analysis, the difference in the CM/DIFF threshold at the time point of hearing loss and the previous appt was calculated. The same calculation was performed for the ANN/SUM threshold. These two differences were then plotted against one another. For the amplitude analysis, a ratio of the CM/DIFF amplitude at loss of hearing relative to the previous appointment was calculated. The same ratio calculation was performed for the ANN/SUM amplitudes. These two ratios were plotted against one another.
Figure 4 left panel focuses on threshold changes. As summarized in Table 4, there is a significant correlation between CM/DIFF threshold changes and ANN/SUM threshold changes. More importantly, paired t-tests comparing the CM/DIFF and ANN/SUM threshold change at time point of hearing loss and showed that there were no differences in threshold changes. A similar result was found for the amplitude changes, in that both CM/DIFF and ANN/SUM amplitudes have similar decrements after loss of hearing. Results of these paired t-tests are described in Table 4.
Table 4:
Comparisons of CM/DIFF and ANN/SUM changes after loss of hearing. Italicized numbers indicate results that are statistically significant
| Threshold Changes | Amplitude Changes | |||||||||||
|---|---|---|---|---|---|---|---|---|---|---|---|---|
| Correlation | t-test | Correlation | t-test | |||||||||
| Frequency (Hz) | n | r | p | t | df | p | n | r | p | t | df | P |
| 250 | 5 | 0.883 | 0.024 | −0.612 | 4 | 0.573 | 3 | 0.974 | 0.073 | −0.384 | 2 | 0.738 |
| 500 | 8 | 0.892 | 0.001 | −1.843 | 7 | 0.108 | 6 | 0.861 | 0.014 | 0.183 | 5 | 0.862 |
| 750 | 10 | 0.886 | 0.000 | 0.176 | 9 | 0.864 | 6 | 0.79 | 0.031 | −0.41 | 5 | 0.699 |
| 1000 | 4 | 0.93 | 0.035 | −1.414 | 3 | 0.252 | 4 | 0.969 | 0.015 | 0.338 | 3 | 0.758 |
Correlations between Behavioral Audiogram, ECoG Slopes, ECoG Thresholds, and ECoG amplitudes
As a secondary analysis, CM/DIFF, ANN/SUM, and behavioral audiometric thresholds from each subject’s latest test session were obtained. Figure 5 shows correlations between behavioral audiometric thresholds and electrophysiologic thresholds. In general, electrophysiological thresholds are well correlated with behavioral thresholds. In addition, 500 and 750 Hz CM/DIFF thresholds are closest to behavioral thresholds. Note that for these correlational analyses, cases of no responses (as indicated by the open symbols) were plotted as 120 dB HL but were excluded from correlational analyses.
Figure 5.

Figure 6 shows correlations between behavioral audiometric thresholds and electrophysiologic slopes of the ECoG amplitude growth functions. It was thought that those with better residual hearing would have steeper slopes. In general, this was not the case, except for the 750 and 1000 Hz CM/DIFF growth slopes and the 1000 Hz ANN/SUM growth slopes (r = −0.407, −0.6654, and −0.5302, respectively, with p < 0.01 in all three case). Note that for these correlational analyses, cases of no behavioral audiometric responses (as indicated by the open symbols) were plotted as 120 dB HL but were excluded from correlational analyses.
Figure 6.

Figure 7 shows correlations between behavioral audiometric thresholds and electrophysiologic amplitudes obtained using the subject’s C-level. It was thought that those with better residual hearing would have higher ECoG amplitudes. There were trends of higher ECoG amplitudes for those with better residual hearing (lower audiometric thresholds). These trends were statistically significant or borderline statistically significant for the CM/DIFF potentials at all tested frequencies. These trends were statistically significant for the 500 Hz and 1000 Hz ANN/SUM potentials.
Figure 7.

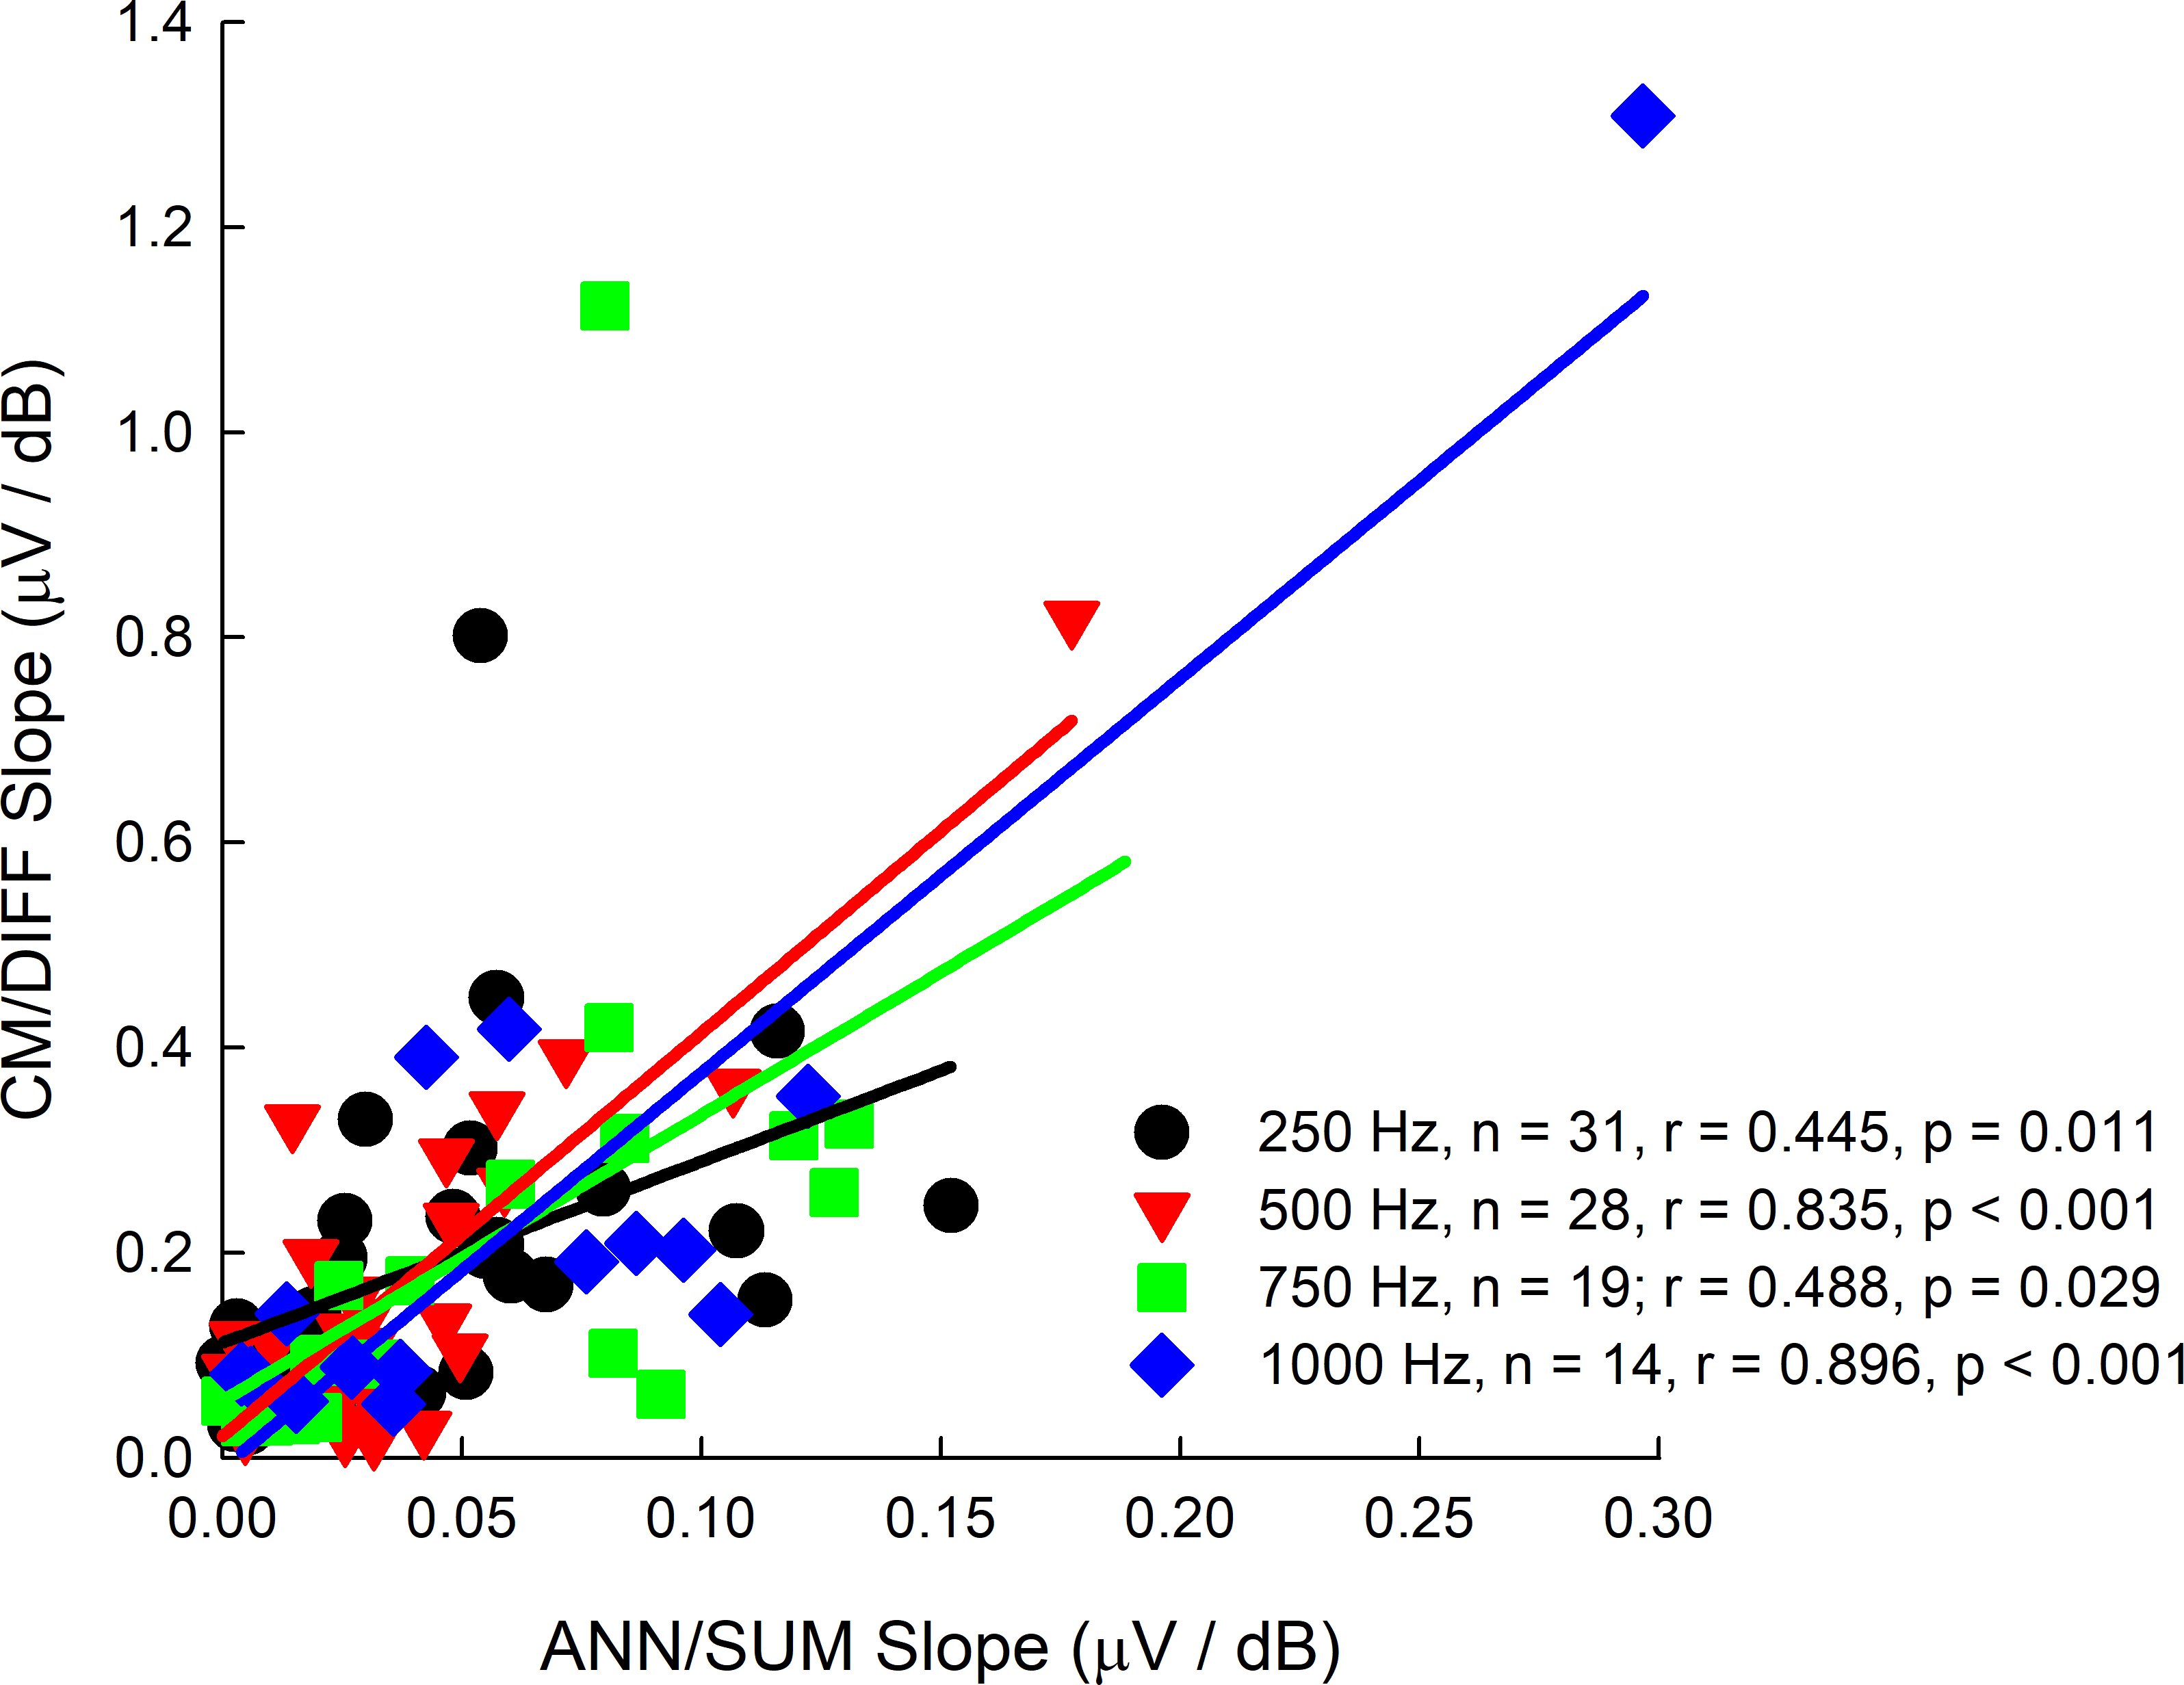
The slopes of the CM/DIFF and ANN/SUM amplitude growth functions were plotted against one another to ascertain if there were correlations between both and to understand if one potential grows faster than the other. From Figure 8, it does appear that both metrics are correlated. More importantly is that the CM/DIFF grows more quickly as the stimulation level increases, as evidenced by the steeper slopes on the y-axis of Figure 8.
Figure 8.
DISCUSSION
Past studies of electrocochleography in CI users have focused on its application during CI surgery (Bester et al, 2021; Lenarz et al, 2022), to predict post-operative speech understanding and behavioral audiometric thresholds (Abbas et al, 2017; Koka et al, 2017, Fontenot et al, 2019), and to guide programming of the hearing aid component of the EAS sound processor (Agrawal et al, 2020). The current study provides a new application of ECoG as an objective measure of longitudinal peripheral auditory function in EAS CI users. The stability of both CM and ANN amplitudes seen in our Nucleus CI users is consistent with the intertest and intratest reliability of ECoG measures in normal hearing and sensorineural hearing loss populations (Bergholtz et al, 1976; Densert et al, 1994; Mori et al, 1981; Park & Ferraro, 1999). Thus, the increase in ECoG thresholds and decrease in ECoG amplitudes in those with delayed hearing loss is likely clinically meaningful. The slope of the ECoG amplitude growth function was not a meaningful metric, as slopes were stable across repeated test sessions for both subjects with stable hearing and subjects with delayed loss of hearing.
One limitation of ECoG studies in general is that the difference / summation technique to separate out hair cell / neural potentials is not perfect. That is, it is very possible that there is still a neural component in the CM/DIFF traces that hasn’t been isolated out (e.g. Forgues et al 2014; Abbas et al, 2017). The contamination of the ANN/SUM responses by the CM can be seen at stimulus levels 30–40 dB above CM threshold (Forgues et al 2014). Thus, for subjects with particularly large dynamic ranges in their ECoG amplitude growth functions, some of the suprathreshold amplitudes may be affected by this contamination.
From a clinical perspective, both CM and ANN potentials are equally affected with loss of hearing, as shown by Figure 4 and Table 4. The threshold measures may be more a more reliable indicator of loss of hearing as they are not as affected by incomplete separation of CM and ANN potentials using the difference and summation techniques as seen in suprathreshold measures (Forgues et al, 2014). Our CM and ANN thresholds are often poorer (higher) than behavioral thresholds (Figure 5), particularly for the lower frequencies. This has been shown in previous studies from our institution (Abbas et al, 2017; Kim et al, 2018) and others (Koka et al, 2017), and is also in line with other evoked potential studies showing poorer electrophysiological thresholds compared to behavioral thresholds (Elberling and Don,1987; Gorga et al., 2006; Stapells, 2000; Tlumak et al., 2007). However, we note that even within our results there are cases of better electrophysiological thresholds compared to behavioral thresholds (Figure 5). There are also exemplary cases of recordable ECoGs in EAS CI patients with no measurable acoustic hearing (Tejani et al, 2021) as well as large ECoG responses in CI patients with Auditory Neuropathy Synchrony Disorder (Riggs et al, 2017). In such cases, it has been theorized that there is a synaptic issue where the hair cells are not connected to the auditory nerve fibers, which results in recordable cochlear microphonics but poor behavioral sensitivity (Fontenot et al, 2017). This implies that though there is a correlation between behavioral and ECoG thresholds, it is not entirely causative.
Regardless, the similar impact on CM and ANN thresholds and amplitudes implies a common underlying reason of delayed hearing loss, though there are many probable etiologies that are debatable. Eshraghi et al. (2013) observed outer hair cell loss in their animal models of CI, which at first glance appears consistent with loss of CM and ANN potentials in our delayed-hearing loss population. However, their animal CI protocol involved extensive electrode-induced cochlear trauma such that shifts in both low- and high-frequency hearing were observed. These conditions may not necessarily reflect our low-frequency hearing preservation patients. Alternatively, animal studies have shown that the ANN/SUM potential is sensitive to changes in endocochlear potentials (Lichtenhan et al, 2017). Compromised endocochlear potentials have been implicated in delayed hearing loss, at least in the high-frequency region of the cochlea where the CI electrode lies (Tanaka et al. 2014; Reiss et al. 2015). Another theory based on our previous human electrophysiological findings using complex electrode impedance measures, as well as a post-mortem human EAS CI study, suggest intracochlear fibrosis as a contributor to delayed hearing loss (Quesnel et al, 2016; Tejani et al, 2022).
In general, animal histology has suggested many possible etiologies, such as compromised endocochlear potentials (Tanaka et al. 2014; Reiss et al. 2015), cochlear neuropathy/synaptopathy (Li et al. 2020), and excitotoxicity (Kopelovich et al. 2015). These studies do not implicate hair cell / neural damage / pre-synaptic / post-synaptic damage (O’Leary et al. 2013; Tanaka et al. 2014; Reiss et al. 2015; Quesnel et al. 2016). Without post-mortem histology, one cannot definitely prove the underlying causes of delayed hearing loss in humans post-CI (e.g. Quesnel et al, 2016). This limitation thus makes electrophysiology, including electrocochleography, a valuable tool to investigate loss of hearing in human CI users (e.g. Scheperle et, 2017; Tejani et al, 2021, 2022).
Our secondary analysis of correlations with audiometric thresholds shows that regardless of audiometric frequency, there is a strong correlation between ECoG thresholds and audiometric thresholds. This is despite using a combination of electrode arrays, with some electrodes having partial insertions. These strong correlations are consistent with past studies conducted by our institution (Abbas et al, 2018; Kim et al, 2018) and others (Koka et al, 2017; Agarwal et al, 2021). In contrast, our slope metrics were generally not well correlated with behavioral audiometry. Additionally, subjects with greater residual hearing tended to have higher ECoG amplitudes, which is consistent with correlations between ECoG “total-response” amplitudes and behavioral audiometry (Fitzpatrick et al, 2014). This was especially the case for CM/DIFF potentials. In the case of the ANN/SUM amplitudes, these correlations were not statistically significant in some cases. The lack of correlation may stem from the lower spread of ANN/SUM amplitudes since these potentials are generally small.
Our present study provides a new application of post-operative ECoG in monitoring residual hearing and understanding the pathophysiology of delayed hearing loss. In a future study, we will explore further applications of post-operative ECoG, including the relationship between post-operative ECoG and speech perception, as most data in the literature focuses interoperative ECoG at time of surgery and correlating that with outcome measures (Fontenot et al, 2019, Canfarotta et al, 2021; Walia et al, 2022). In addition, while our measures were conducted using in-house custom-built equipment, cochlear implant companies are also designing and implementing hardware and software adaptations so that their own systems can be used for ECoG recordings. We are exploring the use of company-designed ECoG equipment for post-operative purposes. Thus, it is foreseeable that both intraoperative and post-operative ECoG recordings can be integrated into clinical practice.
Funding:
National Institute on Deafness and Other Communicative Disorders (P50 DC000242, PI: Gantz; R01 DC017846, PI: He; R21 DC019458, PI: He) National Institute of General Medical Sciences (R01 DC016038, PI: He)
Footnotes
Conflict of Interest: BJG is a consultant for Cochlear Ltd. MRH is co-founder and Chief Medical Officer for iotaMotion, Inc. VDT is a consultant for iotaMotion, Inc. All other authors declare that they have no conflict of interest.
REFERENCES
- Abbas PJ, Tejani VD, Scheperle RA, Brown CJ (2017). Using Neural Response Telemetry to Monitor Physiological Responses to Acoustic Stimulation in Hybrid Cochlear Implant Users. Ear Hear. 38(4):409–425. 10.1097/AUD.0000000000000400 [DOI] [PMC free article] [PubMed] [Google Scholar]
- Adunka O, Gstoettner W, Hambek M, Unkelbach MH, Radeloff A, Kiefer J (2004) Preservation of basal inner ear structures in cochlear implantation. ORL 66:306–312. 10.1159/000081887. [DOI] [PubMed] [Google Scholar]
- Adunka OF, Pillsbury HC, Buchman CA (2010). Minimizing intracochlear trauma during cochlear implantation. Adv Otorhinolaryngol. 67:96–107. 10.1159/000262601. [DOI] [PubMed] [Google Scholar]
- Aran J-M & Charlet de Sauvage R (1976). Clinical value of cochlear microphonic recordings. In: Ruben RJ, Elberling C, Salomon G. (Eds.), Electrocochleography. University Park Press, Baltimore, MD, pp. 55e65. [Google Scholar]
- Agrawal S, Coulthurst S, Nachman A, Koka K, & Murray M. (2021, ePub ahead of print). Acoustic component programming in children with cochlear implants using electrocochleography. International journal of audiology, 1–8. 10.1080/14992027.2021.1917779 [DOI] [PubMed] [Google Scholar]
- Bester C, Collins A, Razmovski T, Weder S, Briggs RJ, Wei B, Zakaria AF, Gerard JM, Mitchell-Innes A, Tykocinski M, Kennedy R, Iseli C, Dahm M, Ellul S, O’Leary S. (2021). Electrocochleography triggered intervention successfully preserves residual hearing during cochlear implantation: Results of a randomised clinical trial. Hearing research, 108353. Advance online publication. 10.1016/j.heares.2021.108353 [DOI] [PubMed] [Google Scholar]
- Bergholtz LM, Hooper RE, & Mehta DC. (1976). Test-retest reliability in clinical electrocochleography. The Annals of otology, rhinology, and laryngology, 85(5 Pt.1), 679–685. 10.1177/000348947608500519. [DOI] [PubMed] [Google Scholar]
- Brockmeier SJ, Peterreins M, Lorens A, Vermeire K, Helbig S, Anderson I, Skarzynski H, Van de Heyning P, Gstoett ner W, Kiefer J (2010) Music perception in electric acoustic stimulation users as assessed by the Mu.S.I.C. test. Adv Otorhinolaryngol 67:70–80. 10.1159/000262598. [DOI] [PubMed] [Google Scholar]
- Choi C-H, Oghalai JS (2005). Predicting the effect of post-implant cochlear fibrosis on residual hearing. Hear Res. 205(1–2):193–200. 10.1016/j.heares.2005.03.018. [DOI] [PMC free article] [PubMed] [Google Scholar]
- Canfarotta MW, O’Connell BP, Giardina CK, Buss E, Brown KD, Dillon MT, Rooth MA, Pillsbury HC, Buchman CA, Adunka OF, & Fitzpatrick DC (2021). Relationship Between Electrocochleography, Angular Insertion Depth, and Cochlear Implant Speech Perception Outcomes. Ear and hearing, 42(4), 941–948. 10.1097/AUD.0000000000000985. [DOI] [PMC free article] [PubMed] [Google Scholar]
- Densert B, Arlinger S, Sass K, & Hergils L. (1994). Reproducibility of the electric response components in clinical electrocochleography. Audiology: 33(5), 254–263. 10.3109/00206099409071885 [DOI] [PubMed] [Google Scholar]
- Dunn CC, Perreau A, Gantz B, Tyler RS (2010) Benefits of localization and speech perception with multiple noise sources in listeners with a short-electrode cochlear implant. J Am Acad Audiol 21(1):44–51. 10.3766/jaaa.21.1.6. [DOI] [PMC free article] [PubMed] [Google Scholar]
- Eggermont JJ (2017). Ups and Downs in 75 Years of Electrocochleography. Front Syst Neurosci. 11:2. 10.3389/fnsys.2017.00002. [DOI] [PMC free article] [PubMed] [Google Scholar]
- Elberling C, & Don M (1987). Threshold characteristics of the human auditory brain stem response. Journal of the Acoustical Society of America, 81(1), 115–121. 10.1121/1.395019 [DOI] [PubMed] [Google Scholar]
- Eshraghi AA, Gupta C, Van De Water TR, Bohorquez JE, Garnham C, Bas E, Talamo VM (2013). Molecular mechanisms involved in cochlear implantation trauma and the protection of hearing and auditory sensory cells by inhibition of c-Jun-N-terminal kinase signaling. Laryngoscope, 123 Suppl 1, S1–S14. 10.1002/lary.23902 [DOI] [PubMed] [Google Scholar]
- Fitzpatrick DC, Campbell AP, Choudhury B, Dillon MT, Forgues M, Buchman CA, Adunka OF. (2014). Round window electrocochleography just before cochlear implantation: relationship to word recognition outcomes in adults. Otology & Neurotology. 35(1), 64–71. 10.1097/MAO.0000000000000219 [DOI] [PMC free article] [PubMed] [Google Scholar]
- Foggia MJ, Quevedo RV, Hansen MR (2019). Intracochlear fibrosis and the foreign body response to cochlear implant biomaterials. Laryngoscope Investig Otolaryngol. 4(6):678–683. 10.1002/lio2.329. [DOI] [PMC free article] [PubMed] [Google Scholar]
- Forgues M, Koehn HA, Dunnon AK, Pulver SH, Buchman CA, Adunka OF, Fitzpatrick DC (2014). Distinguishing hair cell from neural potentials recorded at the round window. J Neurophysiol. 111(3):580–593. 10.1152/jn.00446.2013. [DOI] [PMC free article] [PubMed] [Google Scholar]
- Fontenot TE, Giardina CK, Dillon M, Rooth MA, Teagle HF, Park LR, Brown KD, Adunka OF, Buchman CA, Pillsbury HC, Fitzpatrick DC (2019). Residual Cochlear Function in Adults and Children Receiving Cochlear Implants: Correlations With Speech Perception Outcomes. Ear Hear. 40(3):577–591. 10.1097/AUD.0000000000000630. [DOI] [PMC free article] [PubMed] [Google Scholar]
- Gantz BJ, Turner CW (2003). Combining acoustic and electrical hearing. Laryngoscope. 113: 1726–1730. 10.1097/00005537-200310000-00012. [DOI] [PubMed] [Google Scholar]
- Gantz BJ, Dunn CC, Oleson J, Hansen MR (2017). Acoustic plus electric speech processing: Long-term results. Laryngoscope. 10.1002/lary.26669 [DOI] [PMC free article] [PubMed] [Google Scholar]
- Gifford RH, Dorman MF, Spahr AJ, Bacon SP, Skarzynski H, Lorens A (2008) Hearing preservation surgery: psychophysical estimates of cochlear damage in recipients of a short electrode array. J Acoust Soc Am 124(4):2164–2173. 10.1121/1.2967842. [DOI] [PMC free article] [PubMed] [Google Scholar]
- Gifford RH, Dorman MF, Brown CA (2010) Psychophysical properties of low-frequency hearing: implications for perceiving speech and music via electric and acoustic stimulation. Adv Otorhinolaryngol 67:51–60. 10.1159/000262596. [DOI] [PMC free article] [PubMed] [Google Scholar]
- Gfeller KE, Olszewski C, Turner C, Gantz B, Oleson J (2006) Music perception with cochlear implants and residual hearing. Audiol Neurootol 11(Suppl 1):12–15. 10.1159/000095608. [DOI] [PubMed] [Google Scholar]
- Golub JS, Won JH, Drennan WR, Worman TD, Rubinstein JT (2012). Spectral and temporal measures in hybrid cochlear implant users: on the mechanism of electroacoustic hearing benefits. Otol Neurotol. 33(2):147–153. 10.1097/MAO.0b013e318241b6d3. [DOI] [PMC free article] [PubMed] [Google Scholar]
- Gorga MP, Johnson TA, Kaminski JR, Beauchaine KL, Garner CA, & Neely ST. (2006). Using a combination of click- and tone burst-evoked auditory brain stem response measurements to estimate pure-tone thresholds. Ear and hearing, 27(1), 60–74. 10.1097/01.aud.0000194511.14740.9c [DOI] [PMC free article] [PubMed] [Google Scholar]
- Henry KR (1995). Auditory nerve neurophonic recorded from the round window of the Mongolian gerbil. Hear Res. 90 (1–2), 176–184. 10.1016/0378-5955(95)00162-6. [DOI] [PubMed] [Google Scholar]
- Kim JS, Tejani VD, Abbas PJ, Brown CJ (2018). Postoperative Electrocochleography from Hybrid Cochlear Implant users: An Alternative Analysis Procedure. Hear Res. 370:304–315. 10.1016/j.heares.2018.10.016. [DOI] [PMC free article] [PubMed] [Google Scholar]
- Koka K, Saoji AA, Litvak LM (2017). Electrocochleography in Cochlear Implant Recipients With Residual Hearing: Comparison With Audiometric Thresholds. Ear Hear. 38(3):e161–e167. doi: 10.1097/AUD.0000000000000385. [DOI] [PubMed] [Google Scholar]
- Lenarz T, Buechner A, Gantz BJ, Hansen MR, Tejani VD, Labadie R, O’Connell B, Buchman CA, Valenzuela CV, Adunka OF, Harris MS, Riggs WJ, Fitzpatrick DC, Koka K (2022). Relationship between Intraoperative Electrocochleography and Hearing Preservation. Otology and Neurotology. 43(1):e72–e78. 10.1097/mao.0000000000003403. [DOI] [PMC free article] [PubMed] [Google Scholar]
- Lenarz T, James C, Cuda D, Fitzgerald O’Connor A, Frachet B, Frijns JH, Klenzner T, Laszig R, Manrique M, Marx M, Merkus P, Mylanus EA, Offeciers E, Pesch J, Ramos-Macias A, Robier A, Sterkers O, Uziel A. (2013). European multi-centre study of the Nucleus Hybrid L24 cochlear implant. Int J Audiol. 52(12):838–48. 10.3109/14992027.2013.802032. [DOI] [PubMed] [Google Scholar]
- Li Q, Lu T, Zhang C, Hansen MR, Li S (2020). Electrical stimulation induces synaptic changes in the peripheral auditory system. J Comp Neurol. 528(6):893–905. 10.1002/cne.24802. [DOI] [PubMed] [Google Scholar]
- Lichtenhan JT, Cooper NP, Guinan JJ Jr. (2013). A new auditory threshold estimation technique for low frequencies: Proof of concept. Ear Hear. 34(1): 42–51. 10.1097/AUD.0b013e31825f9bd3. [DOI] [PMC free article] [PubMed] [Google Scholar]
- Lichtenhan JT, Lee C, Dubaybo F, Wenrich KA, & Wilson US. (2017). The Auditory Nerve Overlapped Waveform (ANOW) Detects Small Endolymphatic Manipulations That May Go Undetected by Conventional Measurements. Frontiers in neuroscience, 11, 405. 10.3389/fnins.2017.00405 [DOI] [PMC free article] [PubMed] [Google Scholar]
- Mori N, Matsunaga T, & Asai H. (1981). Intertest reliability in non-invasive electrocochleography. Audiology: 20(4), 290–299. 10.3109/00206098109072702 [DOI] [PubMed] [Google Scholar]
- O’Leary SJ, Monksfield P, Kel G, Connolly T, Souter MA, Chang A, Marovic P, O’Leary JS, Richardson R, Eastwood H (2013). Relations between cochlear histopathology and hearing loss in experimental cochlear implantation. Hear Res. 298: 27–35. 10.1016/j.heares.2013.01.012. [DOI] [PubMed] [Google Scholar]
- Pappa AK, Hutson KA, Scott WC, Wilson JD, Fox KE, Masood MM, Giardina CK, Pulver SH, Grana GD, Askew C, Fitzpatrick DC (2019). Hair cell and neural contributions to the cochlear summating potential. J Neurophysiol. 121(6):2163–2180. 10.1152/jn.00006.2019 [DOI] [PMC free article] [PubMed] [Google Scholar]
- Park DL, & Ferraro JA (1999). Intrasubject Test-Retest Reliability in Tympanic Electrocochleography. Journal of the American Academy of Audiology, 10(3): 160–165. [Google Scholar]
- Pillsbury HC 3rd, Dillon MT, Buchman CA, Staecker H, Prentiss SM, Ruckenstein MJ, Bigelow DC, Telischi FF, Martinez DM, Runge CL, Friedland DR, Blevins NH, Larky JB, Alexiades G, Kaylie DM, Roland PS, Miyamoto RT, Backous DD, Warren FM, El-Kashlan HK, Slager HK, Reyes C, Racey AI, Adunka OF (2018). Multicenter US Clinical Trial With an Electric-Acoustic Stimulation (EAS) System in Adults: Final Outcomes. Otol Neurotol. 39(3):299–305. 10.1097/MAO.0000000000001691. [DOI] [PMC free article] [PubMed] [Google Scholar]
- Quesnel AM, Nakajima HH, Rosowski JJ, Hansen MR, Gantz BJ, Nadol JB Jr (2016). Delayed loss of hearing after hearing preservation cochlear implantation: Human temporal bone pathology and implications for etiology. Hear Res. 333:225–234. 10.1016/j.heares.2015.08.018 [DOI] [PMC free article] [PubMed] [Google Scholar]
- Rauch SD, Halpin CF, Antonelli PJ, Babu S, Carey JP, Gantz BJ, Goebel JA, Hammerschlag PE, Harris JP, Isaacson B, Lee D, Linstrom CJ, Parnes LS, Shi H, Slattery WH, Telian SA, Vrabec JT, Reda DJ (2011). Oral vs intratympanic corticosteroid therapy for idiopathic sudden sensorineural hearing loss: a randomized trial. JAMA. 305(20):2071–2079. 10.1001/jama.2011.679. [DOI] [PubMed] [Google Scholar]
- Reiss LA, Stark G, Nguyen-Huynh AT, Spear KA, Zhang H, Tanaka C, Li H (2015). Morphological correlates of hearing loss after cochlear implantation and electro-acoustic stimulation in a hearing-impaired Guinea pig model. Hear Res. 327:163–174. 10.1016/j.heares.2015.06.007 [DOI] [PMC free article] [PubMed] [Google Scholar]
- Riggs WJ, Roche JP, Giardina CK, Harris MS, Bastian ZJ, Fontenot TE, Buchman CA, Brown KD, Adunka OF, & Fitzpatrick DC (2017). Intraoperative Electrocochleographic Characteristics of Auditory Neuropathy Spectrum Disorder in Cochlear Implant Subjects. Frontiers in neuroscience, 11, 416. 10.3389/fnins.2017.00416 [DOI] [PMC free article] [PubMed] [Google Scholar]
- Roland JT Jr, Gantz BJ, Waltzman SB, Parkinson AJ; Multicenter Clinical Trial Group (2016). United States multicenter clinical trial of the cochlear nucleus hybrid implant system. Laryngoscope. 126(1):175–81. 10.1002/lary.25451. [DOI] [PMC free article] [PubMed] [Google Scholar]
- Roland JT Jr, Gantz BJ, Waltzman SB, Parkinson AJ (2018). Long-term outcomes of cochlear implantation in patients with high-frequency hearing loss. Laryngoscope. 128(8):1939–1945. 10.1002/lary.27073. [DOI] [PMC free article] [PubMed] [Google Scholar]
- Scheperle RA, Tejani VD, Omtvedt JK, Brown CJ, Abbas PJ, Hansen MR, Gantz BJ, Oleson JJ, Ozanne MV. (2017). Delayed changes in auditory status in cochlear implant users with preserved acoustic hearing. Hear Res. 350:45–57. 10.1016/j.heares.2017.04.005. [DOI] [PMC free article] [PubMed] [Google Scholar]
- Stapells DR, 2000. Threshold estimation by the tone-evoked auditory brainstem response: a literature meta-analysis. J. Speech Lang. Pathol. Audiol. 24 (2), 74e82. [Google Scholar]
- Stuart A, Stenstrom R, Tompkins C, & Vandenhoff S. (1991). Test-retest variability in audiometric threshold with supraaural and insert earphones among children and adults. Audiology : official organ of the International Society of Audiology, 30(2), 82–90. 10.3109/00206099109072873 [DOI] [PubMed] [Google Scholar]
- Tanaka C, Nguyen-Huynh A, Loera K, Stark G, Reiss L (2014). Factors associated with hearing loss in a normal-hearing guinea pig model of Hybrid cochlear implants. Hear Res. 316:82–93. 10.1016/j.heares.2014.07.011. [DOI] [PMC free article] [PubMed] [Google Scholar]
- Tejani VD, Abbas PJ, Brown CJ, Woo J (2019). An improved method of obtaining electrocochleography recordings from Nucleus Hybrid cochlear implant users. Hear Res. 373:113–120. 10.1016/j.heares.2019.01.002. [DOI] [PMC free article] [PubMed] [Google Scholar]
- Tejani VD, Brown CJ (2020). Speech masking release in Hybrid cochlear implant users: Roles of spectral and temporal cues in electric-acoustic hearing. J Acoust Soc Am. 147(5):3667. 10.1121/10.0001304. [DOI] [PMC free article] [PubMed] [Google Scholar]
- Tejani VD, Kim J-S, Oleson JJ, Abbas PJ, Brown CJ, Hansen MR, Gantz BJ (2021). Residual Hair Cell Responses in Electric-Acoustic Stimulation Cochlear Implant Users with Complete Loss of Acoustic Hearing After Implantation. Journal of the Association for Research in Otolaryngology. 22(2), 161–176. 10.1007/s10162-021-00785-4. [DOI] [PMC free article] [PubMed] [Google Scholar]
- Tejani VD, Yang H, Kim J-S, Hernandez H, Oleson JJ, Hansen MR, Gantz BJ, Abbas PJ, Brown CJ (2022). Access and Polarization Electrode Impedance Changes in Relation to Delayed Loss of Acoustic Hearing in Electric-Acoustic Stimulation Cochlear Implant Users. Journal of the Association for Research in Otolaryngology. 23, 95–118. 10.1007/s10162-021-00809-z. [DOI] [PMC free article] [PubMed] [Google Scholar]
- Tlumak AI, Rubinstein E, & Durrant JD (2007). Meta-analysis of variables that affect accuracy of threshold estimation via measurement of the auditory steady-state response (ASSR). International journal of audiology, 46(11), 692–710. 10.1080/14992020701482480 [DOI] [PubMed] [Google Scholar]
- Turner CW, Gantz BJ, Vidal C, Behrens A, Henry BA (2004). Speech recognition in noise for cochlear implant listeners: Benefits of residual acoustic hearing. J Acoust Soc Am. 115(4):1729–1735. 10.1121/1.1687425. [DOI] [PubMed] [Google Scholar]
- van Abel KM, Dunn CC, Sladen DP, Oleson JJ, Beatty CW, Neff BA, Hansen M, Gantz BJ, Driscoll CLW (2015) Hearing preservation among patients undergoing cochlear implantation. Otol Neurotol. 36:416–421. 10.1097/MAO.0000000000000703. [DOI] [PMC free article] [PubMed] [Google Scholar]
- von Ilberg C, Kiefer J, Tillein J, Pfenningdorff T, Hartmann R, Stürzebecher E, Klinke R. (1999). Electric-acoustic stimulation of the auditory system. New technology for severe hearing loss. ORL J Otorhinolaryngol Relat Spec. 61(6):334–340. 10.1159/000027695. [DOI] [PubMed] [Google Scholar]
- Walia A, Shew MA, Kallogjeri D, Wick CC, Durakovic N, Lefler SM, Ortmann AJ, Herzog JA, & Buchman CA (2022). Electrocochleography and cognition are important predictors of speech perception outcomes in noise for cochlear implant recipients. Scientific reports, 12(1), 3083. 10.1038/s41598-022-07175-7 [DOI] [PMC free article] [PubMed] [Google Scholar]