Abstract
The surface and overall collection efficiencies of capillary pore membrane filters were measured for sub-micrometer particles. Collection efficiencies were derived from the surface loadings of particles on filters measured by scanning electron microscopy and from airborne particle concentrations measured with a scanning mobility particle sizer. Tests used filters with nominal pore diameters of 0.4 and 0.8 μm and face velocities of 3.7 and 18.4 cm/s. Surface collection efficiencies were below 100% for particles smaller than 316 nm and below 55% for particles smaller than 100 nm. Overall collection efficiencies reached as low as 45% for 70 nm particles. For nanoparticles, collection efficiencies overall were substantially higher than those to the filter surface, indicating that deposition occurs to a large extent inside the filter pores. These results underscore the need to account for surface collection efficiency when deriving airborne concentrations from microscopic analysis of nanoparticles on capillary pore membrane filters.
Keywords: Nanoparticle, Filter, Efficiency, Air sampling
1. Introduction
Nanotechnology is becoming increasingly prevalent in the workplace due to its unique applications across a wide range of industries, from the field of medicine to alternate energy technology. Along with this new technology comes the possibility of worker and community exposure to airborne nanoparticles, which have a particle diameter smaller than 100 nm (NIOSH, 2006). Conventional methods for monitoring ambient air quality or personal exposures typically provide the mass concentration of particles that collect on a filter (Huang & Yang, 2006; McMurry, 2000). However, the extremely small size of nanoparticles often renders them a mass that is negligible relative to larger particles. Moreover, the dose of nanoparticles expressed in terms of particle number or surface area has been shown to scale more closely with adverse health effects than particle mass (Duffin, Tran, Brown, Stone, & Donaldson, 2007; Monteiller et al., 2007; Oberdörster, Ferin, & Lenhert, 1994; Stoeger et al., 2006). Sampling equipment capable of measuring particle number and surface area concentration exists, but is bulky and expensive (Brouwer, Gijsbers, & Lurvink, 2004).
Filtration combined with post-collection analysis by electron microscopy could be a practical, in-the-field option for assessing airborne exposures to nanoparticles by metrics other than mass concentration. When combined with analysis by light and/or electron microscopy, filter samples have been used to estimate airborne particle number concentrations and obtain particle chemical and morphological information, such as in airborne asbestos fiber exposure assessments (McMurry, 2000; NIOSH, 1994). In this work, we propose that filtration in combination with post-collection analysis using field-emission scanning electron microscopy can be used to estimate nanoparticle surface loadings onto filters; we further propose that these surface loadings can be translated into airborne particle concentrations in terms of number, surface area, or mass given a known filter surface collection efficiency.
Capillary pore membrane (CPM) filters are optimal for analysis by scanning electron microscopy (SEM) because they have a flat featureless collection surface that is ideally suited for counting particles (Gentry, Spurny, & Schoermann, 1982; Yamamoto, Fujii, Kumagai, & Yanagisawa, 2004). These filters are typically 10 μm thin polycarbonate films with circular pores that run perpendicular to the filter surface. The pores are produced by heavy ion irradiation followed by chemical etching and are randomly distributed across the filter surface (Spurny, Lodge, Frank, & Sheesley, 1969). When CPM filters are used to collect aerosols, particles can pass through the filter, collect onto the filter surface, or deposit inside the filter pores. Spurny et al. (1969) modeled the overall collection efficiency of CPM filters using separate terms for three distinct deposition mechanisms: (1) diffusion to filter pore walls, (2) impaction, and (3) interception. Deposition of the smallest particles (<100 nm) is dominated by diffusion, whereas larger particles deposit more by inertial impaction and interception. Manton (1979) introduced a new term to account for diffusion to the filter surface. Later, Marre and Palmeri (2001) added a new interception term that included the effects of particle slip and also recombined the interception and impaction terms to address the interdependency of these mechanisms that previously led to inaccuracies in Spurny’s model (Manton, 1978). A considerable amount of experimental work has been done to determine overall collection efficiency of CPM filters and the factors that affect it (Gentry et al., 1982; John & Reischl, 1978; Liu & Lee, 1976; Montassier, Dupin, & Bouland, 1996; Smith, Phillips, & Melo, 1976; Spurny et al., 1969). However, none have experimentally verified the theoretical deposition model of particles onto the surface of CPM filters.
Thus, the primary objective of this work was to experimentally determine surface collection efficiency of CPM filters at flow rates appropriate for personal sampling. The experimental setup also allowed for easy measurement of overall collection efficiency simultaneously with surface measurements. The secondary objective was to compare experimentally determined filter collection efficiencies to those estimated from theory. The completion of these objectives is an important step in the development of a reliable filter-based personal sampling method for assessing exposures to airborne nanoparticles.
2. Experimental design
2.1. Filters and test conditions
Three flow rate (Q) and filter pore size (D0) combinations were selected to measure the filter collection efficiency over a range of conditions applicable for personal sampling. The face velocities of 3.7 and 18.4 cm/s correspond to flow rates of 1 and 5 Lpm, respectively, which encompass the flow rates of 1.7, 2.2, and 2.5 Lpm specified by the NIOSH (1994) 0600 respirable sampling method. CPM filters (25 mm diameter) with effective filter areas of 4.5 cm2 and nominal pore sizes of 0.4 μm (P/N F0425, Nuclepore®, Structure Probe, Inc., West Chester, PA, USA) and 0.8 μm (P/N F0825, Nuclepore®, Structure Probe, Inc., West Chester, PA, USA) were selected to provide pressure drops that are compatible with conventional sampling pumps.
The actual pore diameters for the two filter types (listed in Table 1) were measured to be 0.29 ± 0.05 and 0.72 ± 0.18 μm using a computer-controlled SEM (CCSEM, Vega II XMH, Tescan USA, Inc., Cranberry Township, PA, USA). The numbers of pores per unit area (pore density) for blank filters with 0.29 and 0.72 μm pore diameters were measured by the CCSEM to be 9.7 × 10⁷ pores per cm2 and 1.8 × 10⁷ pores per cm2, respectively. These pore densities were used along with the measured pore diameters to calculate filter porosities of 0.064 and 0.073, respectively. The relationship between filter pressure drop and face velocity approaching the filter was measured experimentally (Fig. 1) and found to be roughly comparable to that measured by Liu and Lee (1976) for similar filters.
Table 1.
Capillary pore membrane filters tested.
| Filter parameter | Level | |
|---|---|---|
| Smaller-diameter filters | Larger-diameter filters | |
| Mean pore diameter (μm) (reported by manufacturer) | 0.29 ± 0.05 (0.4) | 0.72 ± 0.18 (0.8) |
| Pore density (# pores per cm2) | 9.7 × 10⁷ | 1.8 × 10⁷ |
| Filter thickness (μm) | 10.6 | 10.5 |
Fig. 1.
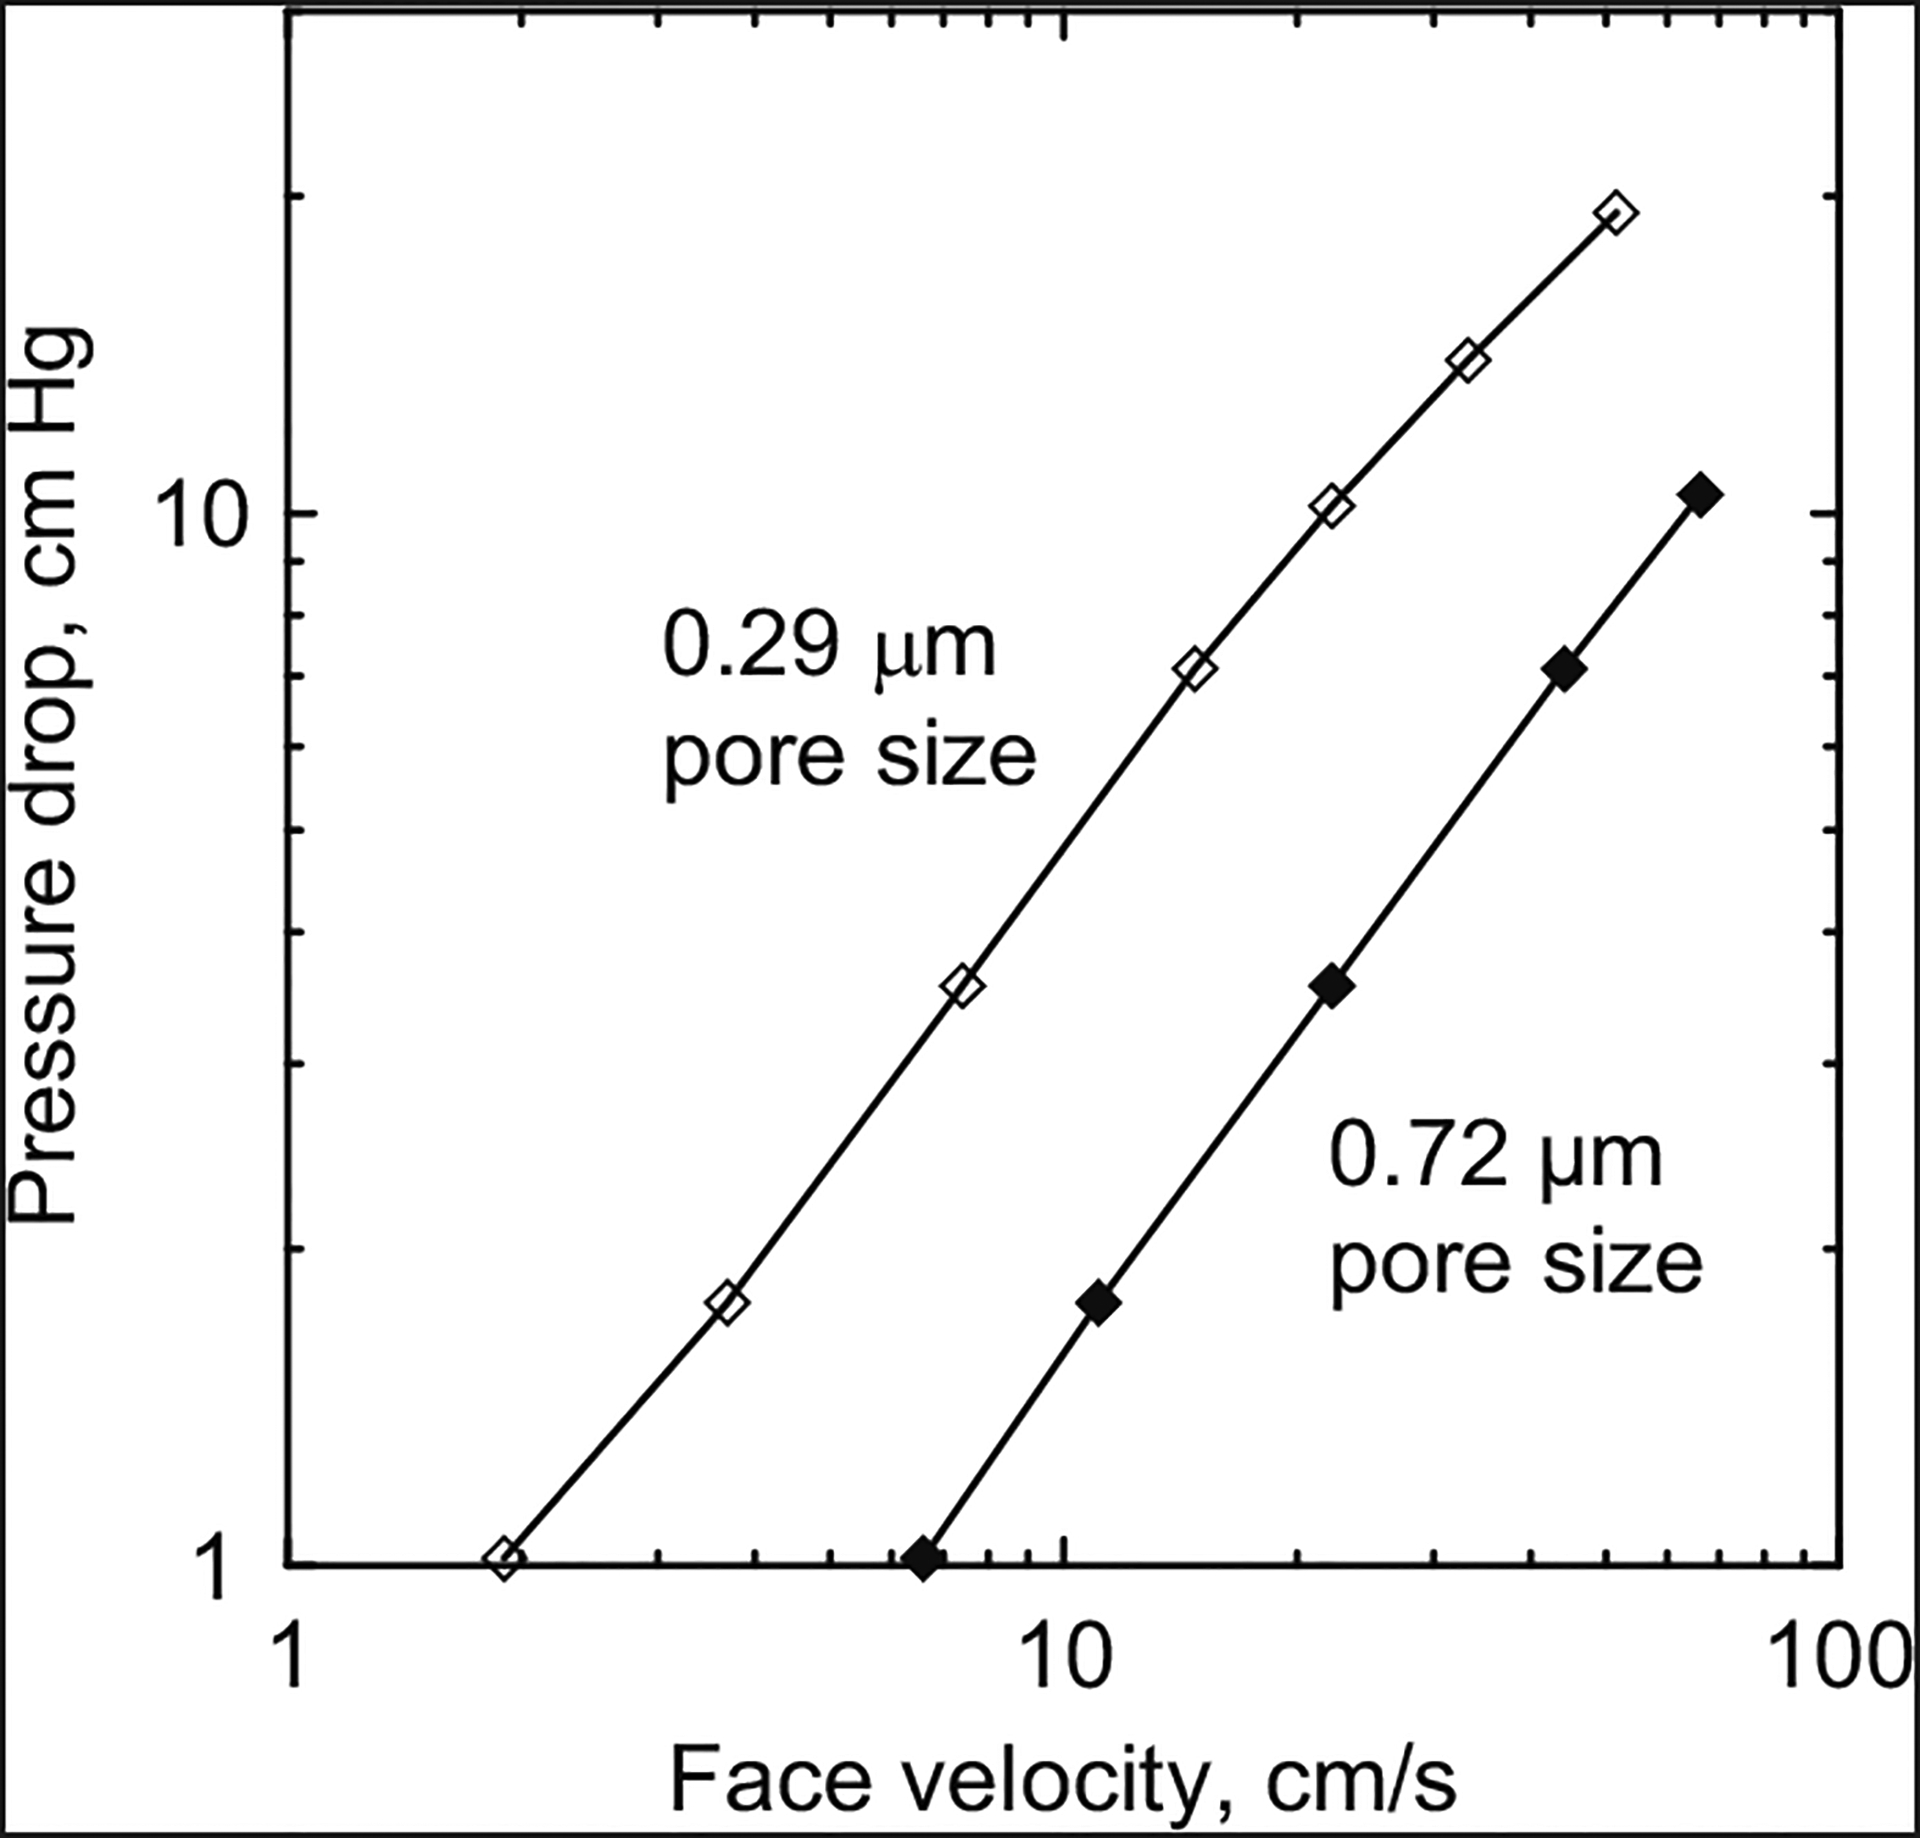
Pressure drop as a function of face velocity for filters with pore diameters of 0.29 and 0.72 μm.
2.2. Methods
A schematic of the filter-testing apparatus is given in Fig. 2. Compressed air was supplied to the test apparatus and filtered through a high efficiency particulate air (HEPA) filter. The filtered air was fed into a pneumatic nebulizer (AirLife®,Cardinal Health, Dublin, OH, USA) at an operating air pressure of 10 psi and used to aerosolize a potassium chloride salt solution with a concentration of 0.001, expressed here as a volume ratio. Potassium chloride was selected as the test aerosol because of its low hygroscopicity relative to other salts and distinctive cubic shape. The aerosol was then delivered to a 1 L chamber, where it was diluted with more HEPA-filtered supply air. The diluted aerosol was then passed through a silica-gel diffusion dryer to ensure complete dryness, a Kr-85 aerosol neutralizer (Model 3054A, TSI Inc., Shoreview, MN, USA) to neutralize any electric charge, and finally a 4 L dilution chamber to dampen any fluctuations in aerosol concentration. Aerosol concentrations emerging from the second dilution chamber were measured to be on the order of 105 particles/cm3 by a condensation particle counter (Model 3007, TSI, Inc., Shoreview, MN, USA).
Fig. 2.
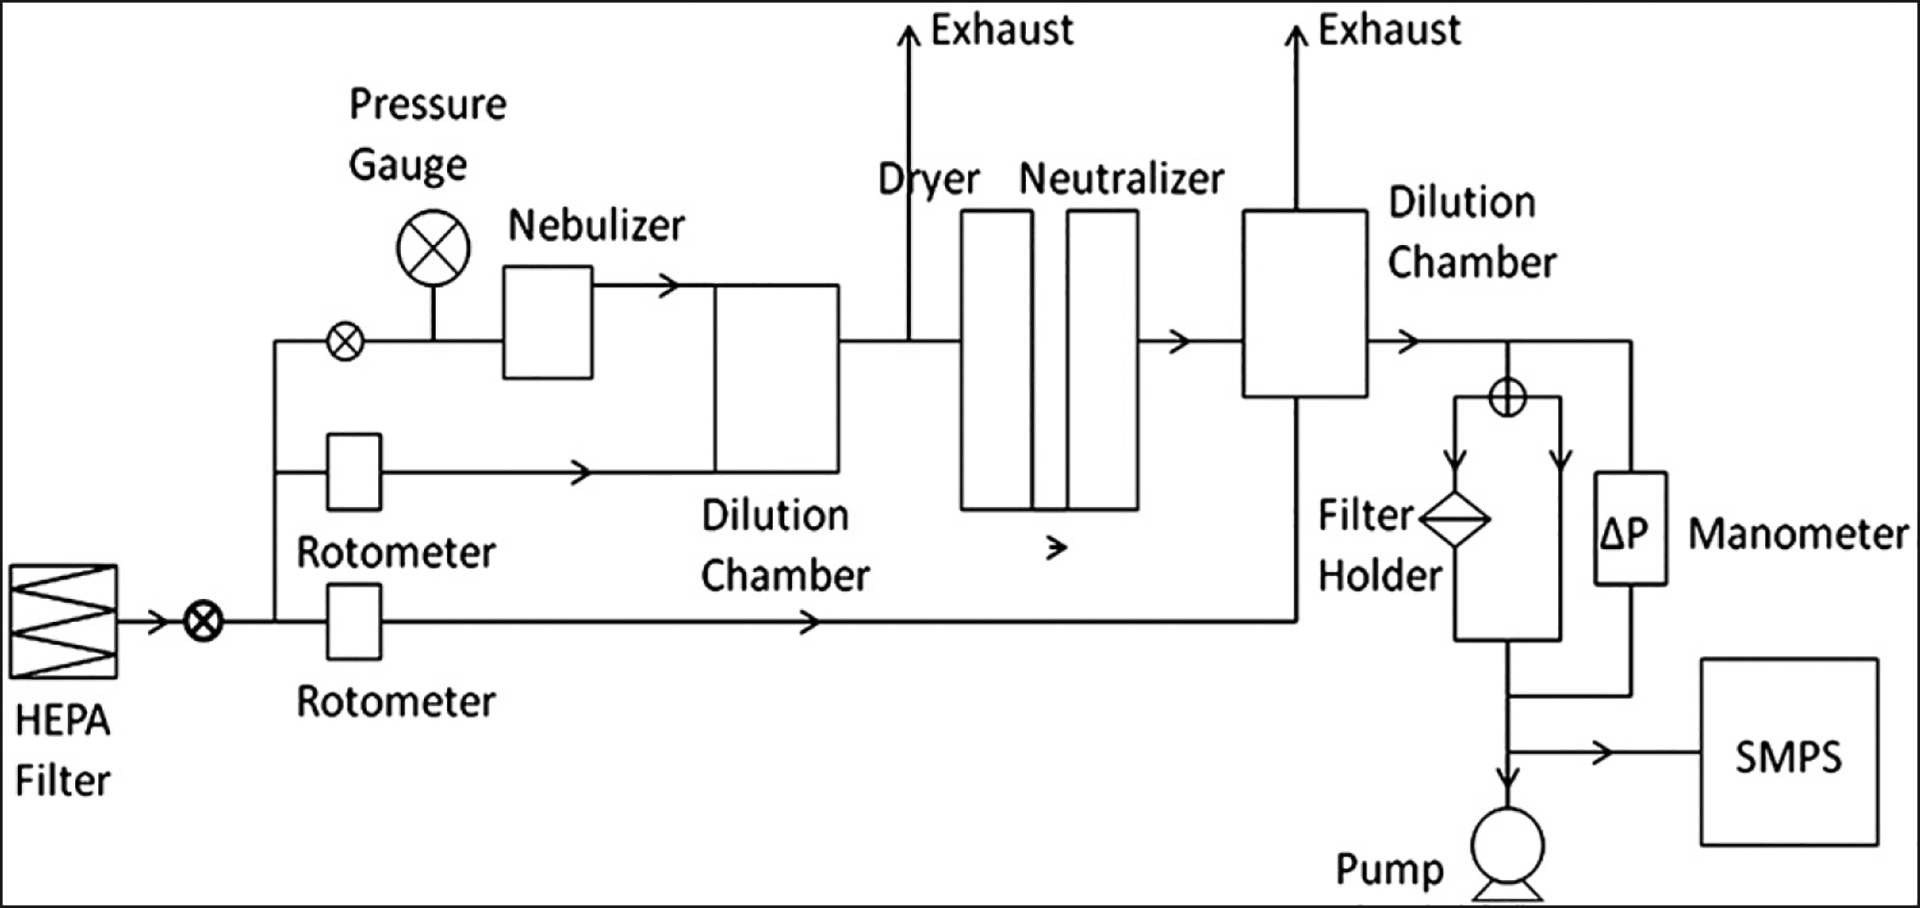
Experimental setup for measuring filter collection efficiency.
A ball valve was then used to manually divert the aerosol to pass through either a filter or a bypass line. In the filter line, a filter was placed in a conductive polypropylene cassette (Model 225–321, SKC inc., Eighty Four, PA), modified to accommodate two o-rings for securing the filter without a support pad. Filters were held above a Po-210 neutralizer for several seconds per side of the filter to eliminate static charge before they were placed in the filter cassettes. A manometer was used to ensure that there was no appreciable increase in pressure drop across the filter, which would indicate filter clogging. A scanning mobility particle sizer (SMPS, Model 5.402, GRIMM Technologies Inc., Douglasville, PA, USA) was used to measure the particle concentrations by size upstream (bypass line) and downstream (filter line) of the filter. A secondary pump was used to supplement the 0.3 Lpm flow from the SMPS to achieve the test air flows of 1 and 5 Lpm.
Three separate filters were tested per set of conditions. For each filter tested, four measurements were taken from the bypass line using the SMPS set to a cycle time of 406 s, with three filtered measurements taken in between bypass measurements. After collection, filters were stored in a desiccant chamber to minimize moisture absorption of the dry salt particles. Filters were subsequently cut into sections and adhered onto SEM pin mounts using silver paint. Samples were then palladium-coated using a sputter coater (Model K550, EM Technologies Ltd., Ashford, UK) for SEM analysis.
2.3. Experimental measurement of filter collection efficiency
Using images obtained with a field mission SEM (FE-SEM, Sirion 400, FEI Company, Hillsboro, OR, USA), particles were visually counted and grouped into five size bins consisting of the following ranges: 18–32, 32–56, 56–100, 100–178, and 178–316 nm. Surface collection efficiencies by particle size were estimated by
| (1) |
where Af is the total filter surface area, SLi is the particle surface loading for each size bin in particles per unit area, Q is the air flow rate through the filter, and t is the sample collection time. The SMPS upstream filter measurements (C0,i) were sorted into the same size bins used for the visual particle counts. For each set of conditions, surface collection efficiencies were estimated separately for three filters and averaged.
The SMPS upstream and downstream filter measurements were used to calculate overall collection efficiencies for each size bin using
| (2) |
where CP,i is the SMPS downstream filter measurement (the particle number concentration that penetrated the filter). Three overall collection efficiencies were measured per filter. Since three filters were tested per set of conditions, the overall collection efficiencies were calculated as the mean of nine measurements.
2.4. Statistical analysis
A one-way unstacked analysis of variance (ANOVA) was used separately for each size bin to test for significant differences between surface collection efficiencies of at least two of the sets of experimental conditions. If a significance level (p-value) of 0.1 or less was identified for a given size bin, then Tukey’s test was used to identify which sets of experimental conditions had significantly different collection efficiencies.
2.5. Theoretical model of filter collection efficiency
In this work, we used Manton’s (1979) model for the filter overall collection efficiency (ηo), which is calculated as one minus the product of the penetrations (1 – η) of each physical mechanism of particle deposition to the filter, such that
| (3) |
The filter surface collection efficiency (nS) is calculated by removing the term for interception and diffusion to the pore walls, so that
| (4) |
The collection efficiency terms for each deposition mechanism are taken from a combination of equations developed by Spurny et al. (1969), Manton (1979), and Marre and Palmeri (2001), and the original work of the authors noted below:
interception and impaction
| (5) |
interception
| (6) |
impaction (Pich, 1964)
| (7) |
diffusion to pore wall (Twomey, 1962)
| (8) |
diffusion to filter surface
| (9) |
For brevity, a detailed description of the variables α1, α2, D, ηi, ND, NG, NR, and ξ, as well as the sources where the equations were obtained, is given in Table 2.
Table 2.
Description of variables used to calculate theoretical collection efficiency of CPM filters.
| Variable | Description | Value | Source |
|---|---|---|---|
| α1 | Coefficient | 4.57 – 6.46P+4.58P2 | Eq. (6.3), Manton (1979) |
| α2 | Coefficient | 4.5 | Eq. (6.1), Manton (1979) |
| D 0 | Pore diameter | Varies | |
| D p | Particle diffusion coefficient | Varies | |
| d p | Particle diameter | Varies | |
| 𝒟 | Particle diffusion coefficient, normalized for face velocity (V0) and number of pores divided by area (N0) | Eqs. (2.1) & (2.3), Manton (1979) | |
| η i | Stokes-based impaction parameter | Eq. (44), Marre and Palmeri (2001); Eq. (8), Spurny et al. (1969) |
|
| l g | Slip length, where λ is mean free path of gas molecules | 1.126λ | Eq. (19), Marre et al. (2004) |
| N D | Coefficient of diffusive collection, where L is filter thickness and R0 is pore radius | Eq. (11), Spurny et al. (1969) | |
| N G | Slip parameter | Eq. (13), Marre and Palmeri (2001) | |
| N g | Slip parameter | Eq. (14), Marre and Palmeri (2001) | |
| N r | Pore and particle diameter-based interception parameter | Eq. (12), Marre and Palmeri (2001) | |
| Nr | Particle radius, normalized for pore radius | Eq. (3), Marre and Palmeri (2001) | |
| P | Filter porosity | Eq. (2.1), Manton (1979) | |
| R 0 | Pore radius | Varies | |
| r p | Particle radius | Varies | |
| Stk | Stokes number, where m is particle mass, Cs is Cunnigham slip factor, and η is gas viscosity | Eq. (46), Marre and Palmeri (2001) | |
| ξ | Porosity-based parameter | Eq. (45), Marre and Palmeri (2001); Eq. (9), Spurny et al. (1969), Pich (1964) |
Deposition mechanism terms take into account particle size, filter geometry, and approximate particle trajectories. The diffusion terms include the particle’s diffusion coefficient (Manton, 1979). Both the impaction and interception terms contain terms for particle slip, with the impaction term also containing a term for particle inertia (Marre & Palmeri, 2001). Eq. (3) was used to generate a theoretical overall collection efficiency curve by size, which was compared to experimentally measured efficiencies. Similarly, Eq. (4) was used to calculate the theoretical surface collection efficiency curve to compare to measured efficiencies.
3. Results
Experimentally measured and theoretically derived surface collection efficiencies by particle size for each set of test conditions are plotted in Figs. 3–5 and tabulated values of measured efficiencies are listed in Table 3. In these figures, surface collection efficiency data are presented as the mean of three measurements and the error bars represent one standard deviation from the mean. The numbers of particles that were visually counted from the filter surfaces are also presented for each size bin and experimental condition.
Fig. 3.
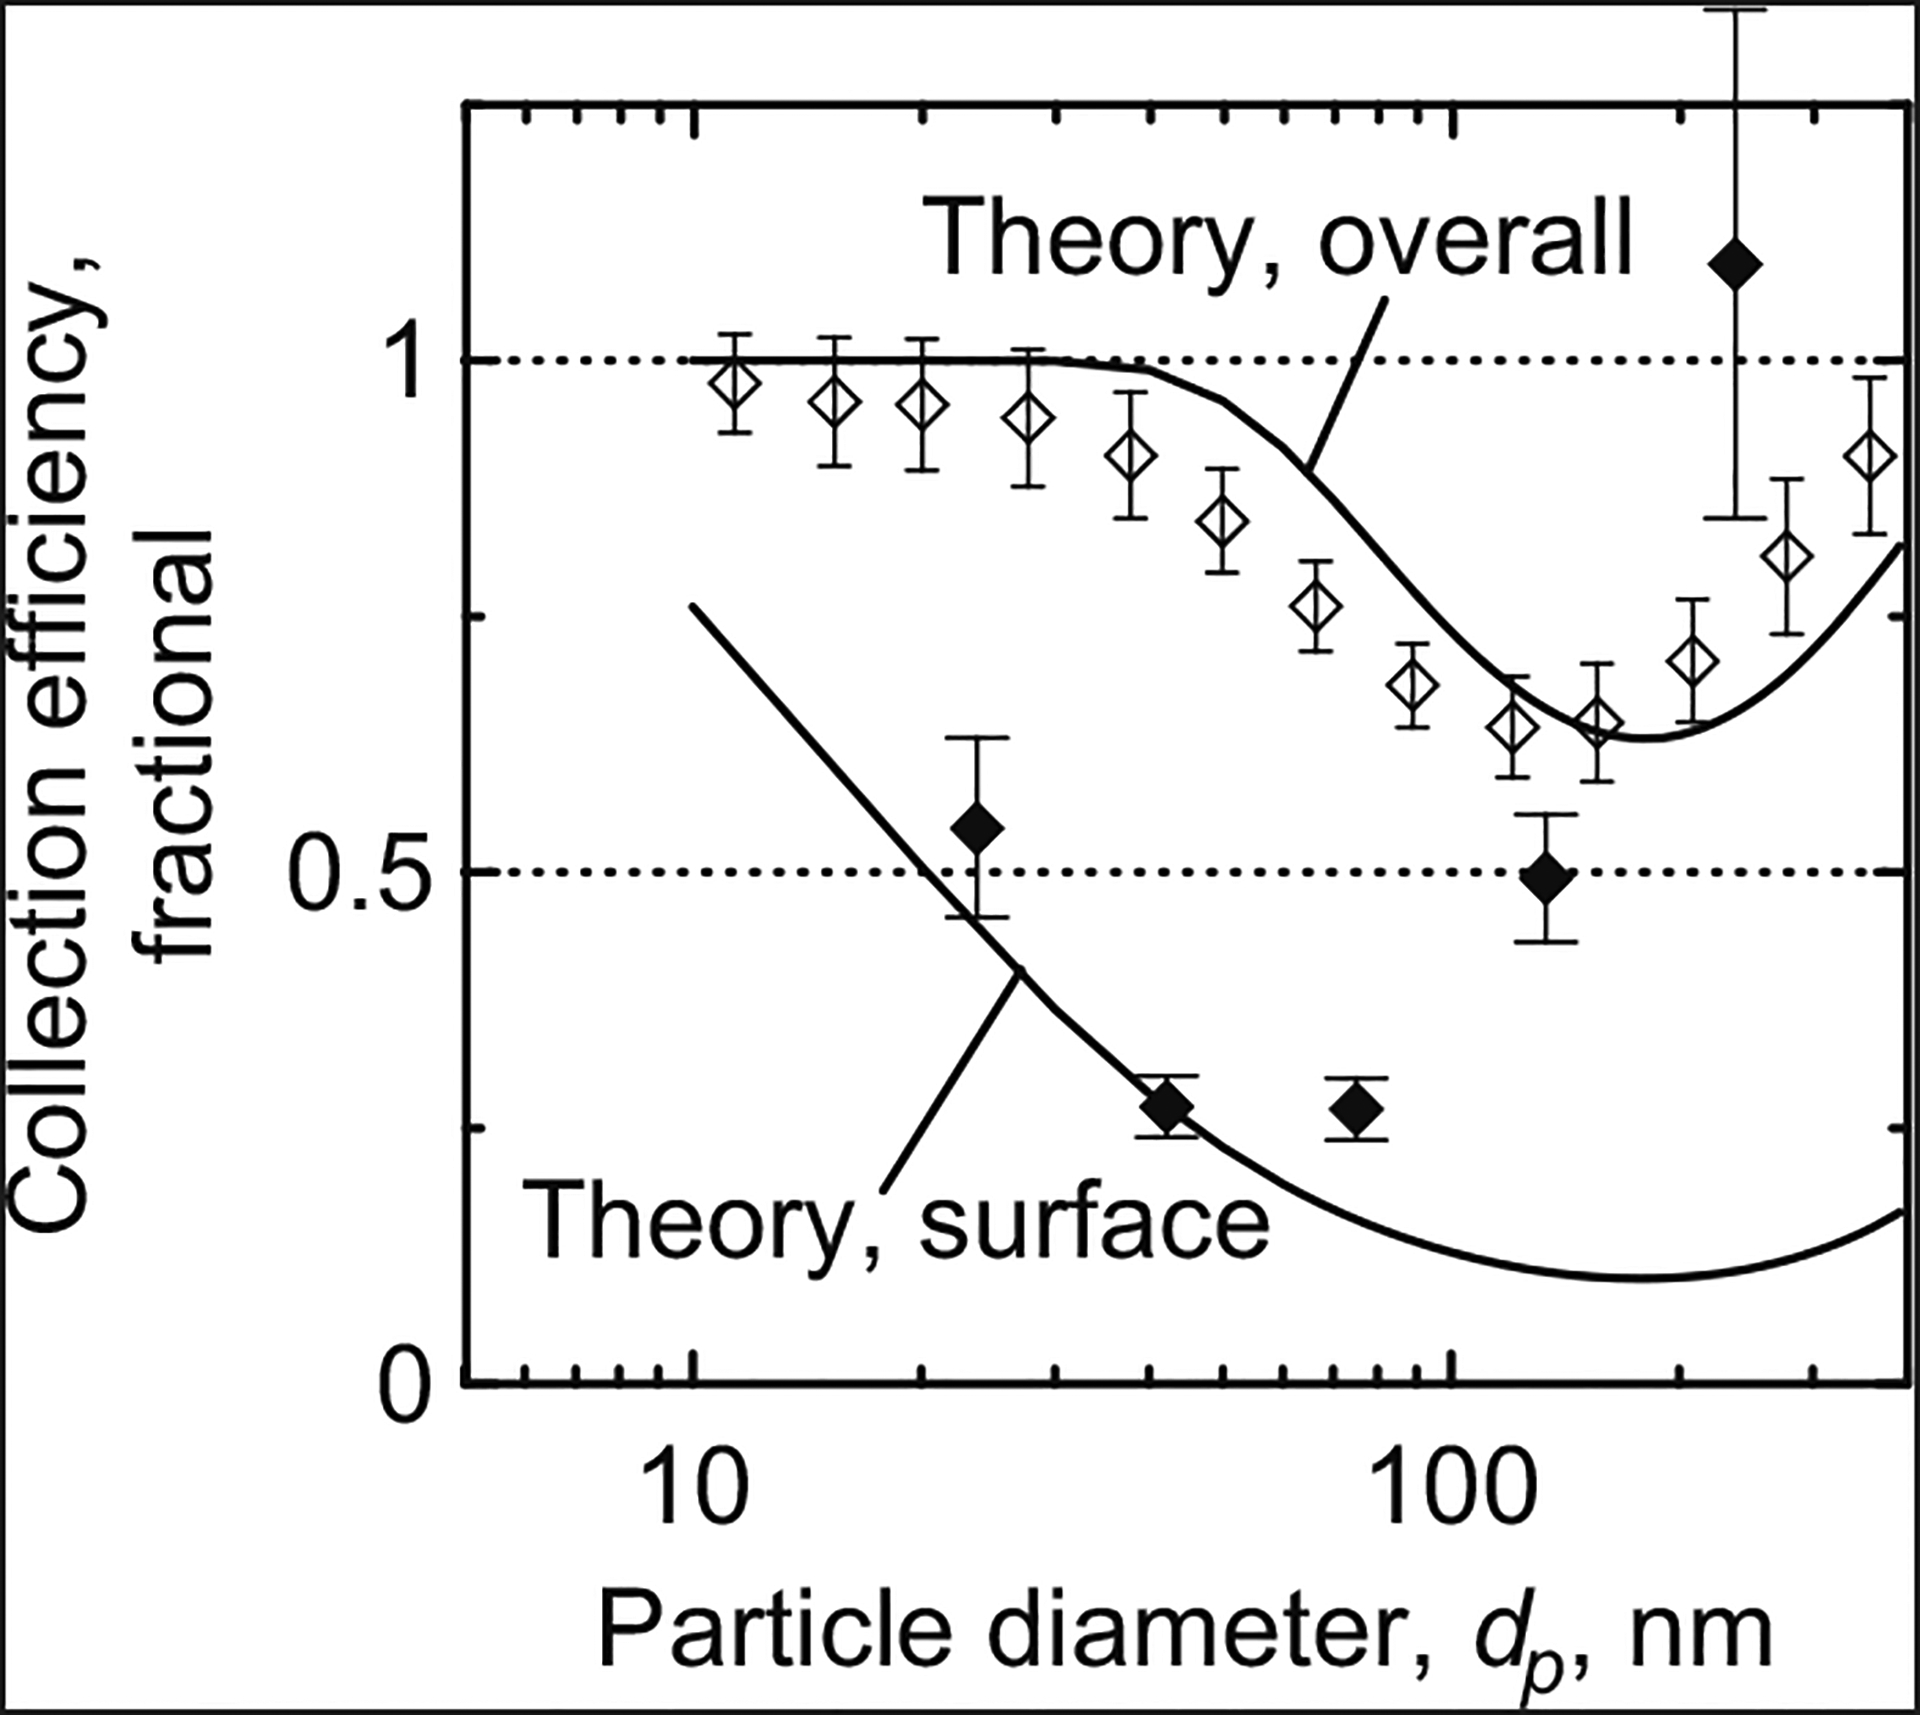
Particle collection efficiency by size at V0=3.7 cm/s (Q=1 Lpm) and D0=0.72 μm. Filled symbols indicate surface collection efficiency (n=3, 1σ); open symbols indicate overall collection efficiency (n=9, 1σ).
Fig. 5.
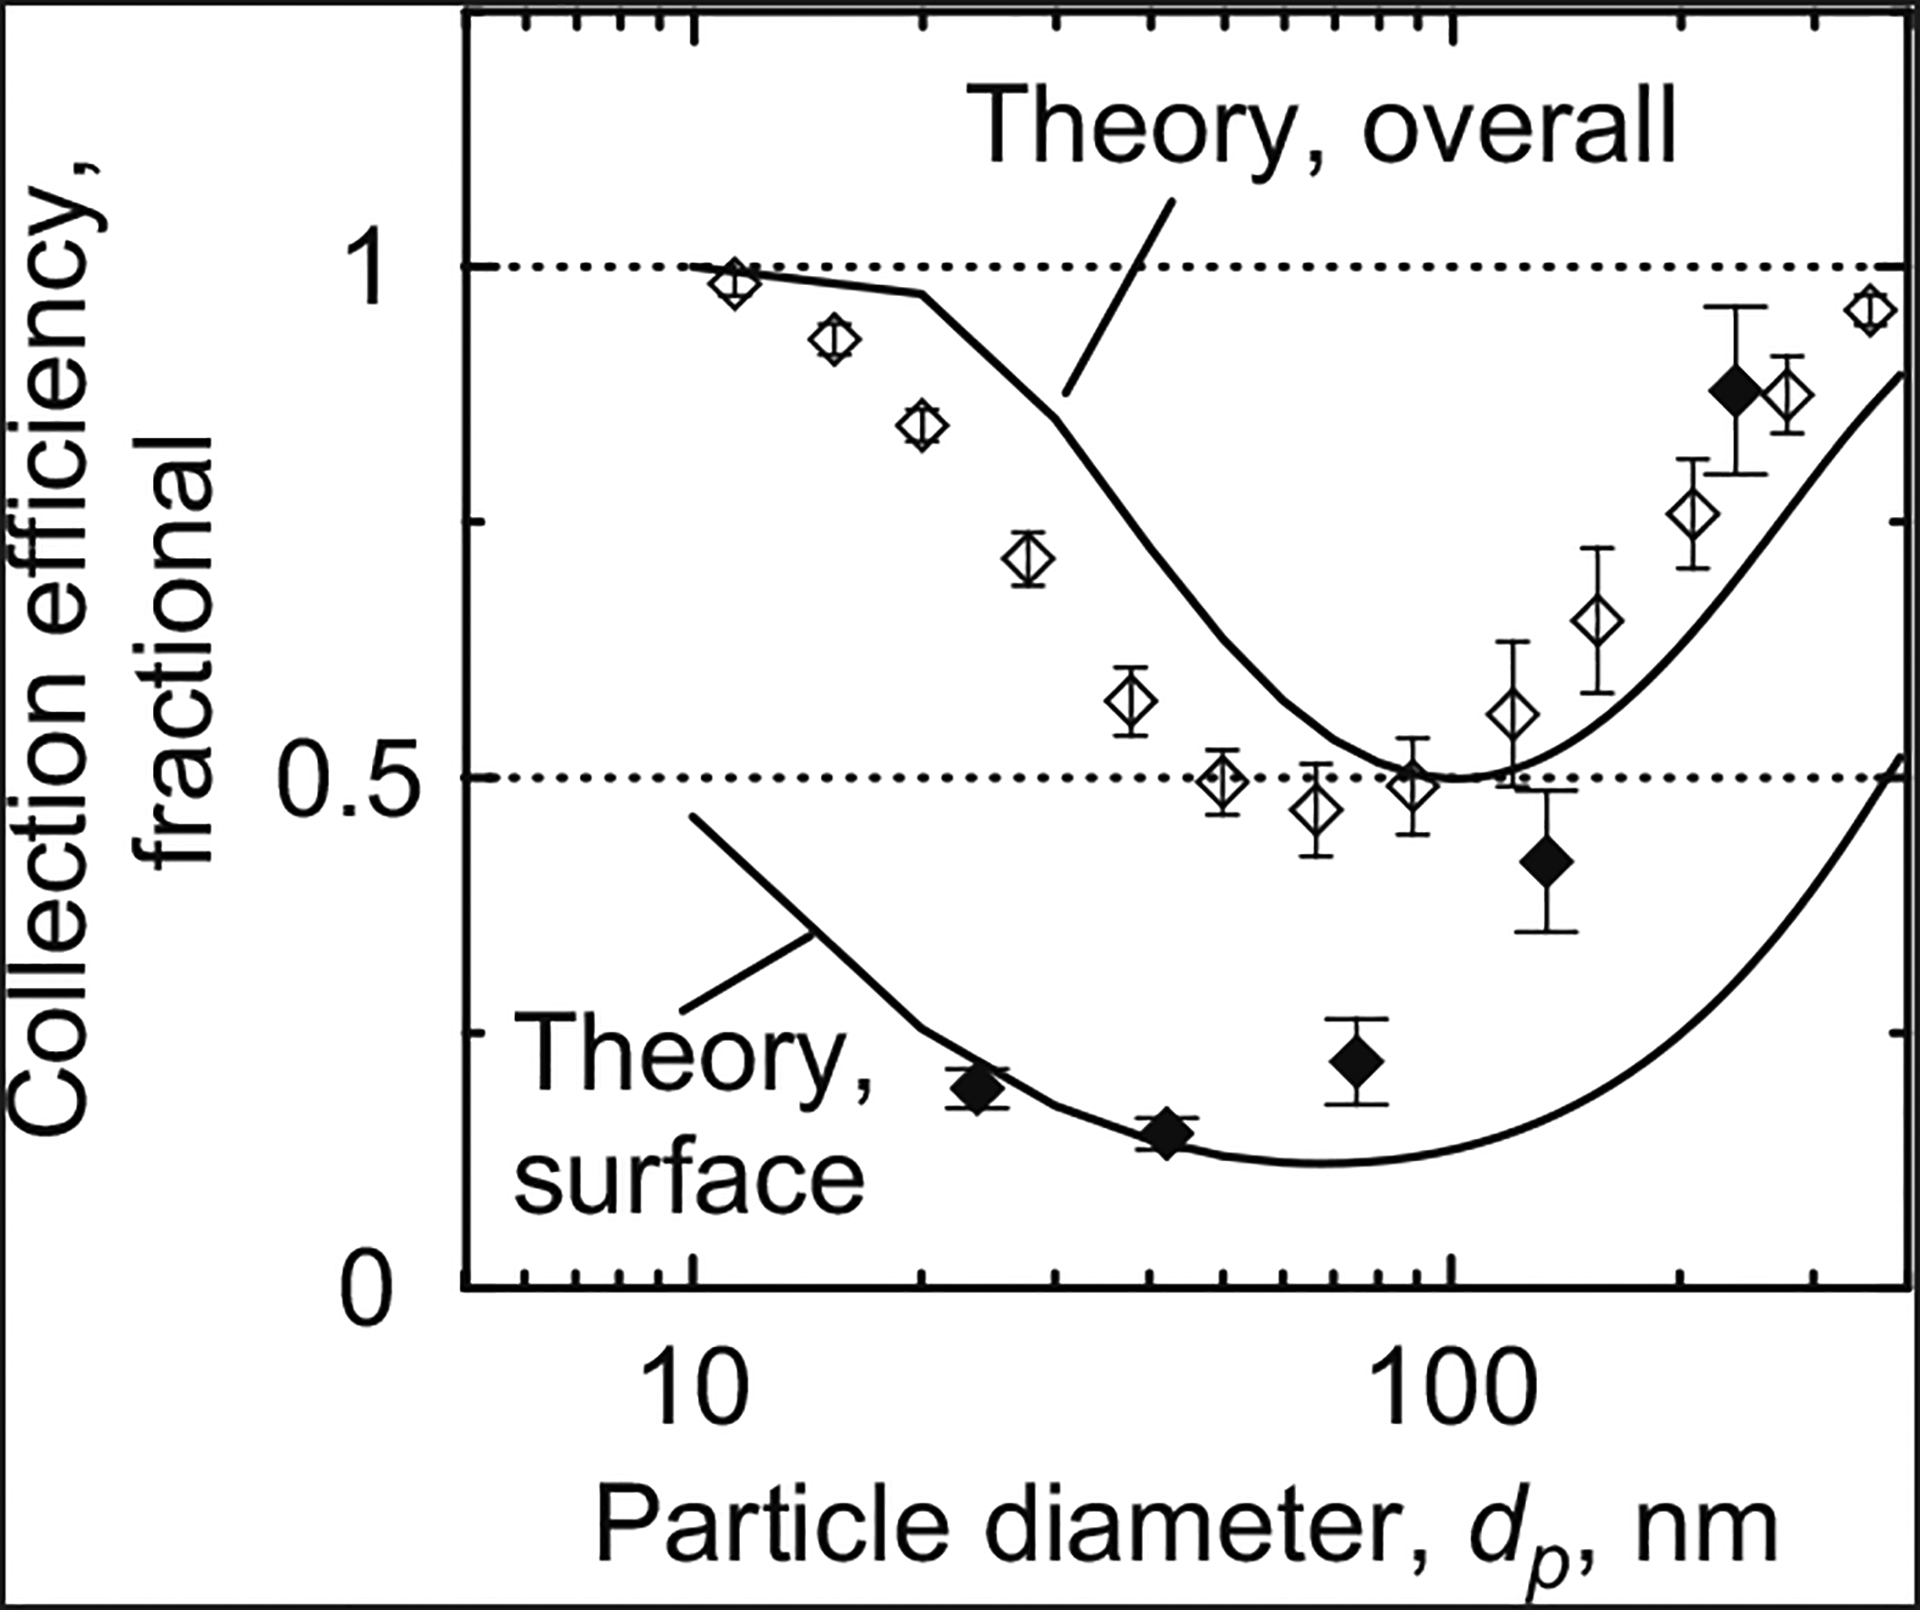
Particle collection efficiency by size at V0=18.4 cm/s (Q=5 Lpm) and D0=0.72 mm. Filled symbols indicate surface collection efficiency (n=3, 1σ); open symbols indicate overall collection efficiency (n=9, 1σ).
Table 3.
Measured surface collection efficiencies for each size bin and set of experimental conditions.
| Surface collection efficiency (fractional, mean ± 1σ) | |||||||
|---|---|---|---|---|---|---|---|
| Mid-point dp (nm) | V0=3.7 cm/s, D0=0.29 μm | Number of particles | V0=3.7cm/s, D0=0.72μm | Number of particles | V0=18.4 cm/s, D0 = 0.72 μm | Number of particles | p-value* |
| 24 | 0.41 ± 0.04 | 867 | 0.54 ± 0.09 | 574 | 0.20 ± 0.02** | 311 | 0.001 |
| 42 | 0.22 ± 0.08 | 558 | 0.27 ±0.03*** | 417 | 0.15 ± 0.02*** | 249 | 0.065 |
| 75 | 0.22 ± 0.03 | 409 | 0.27 ± 0.03 | 329 | 0.22 ± 0.04 | 307 | 0.252 |
| 133 | 0.42 ± 0.05 | 270 | 0.49 ± 0.06 | 218 | 0.42 ± 0.07 | 252 | 0.296 |
| 237 | 0.83 ±0.04 | 197 | 1.09 ±0.25 | 193 | 0.88 ± 0.08 | 190 | 0.155 |
p-value for the ANOVA testing whether significant differences existed between any two sets of experimental conditions.
Denotes collection efficiency significantly different (per Tukey’s test) than other collection efficiencies in same size bin.
Denotes collection efficiencies significantly different (per Tukey’s test) from each other.
Two sample SEM micrographs are depicted in Figs. 6 and 7, which display particles collected on the surface of filters for two separate sets of experimental conditions. Particles deposited onto the interstitial space around the pores, which have average diameters of 0.29 μm (Fig. 6) and 0.72 μm (Fig. 7). The numbers of particles visually counted for all filters tested yielded the reported numbers of particles in Table 3. For this analysis, the following set of counting rules was developed: particles that appeared to be joined were counted as separate particles; particles seen inside the pores were counted; particles on the edges of the images were counted if they appeared to be at least halfway in the image; particles similar in size to the cutoff for a size bin were placed in the larger bin.
Fig. 6.
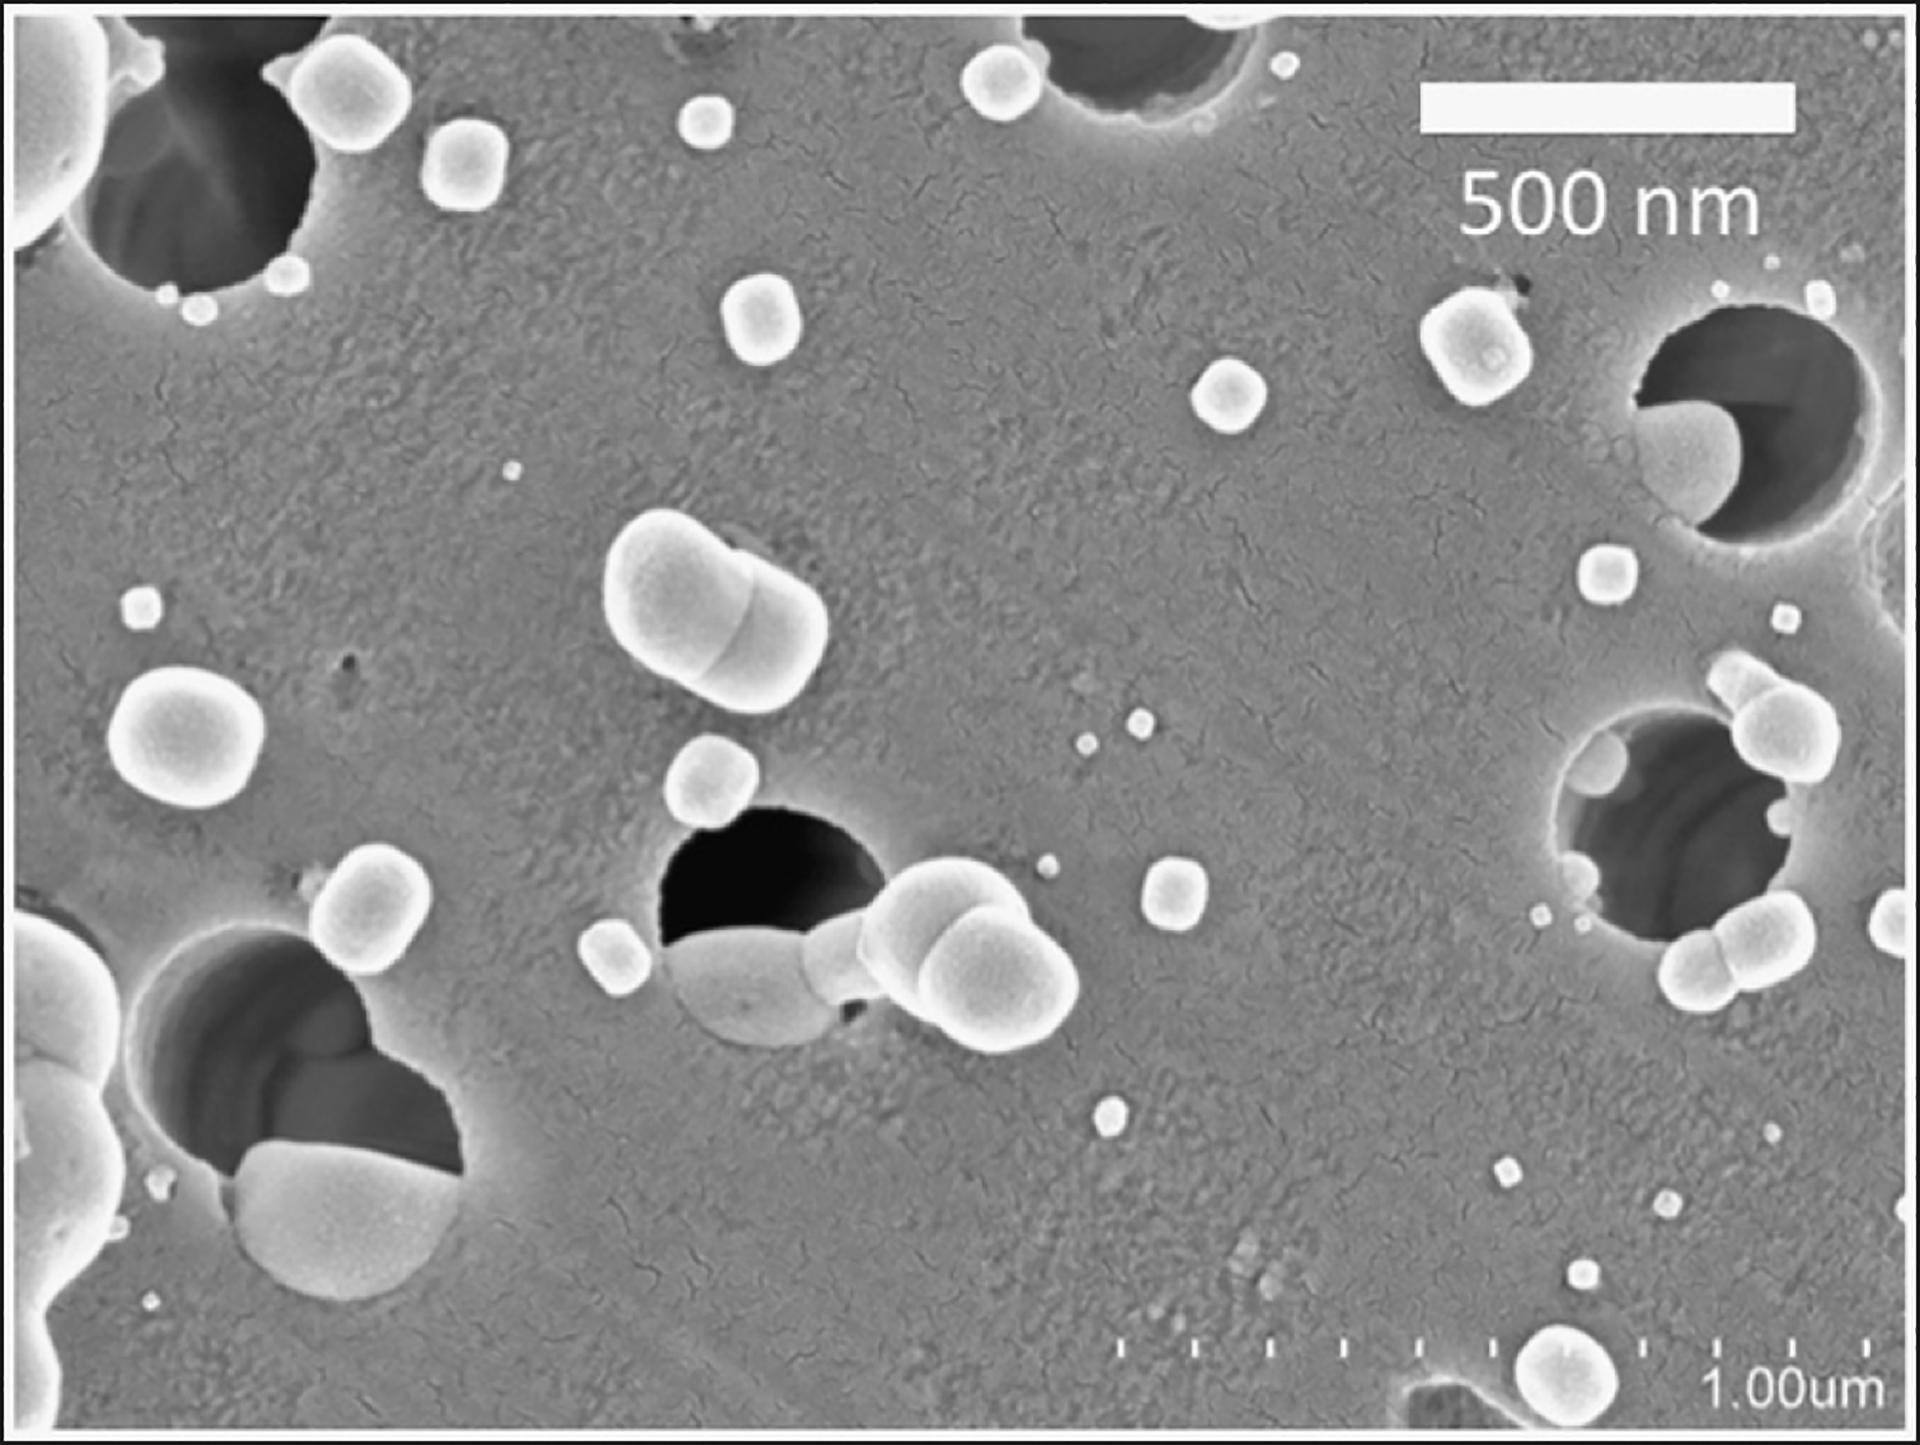
SEM micrograph of filter surface, with pores and deposited particles, for experimental conditions of V0=3.7 cm/s (Q=1 Lpm) and D0=0.29 μm.
Fig. 7.
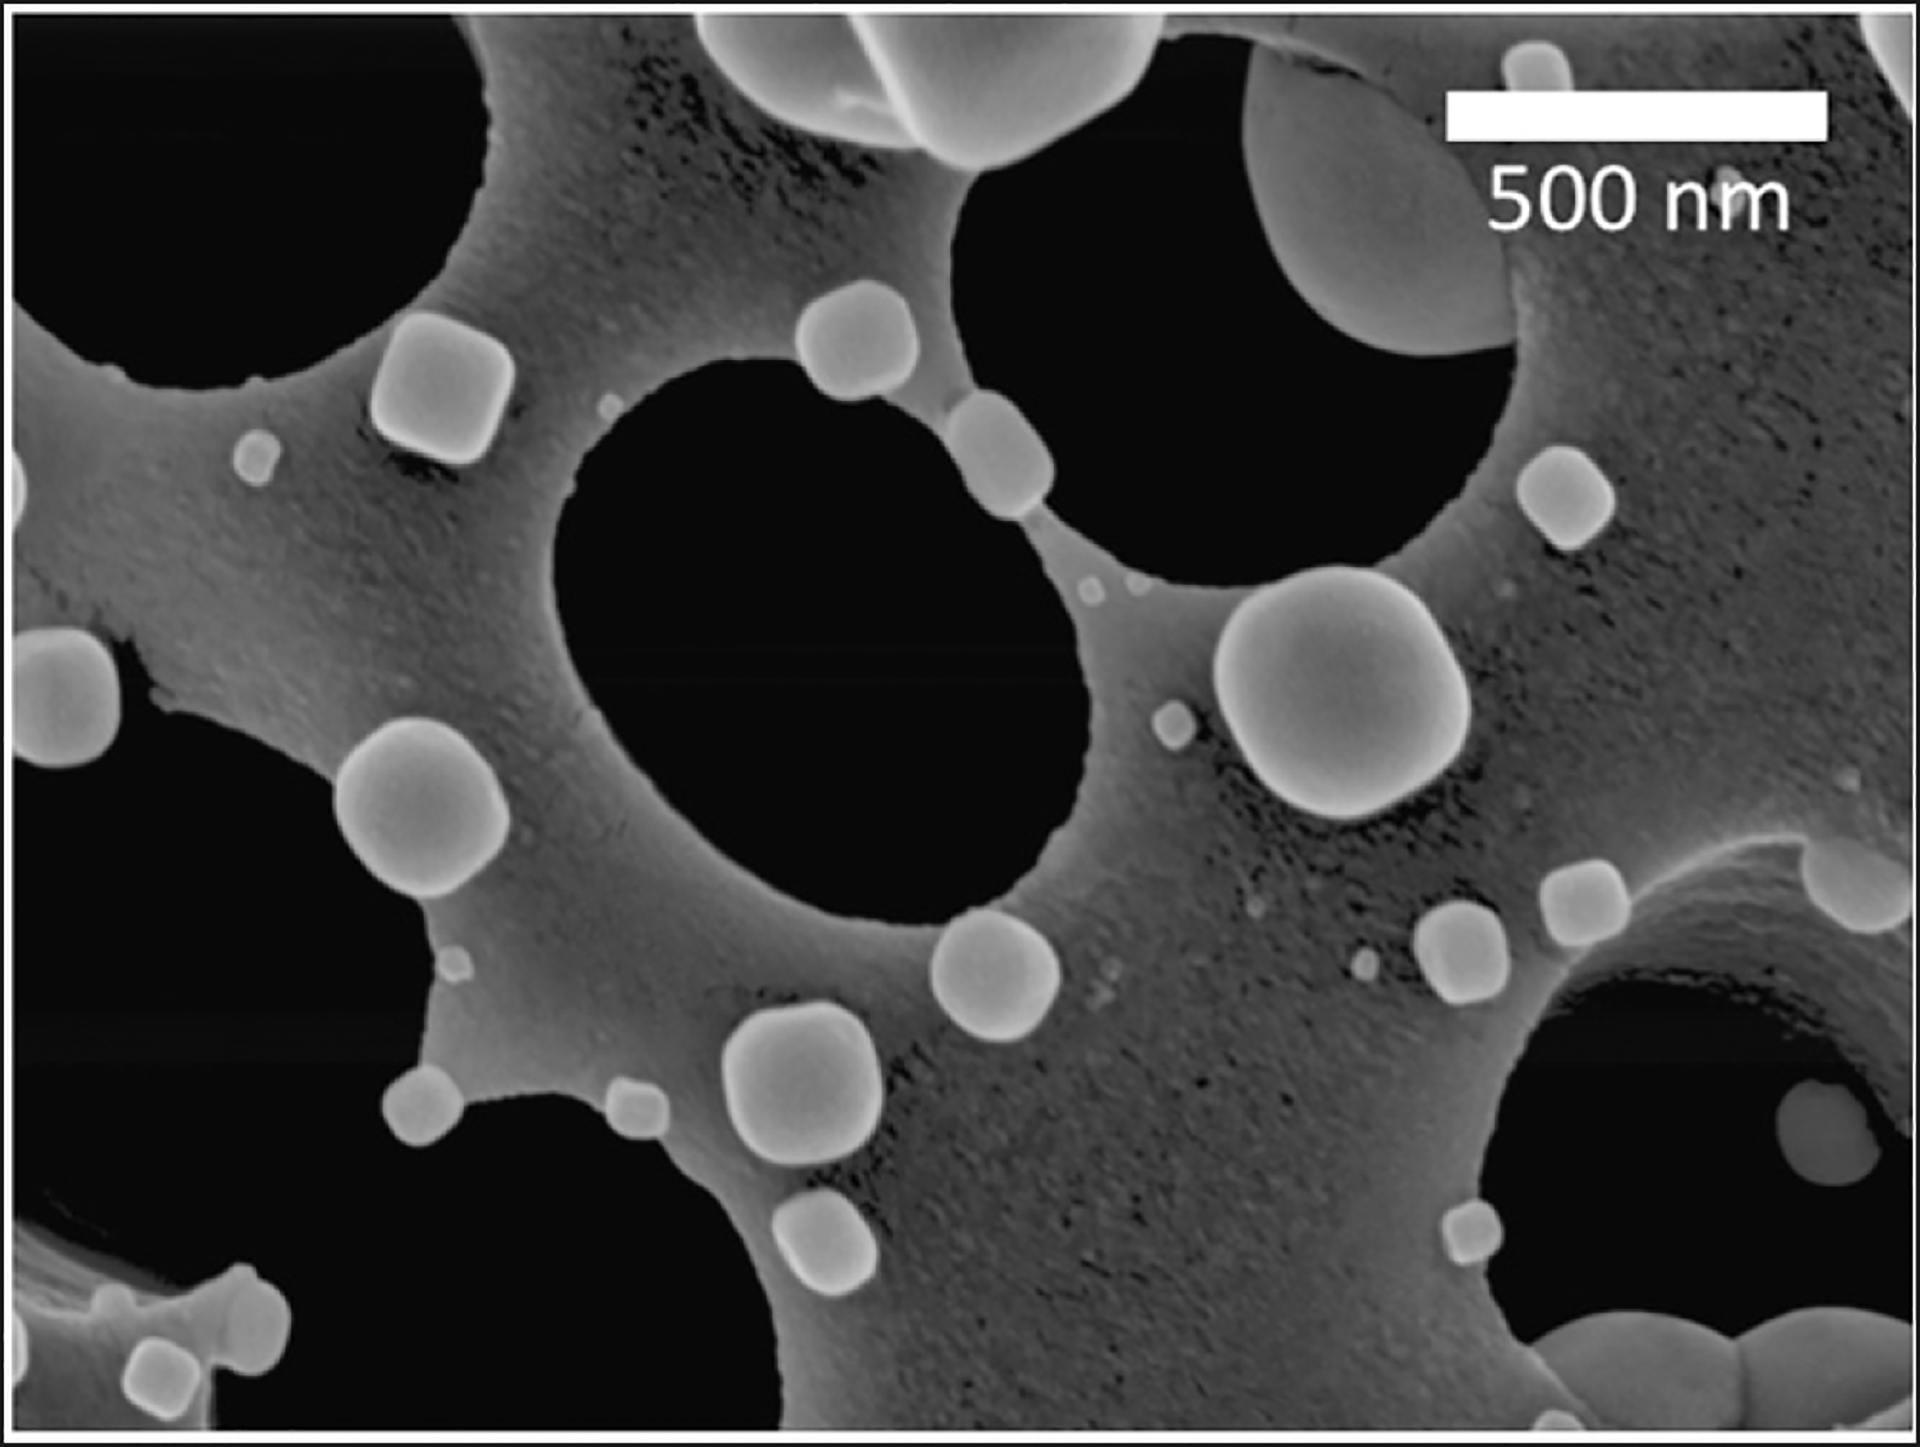
SEM micrograph of filter surface, with pores and deposited particles, for experimental conditions of V0=18.4 cm/s (Q=5 Lpm) and D0=0.72 μm.
Starting with the smallest particles and increasing in size, the measured surface collection efficiencies depicted in Figs. 3–5 monotonically decreased until reaching a minimum efficiency of around 20% for all experimental conditions. Continuing on to progressively larger particles, collection efficiencies monotonically increased until reaching a maximum efficiency of about 100% for particles larger than about 240 nm. Efficiencies estimated from theory followed a similar trend across particle size. However, theoretical surface collection efficiencies were consistently lower than measured collection efficiencies as particle size increased past the size of minimum collection.
Using ANOVA, the measured surface collection efficiencies were not found to be statistically different among test conditions for the size bins with midpoint diameters of 75 nm (p=0.252), 133 nm (p=0.296), and 237 nm (p=0.155), but were statistically different for the size bins with midpoint diameters of 24 nm (p=0.001) and 42 nm (p=0.065), as shown in Table 3. Tukey’s test was used to specify which test conditions had significantly different surface collection efficiencies. For the size bin with a midpoint diameter of 24 nm, the mean collection efficiency was significantly lower for the tests with a 5 Lpm flow rate than for the 1 Lpm tests with either pore size. For the size bin with a midpoint diameter of 42 nm, the mean collection efficiency was significantly lower for the tests with a 5 Lpm flow rate and a 0.72 μm pore size than for the tests with a 1 Lpm flow rate and the same pore size. Significant differences in measured surface collection efficiencies due to changes in test conditions were not observed for any of the other size bins.
Measured and theoretical overall collection efficiency results are also plotted in Figs. 3–5 and tabulated values of measured efficiencies are given in Table 4. Measured overall efficiencies are presented as the mean of nine measurements with error bars spanning one standard deviation from the mean. They followed the same trend across particles size as the surface collection efficiencies, except for that the overall collection efficiencies were about 100% for the smallest particles. The measured overall collection efficiency minima were higher than 47% for all pore sizes and flow rates tested, much higher than the 20% minima observed for the surface collection efficiencies. Overall collection efficiencies were shown to increase slightly (maximum 15%) from the first SMPS measurement to the last due to pore clogging in the filters. Theoretically estimated overall collection efficiencies coincided well with measured overall collection efficiencies for all test conditions.
Table 4.
Measured overall collection efficiencies for each size bin and set of experimental conditions.
| Overall collection efficiency (fractional, mean ± 1σ) | |||||
|---|---|---|---|---|---|
| Low dp (nm) | Midpoint dp (nm) | High dp (nm) | V0=3.7cm/s, D0(, = 0.29 μm | V0=3.7 cm/s, D0=0.72 μm | V0=18.4 cm/s, D0=0.72 μm |
| 9 | 11 | 13 | 0.99 ± 0.01 | 0.98 ± 0.05 | 0.98 ± 0.01 |
| 13 | 15 | 17 | 0.99 ± 0.01 | 0.96 ± 0.06 | 0.93 ± 0.02 |
| 17 | 20 | 23 | 0.99 ± 0.01 | 0.96 ± 0.06 | 0.84 ± 0.02 |
| 23 | 28 | 33 | 0.99 ± 0.02 | 0.94 ± 0.07 | 0.71 ± 0.03 |
| 33 | 38 | 43 | 0.99 ± 0.02 | 0.91 ± 0.06 | 0.57±0.03 |
| 43 | 50 | 57 | 0.98 ± 0.02 | 0.84 ± 0.05 | 0.50 ± 0.03 |
| 57 | 66 | 76 | 0.98 ± 0.02 | 0.76 ± 0.04 | 0.47 ± 0.04 |
| 76 | 89 | 102 | 0.98 ± 0.02 | 0.68 ± 0.04 | 0.49 ± 0.05 |
| 102 | 121 | 139 | 0.98 ± 0.02 | 0.64 ± 0.05 | 0.56 ± 0.07 |
| 139 | 156 | 173 | 0.98 ± 0.03 | 0.65 ± 0.06 | 0.65 ± 0.07 |
| 173 | 208 | 244 | 0.98 ± 0.02 | 0.71 ± 0.06 | 0.76 ± 0.05 |
| 244 | 277 | 311 | 0.99 ± 0.01 | 0.81 ± 0.08 | 0.87 ± 0.04 |
| 311 | 357 | 402 | 0.99 ± 0.01 | 0.91 ± 0.08 | 0.96 ± 0.01 |
| 402 | 465 | 528 | 1.00 ± 0.01 | 0.97 ± 0.04 | 0.98 ± 0.01 |
4. Discussion
4.1. Surface collection efficiency
Surface collection efficiencies of CPM filters reached values substantially lower than 100% over the range of air flows, filter pore sizes, and particle sizes tested. In fact, measured surface collection efficiencies reached lower than 55% for all particles smaller than 100 nm, regardless of test condition. These findings indicate that a large fraction of particles approaching the filter were not collected on the surface, therefore emphasizing the need to account for surface collection efficiency when deriving airborne particle concentrations from the analysis of CPM filters.
Surface collection efficiencies were relatively high for the smallest particles, which deposit most effectively by diffusion. The progressive drop in collection efficiencies with increasing particle size to a minimum value is consistent with the expectation that as the particle size increases, deposition by diffusion decreases while particle mass remains insufficient for substantial collection by inertial impaction. Then as particle size increases past the size of minimum collection efficiency, the effects of inertial impaction cause a sharp increase in collection efficiencies.
For a given pore size and particle size, surface collection efficiencies were higher for the tests with a slower air flow rate. This observation is consistent with filtration theory for the smaller particles, which dictates that a slower flow rate increases the residence time of particles and thus increases their deposition by diffusion.
Surface collection efficiencies were not statistically different for filters with different pore sizes at a given air flow rate and particle size. This finding was expected considering that the 0.72 μm pore size filters had only slightly greater overall porosities than the 0.29 μm pore size filters. Therefore, both filter types had similar pore areas per unit filter area, giving nearly equal opportunity for particles to enter the pores and not be collected onto the filter surface.
4.2. Surface vs. overall collection efficiency
Overall collection efficiencies followed roughly the same trend as surface collection efficiencies, but were usually higher for a given air flow, filter pore size, and particle size. This difference was expected because overall collection efficiency relies on the same deposition mechanisms as surface collection efficiency, with the additional mechanisms of interception and diffusion to the pore walls. The 0.29 μm pore size filters exhibited the greatest difference between surface and overall collection because they had narrower pores and greater total pore wall surface area than the 0.72 μm pore size filters. Regardless of filter pore size, the difference between surface and overall collection efficiencies became less pronounced as particle size increased past the efficiency minima, and this phenomenon is attributed to the diminishing effect of deposition by diffusion to the pore wall. The eventual convergence of the two efficiency curves for the larger size bins suggests that deposition by impaction was largely onto the filter surface.
4.3. Overall collection efficiency
The higher overall collection efficiencies observed with a slower flow rate at a given pore size and particle size for smaller particles is consistent with filtration theory. For particles larger than the size of minimum collection efficiency, the slower flow rate led to slightly lower overall collection efficiencies. This effect was expected because larger particles deposit mainly by inertial impaction, which is attenuated at a slower flow rate.
The overall collection efficiencies were dramatically higher for the smaller pore size filters for a given flow rate and particle size. While the more porous 0.72 μm pore size filters’ overall collection efficiency minimum reached as low as 64%, the minimum for the 0.29 μm pore size filters did not significantly differ from 100%. Particles had a smaller distance to travel in order to deposit inside a 0.29 μm pore, which may have led to the observed difference. Also, the smaller pore sizes would have led to more compacted air streamlines, increasing deposition due to impaction and interception.
4.4. Theoretical model for surface and overall collection efficiency
While the theoretical model matched measured collection efficiencies well for smaller particles, it substantially underestimated surface collection efficiencies for larger particles. This disagreement may be due to the fact that, for surface collection efficiencies, interception was not included in the model. As stated by Manton (1978), impaction and interception are mutually dependent mechanisms of collection; however, the interception term used in this work was developed to describe particle deposition inside the pores. Better agreement was observed between the theory and experiment for overall collection efficiencies, but inconsistencies remained. These inconsistencies may have been caused by errors in particle counting on the filter surface or by the placement of visually counted particles into size bins. Further improvements to the model, such as using more sophisticated approximations of particle trajectories, could also yield closer agreement with experimental results.
4.5. Limitations
While filtration theory dictates that air flow rate and filter pore size affect collection efficiency, no significant differences in surface collection efficiencies to reflect changes in these parameters were observed for the majority of particle sizes.
Additionally, the observed surface collection efficiencies were combined measurements, calculated by dividing the airborne particle concentrations estimated from filter surface loadings by the SMPS measurements for the corresponding size bin. The data were exported using the software’s built-in correction factors for particle losses throughout the SMPS. Another correction factor was used for multiply charged particles. The SMPS classifies particles based on electric mobility, and since a large particle with multiple charges may have the same mobility as a smaller particle with only one charge, a correction factor is necessary. However, the validity of the built-in correction factors is uncertain and needs further evaluation.
The 178–316 nm particles had a measured surface collection efficiency of 109% at a 1 Lpm flow rate and 0.72 μm pore size, which is a nonphysical result. Since the surface collection efficiencies were combined measurements, a collection efficiency of higher than 100% could have been due to either an overestimate of filter surface loading or undercounting of the background particle concentration by the SMPS. The error bars for this abnormally high value in Fig. 3 are large, spanning below 100%, and actual collection efficiency must be lower.
5. Conclusions
Surface and overall collection efficiencies of 25 mm capillary pore membrane filters with 0.29 and 0.72 μm pore diameters were measured for submicron potassium chloride particles at face velocities of 3.7 and 18.4 cm/s. For nanoparticles, collection efficiencies overall were substantially higher than those to the filter surface, indicating that deposition occurs to a large extent inside the filter pores. Observed collection efficiencies compared reasonably well with existing theories for surface collection and very well for overall collection. Surface collection efficiencies were well below 100% for the range of particle sizes tested and must be considered when estimating airborne concentrations from microscopic measurements. With knowledge of surface collection efficiency, size-specific correction factors can be created to estimate airborne particle concentrations from SEM-analyzed filter surface loading.
Fig. 4.
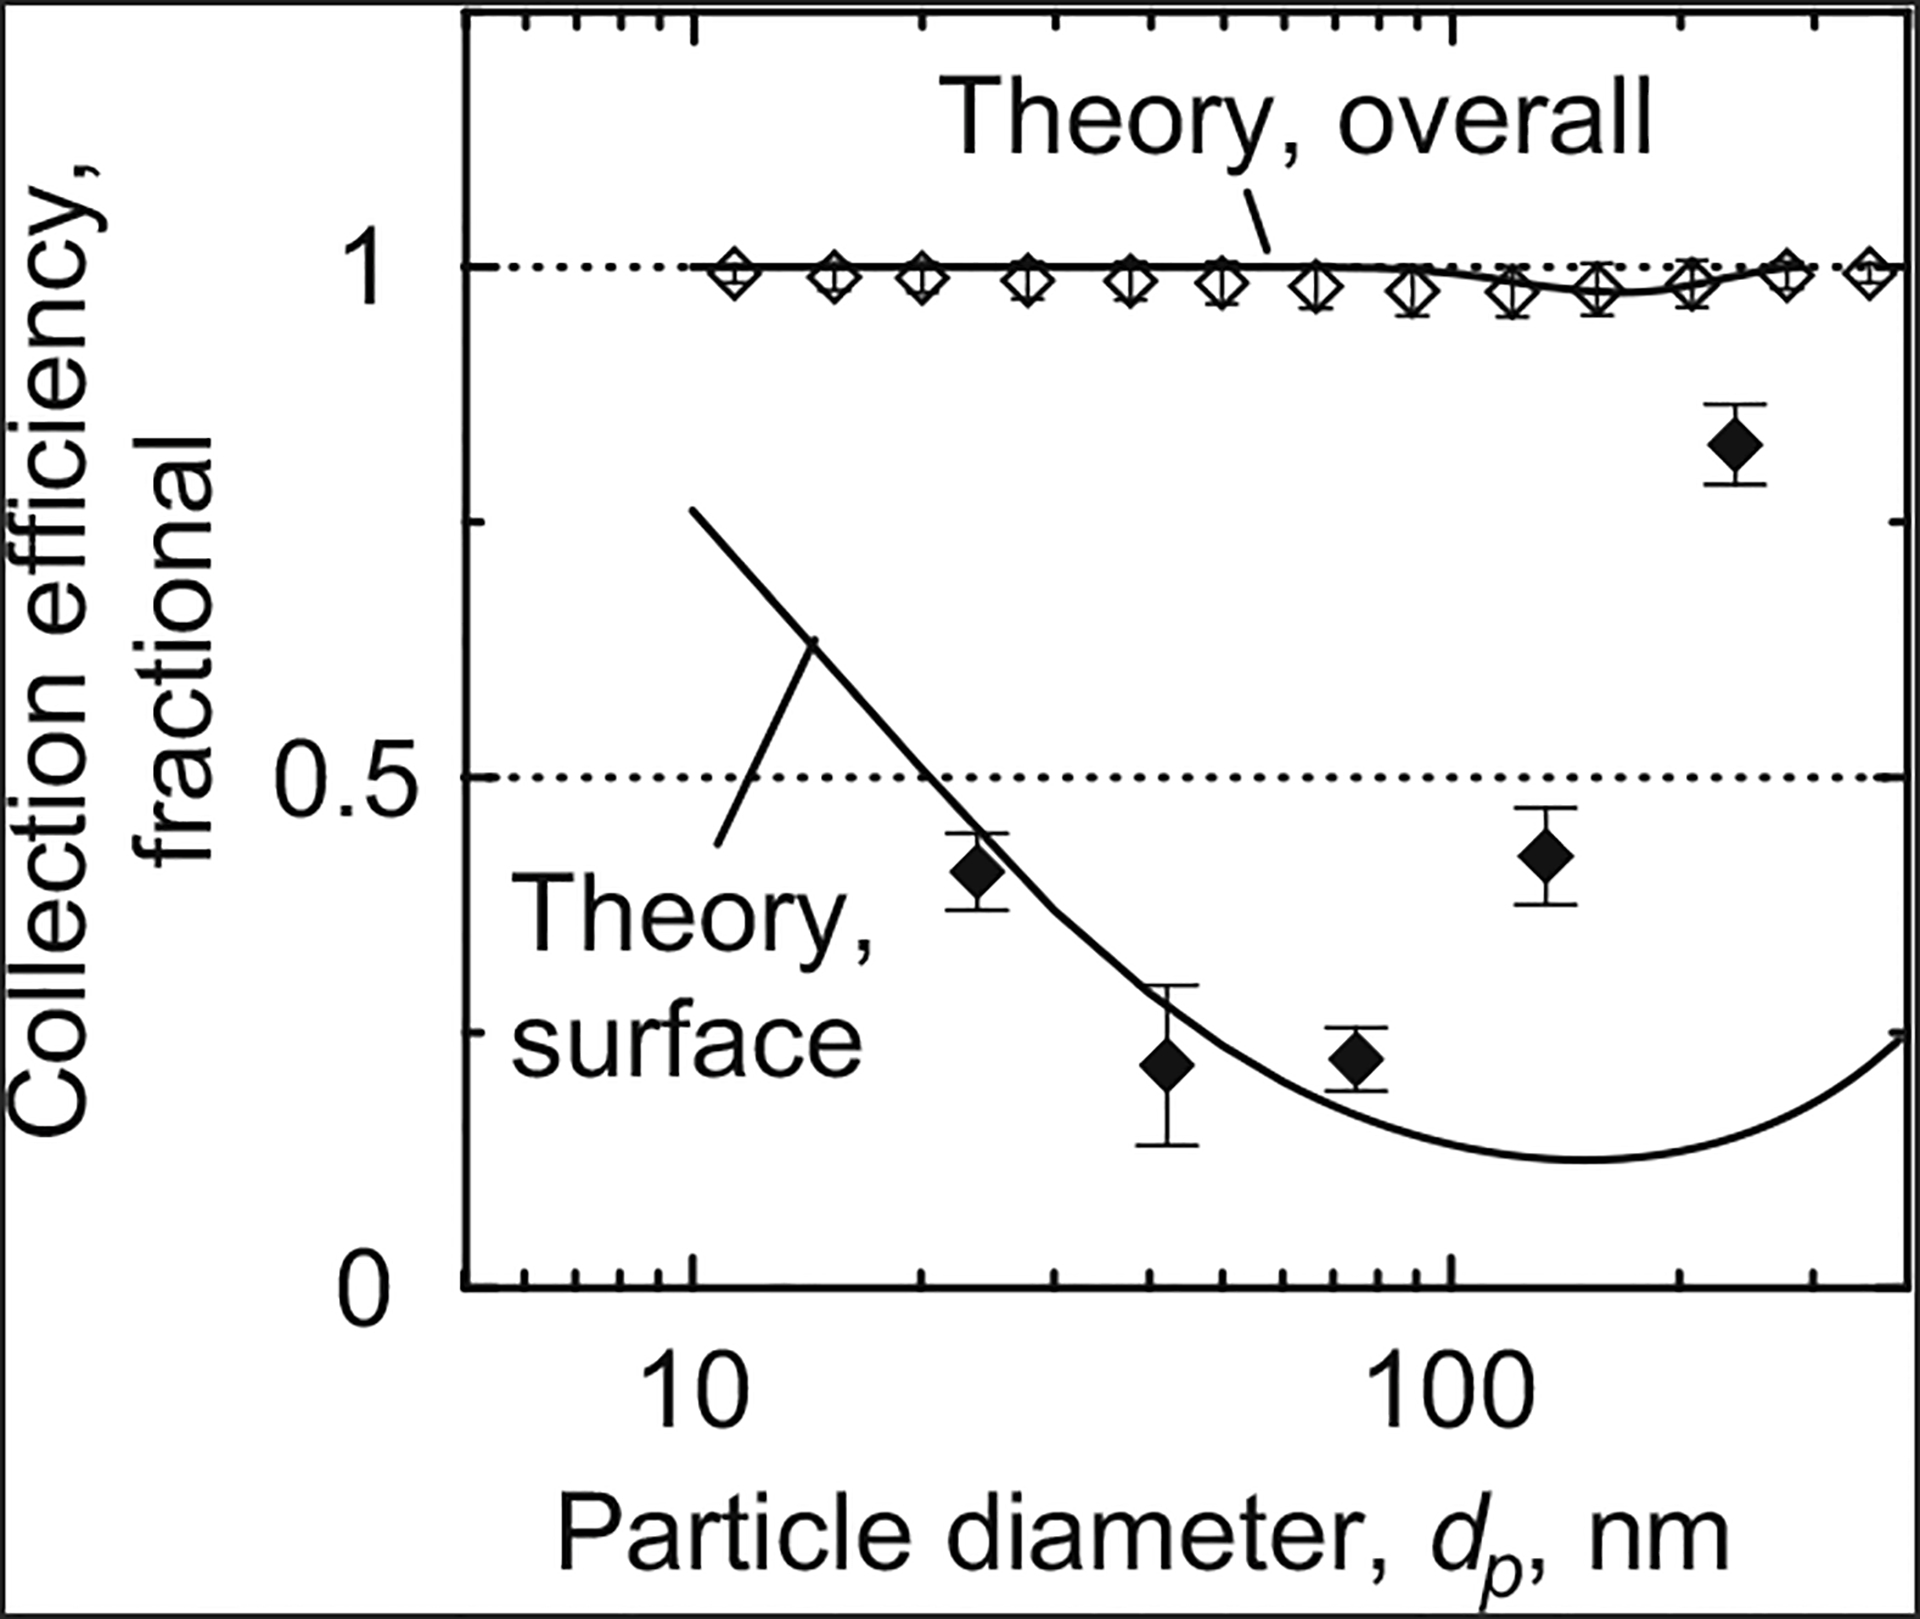
Particle collection efficiency by size at V0=3.7 cm/s (Q=1 Lpm) and D0=0.29 mm. Filled symbols indicate surface collection efficiency (n=3, 1σ); open symbols indicate overall collection efficiency (n=9, 1σ).
Acknowledgement
This work was supported by National Institute of Occupational Safety and Health, Grant no. K01OH009255.
References
- Brouwer DH, Gijsbers JH, & Lurvink MW (2004). Personal exposure to ultrafine particles in the workplace: Exploring sampling techniques and strategies. The Annals of Occupational Hygiene, 48, 439–453. [DOI] [PubMed] [Google Scholar]
- Duffin R, Tran L, Brown D, Stone V, & Donaldson K (2007). Proinflammogenic effects of low toxicity and metal nanoparticles in vivo and in vitro: Highlighting the role of particle surface area and surface reactivity. Inhalation Toxicology, 19, 849–856. [DOI] [PubMed] [Google Scholar]
- Gentry JW, Spurny KR, & Schoermann J (1982). Diffusional deposition of ultrafine aerosols on nuclepore filters. Atmospheric Environment, 16, 25–40. [Google Scholar]
- Huang H, & Yang S (2006). Filtration characteristics of polysulfone membrane filters. Journal of Aerosol Science, 37, 1198–1208. [Google Scholar]
- John W, & Reischl G (1978). Measurements of filtration efficiencies of selected filter types. Atmospheric Environment, 12, 2015–2019. [Google Scholar]
- Liu BYH, & Lee KW (1976). Efficiency of membrane and nuclepore filters for submicrometer aerosols. Environmental Science and Technology, 10, 345–350. [Google Scholar]
- Manton MJ (1978). The impaction of aerosols on a nuclepore filter. Atmospheric Environment, 12, 1669–1675. [Google Scholar]
- Manton MJ (1979). Brownian diffusion of aerosols to the face of a nuclepore filter. Atmospheric Environment, 13, 525–531. [Google Scholar]
- Marre S, & Palmeri J (2001). Theoretical study of aerosol filtration by nucleopore filters: The intermediate crossover regime of Brownian diffusion and direct interception. Journal of Colloid and Interface Science, 237, 230–238. [DOI] [PubMed] [Google Scholar]
- Marre S, Palmeri J, Larbot A, & Bertrand M (2004). Modeling of submicrometer aerosol penetration through sintered granular membrane filters. Journal of Colloid and Interface Science, 274, 167–182. [DOI] [PubMed] [Google Scholar]
- McMurry PH (2000). A review of atmospheric aerosol measurements. Atmospheric Environment, 34, 1959–1999. [Google Scholar]
- Montassier M, Dupin L, & Bouland D (1996). Experimental study on the collection efficiency of membrane filters. Journal of Aerosol Science, 27(Suppl. 1), S637–S638. [Google Scholar]
- Monteiller C, Tran L, MacNee W, Faux S, Jones A Miller B, et al. (2007). The proinflammatory effects of low-toxicity low-solubility particles, nanoparticles and fine particles, on epithelial cells in vitro: The role of surface area. Occupational and Environmental Medicine, 64, 609–615. [DOI] [PMC free article] [PubMed] [Google Scholar]
- NIOSH (1994). NIOSH manual of analytical methods. Washington, DC: National Institute of Occupational Safety and Health. [Google Scholar]
- NIOSH (2006). Approaches to safe nanotechnology: An information exchange with NIOSH. Washington, DC: National Institute of Occupational Safety and Health. [Google Scholar]
- Oberdörster G, Ferin J, & Lenhert BE (1994). Correlation between particle size, in vivo particle persistence, and lung injury. Environmental Health Perspectives, 105(Suppl. 5), 173–179. [DOI] [PMC free article] [PubMed] [Google Scholar]
- Pich J (1964). Impaction of aerosol particles in the neighborhood of a circular hole. Collection of Czechoslovak Chemical Communications, 29, 2223–2227. [Google Scholar]
- Smith TN, Phillips CR, & Melo OT (1976). Diffusive collection of aerosol particles on nuclepore membrane filter. Environmental Science and Technology, 10, 274–277. [DOI] [PubMed] [Google Scholar]
- Spurny KR, Lodge JP, Frank ER, & Sheesley DC (1969). Aerosol filtration by means of nuclepore filters: Structural and filtration properties. Environmental Science and Technology, 3, 453–464. [Google Scholar]
- Stoeger T, Reinhard C, Takenaka S, Schroeppel A, Karg E Ritter B, et al. (2006). Instillation of six different ultrafine carbon particles indicates a surface area threshold dose for acute lung inflammation in mice. Environmental Health Perspectives, 114, 328–333. [DOI] [PMC free article] [PubMed] [Google Scholar]
- Twomey S (1962). Equations for the decay of diffusion of particles in an aerosol flowing through circular or rectangular channels. Bulletin of the Observatory of Puy de Dome, 10, 173–180. [Google Scholar]
- Yamamoto N, Fujii M, Kumagai K, & Yanagisawa Y (2004). Time course shift in particle penetration characteristics through capillary pore membrane filters. Journal of Aerosol Science, 35, 731–741. [Google Scholar]


