

Abstract
Meiotic recombination is initiated by the formation of DNA double‐strand breaks (DSBs), essential for fertility and genetic diversity. In the mouse, DSBs are formed by the catalytic TOPOVIL complex consisting of SPO11 and TOPOVIBL. To preserve genome integrity, the activity of the TOPOVIL complex is finely controlled by several meiotic factors including REC114, MEI4, and IHO1, but the underlying mechanism is poorly understood. Here, we report that mouse REC114 forms homodimers, that it associates with MEI4 as a 2:1 heterotrimer that further dimerizes, and that IHO1 forms coiled‐coil‐based tetramers. Using AlphaFold2 modeling combined with biochemical characterization, we uncovered the molecular details of these assemblies. Finally, we show that IHO1 directly interacts with the PH domain of REC114 by recognizing the same surface as TOPOVIBL and another meiotic factor ANKRD31. These results provide strong evidence for the existence of a ternary IHO1‐REC114‐MEI4 complex and suggest that REC114 could act as a potential regulatory platform mediating mutually exclusive interactions with several partners.
Keywords: DNA double‐strand breaks, meiosis, protein complexes, proteins structure, recombination
Subject Categories: DNA Replication, Recombination & Repair; Structural Biology
The PH domain of murine meiotic recombination protein REC114 mediates mutually exclusive interactions with IHO1, TOPOVIBL and ANKRD31.
Introduction
At the onset of prophase of the first meiotic division, a unique program of DNA double‐strand break (DSB) formation takes place (de Massy, 2013; Lam & Keeney, 2015). Ten to a hundred DSBs in each meiotic cell are formed at preferred DNA sites, named hotspots (Tock & Henderson, 2018). The DSBs are repaired by homologous recombination generating connections between paternal and maternal chromosomes that are essential for proper chromosome segregation at the first meiotic division (Baudat et al, 2013; Hunter, 2015). The meiotic DSB formation is evolutionary conserved and has to be carefully controlled to preserve the genome integrity.
The key player in the meiotic DSB formation is the catalytic complex TOPOVIL, in the mouse consisting of SPO11 and TOPOVIBL (Baudat et al, 2000; Romanienko & Camerini‐Otero, 2000; Robert et al, 2016) The TOPOVIL complex is overall related to the archaeal TopoVI type IIB topoisomerases (Brinkmeier et al, 2022), but the mouse TOPOVIBL subunit differs from TopoVIB; in particular, it lacks its ATP‐biding and dimerization sites (Nore et al, 2022). The activity of the catalytic complex is regulated by several meiotic factors. In the mouse, these include REC114, MEI4, IHO1, and MEI1 that are essential for DSB formation and localize as foci on chromosome axes at meiotic prophase onset (Reinholdt & Schimenti, 2005; Kumar et al, 2010, 2015, 2018; Stanzione et al, 2016; Acquaviva et al, 2020; Dereli et al, 2021).
REC114 consists of 259 amino acid residues. In its N terminus, it possesses a Pleckstrin homology (PH) domain whose crystal structure was determined (Kumar et al, 2018; Boekhout et al, 2019; Nore et al, 2022). The C‐terminal part of REC114 directly interacts with the N terminus of MEI4 (Kumar et al, 2018). REC114 also interacts in yeast two‐hybrid assay (Y2H) with IHO1 (Stanzione et al, 2016). These interactions may predict a tripartite REC114‐MEI4‐IHO1 complex but it has not been identified yet. Since IHO1 also binds the unsynapsed chromosomal axis protein HORMAD1 (Stanzione et al, 2016), it has been hypothesized that a putative REC114‐MEI4‐IHO1 complex called pre‐DSB recombinosome might assemble along the HORMAD1‐containing chromosomal axis and regulate the TOPOVIL complex activity (Stanzione et al, 2016). Along these lines, the PH domain of REC114 was recently shown to directly interact with the C‐terminal peptide of TOPOVIBL (Nore et al, 2022). Structure‐based mutations that disrupt this interaction strongly reduce the DSB activity genome‐wide in oocytes, while only in subtelomeric regions in spermatocytes (Nore et al, 2022). The PH domain of REC114 also interacts with a C‐terminal fragment of another meiotic factor ANKRD31 (Boekhout et al, 2019) which is involved in regulating DSB number and localization, and this interaction is mutually exclusive with that of TOPOVIBL (Papanikos et al, 2019; Nore et al, 2022). The exact role and the interplay of these factors in DSB formation still remain unclear.
In S. cerevisiae, the proteins and mechanism involved in DSB formation have been analyzed at the genetic and biochemical level (Yadav & Claeys Bouuaert, 2021). The TOPOVIBL subunit of the catalytic complex exists in yeast as Rec102/Rec104 dimer (Jiao et al, 2003; Arora et al, 2004; Claeys Bouuaert et al, 2021b). The S. cerevisiae core complex consists of Spo11, Rec102, Rec104, and an additional protein Ski8 (Claeys Bouuaert et al, 2021b). The accessory proteins Rec114–Mei4 and Mer2 (IHO1 ortholog) form two separate complexes in vitro with 2:1 and tetrameric stoichiometry, respectively (Rousova et al, 2021; Claeys Bouuaert et al, 2021a). The two complexes bind DNA with high cooperativity and assemble into condensates that might recruit the catalytic complex to DNA through an Y2H‐observed interaction of Rec114 with Rec102/Rec104 (Arora et al, 2004; Maleki et al, 2007; Claeys Bouuaert et al, 2021a). Since the PH domain surface interacting with TOPOVIBL in mouse is not conserved in yeast, the molecular details of this interaction might differ from the mouse REC114‐TOPOVIBL interaction (Nore et al, 2022). While counterparts of most mammalian meiotic factors exist in yeast, their sequence conservation is often very low, indicating possible differences in the molecular details underlying their activities.
Here, using biochemical and biophysical analyses combined with AlphaFold2 modeling, we uncovered molecular details of the interaction between mouse REC114 and MEI4, where two molecules of REC114 interact with their C termini with the N‐terminal helix of MEI4 forming 2:1 and 4:2 assemblies. We also show that an equivalent REC114 homodimeric complex is formed even in the absence of MEI4. In addition, we found that IHO1 forms coiled‐coil‐based tetramers and interacts specifically via its N terminus with the PH domain of REC114, in a way that is incompatible with REC114 binding to ANKRD31 and TOPOVIBL. Together, these results provide strong evidence for the existence of a complex between mouse IHO1 and REC114‐MEI4, with a possible stoichiometry of 4IHO1:4REC114:2MEI4.
Results
Characterization of the REC114‐MEI4 complex
REC114 interacts directly with MEI4 in pull‐down experiments, and residues 203–254 of REC114 and 1–127 of MEI4 are sufficient for the interaction (Kumar et al, 2018; Fig 1A). Using Strep‐tag pull‐down assays, with co‐expressed proteins, we could show that Strep‐REC114 further truncated to residues 226–254 can still bind MEI4 (Fig 1B, lane 2). Similarly, MEI4 encompassing only the N‐terminal 43 residues was sufficient for the interaction with co‐expressed His‐MBP‐REC114 in an MBP pull‐down assay (Fig 1C, lane 3).
Figure 1. REC114‐MEI4 complex stoichiometry characterization.
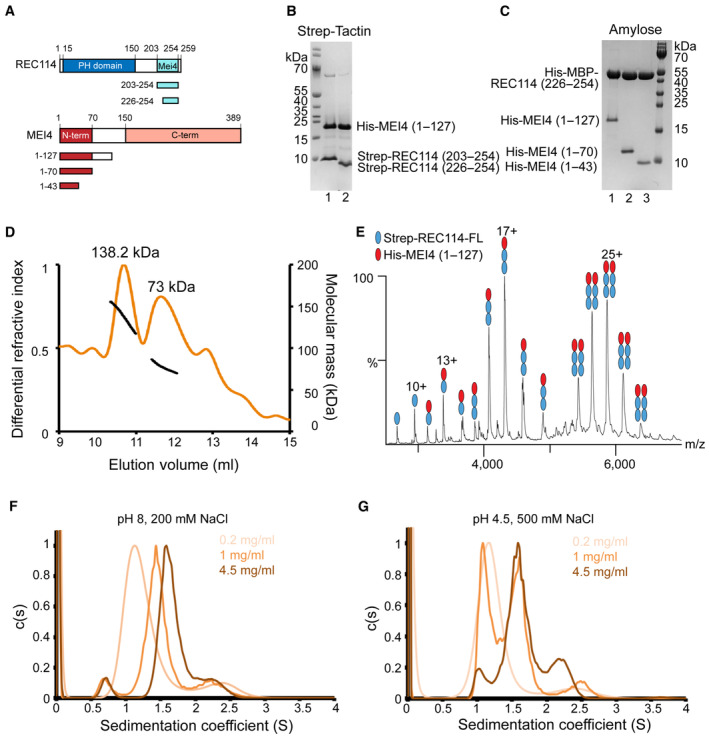
- Schematic representation of the domain structure of mouse REC114 (in blue) and MEI4 (in red ) and the constructs used in this study. PH, Pleckstrin homology domain; MEI4, MEI4 binding region.
- SDS–PAGE analysis of the binding of Strep‐tagged REC114 variants (using a single Strep‐tag [WSHPQFEK]) to co‐expressed His‐MEI41–127 after purification on Strep‐Tactin resin.
- SDS–PAGE analysis of the binding of His‐MBP‐REC114226–254 to co‐expressed His‐MEI4 variants after purification on Amylose resin.
- Molecular mass determination of the complex between the full‐length Strep‐REC114 and MEI41–127 by MALLS using Superdex 200 column. The calculated molecular weight of Strep‐REC114 is 29.5 kDa and of MEI4 is 14.5 kDa. The measured molecular mass of the two main peaks is 138.2 and 73 kDa corresponding to a REC114:MEI4 ratios 2:1 (73.4 kDa) and 4:2 (146.8 kDa), respectively. The injected sample was at 5 mg/ml.
- Native MS spectrum of co‐purified Strep‐REC114 and MEI41–127. The main complexes are Strep‐REC114:MEI41–127 in ratios 2:1 and 4:2. There are also free Strep‐REC114 and 1:1 Strep‐REC114‐MEI4 complex.
- Sedimentation velocity profiles of the REC114226–254‐MEI41–43 complex obtained at 280 nm at three concentrations (0.2, 1, and 4.5 mg/ml) in a solution containing 20 mM Tris pH 8.0 and 200 mM NaCl. Expected sedimentation coefficient for the 2:1 complex is 1.13S and for 4:2 is 1.58S. The sedimentation coefficient of the main peak increases with increasing protein concentration: s = 1.2S at 0.2 mg/ml, s = 1.44S at 1 mg/ml, and s = 1.64S at 4 mg/ml. These results suggest a fast exchange between the two forms.
- Sedimentation velocity profiles of the REC114226–254‐MEI41–43 complex obtained at 280 nm at three concentrations (0.2, 1, and 4.5 mg/ml) in a solution containing Sodium Acetate pH 4.5 and 500 mM NaCl. Expected sedimentation coefficient for the 2:1 complex is 1.13S and for the 4:2 complex is 1.58S. The sedimentation coefficient of the main peak is s = 1.13S at 0.2 mg/ml and s = 1.58S at 4 mg/ml. At 1 mg/ml, both forms of REC114226–254‐MEI41–43 are present. At pH 4.5, a slow exchange between the two forms is observed.
Source data are available online for this figure.
To assess the stoichiometry of the complex between full‐length Strep‐REC114 and MEI41–127 we first used multiangle laser light scattering (MALLS). The complex elutes in two major peaks (surrounded by wide peak shoulders), with measured molecular weight of 73 and 138.2 kDa, respectively (Fig 1D). The measured value of the second peak corresponds to the theoretical molecular mass of 2:1 (73.4 kDa) stoichiometry of the REC114‐MEI4 complex. The first peak might represent 4:2 stoichiometry (146.8 kDa), but the observed molecular weight of this peak is decreasing as it might be a mixture of different oligomeric states. To obtain additional insight into the REC114‐MEI4 complex architecture, we performed native mass spectrometry (MS). The analyzed sample was a pool of the fractions of both main peaks from the gel filtration. In agreement with the MALLS results, we could detect complexes containing Strep‐REC114 and MEI41–127 in ratios 2:1 and 4:2. In addition, the MS data indicate the presence of free Strep‐REC114 and 1:1 Strep‐REC114‐MEI41–127 complex (Fig 1E). Finally, we analyzed the minimal REC114226–254‐MEI41–43 complex by analytical ultracentrifugation (AUC). The analysis confirmed the existence of predominant 2REC114‐1MEI4 and 4REC114‐2MEI4 complexes (Fig 1F; Appendix Fig S1A). Measurements at different protein concentrations are consistent with a concentration‐dependent dimerization of the 2REC114‐1MEI4 heterotrimers, with fast exchange between the two states (Fig 1F). We also noticed that the exchange between the two states was slower at low pH and high salt concentrating. In this condition, the two oligomeric states (2:1 and 4:2) could be detected with higher precision, as the exchange rate between them was slower (Fig 1G). Together, these results show that REC114 and MEI4 form predominantly a complex with a 2:1 stoichiometry that can further dimerize to 4:2 in response to increasing protein concentration.
REC114 forms homodimers via its C terminus
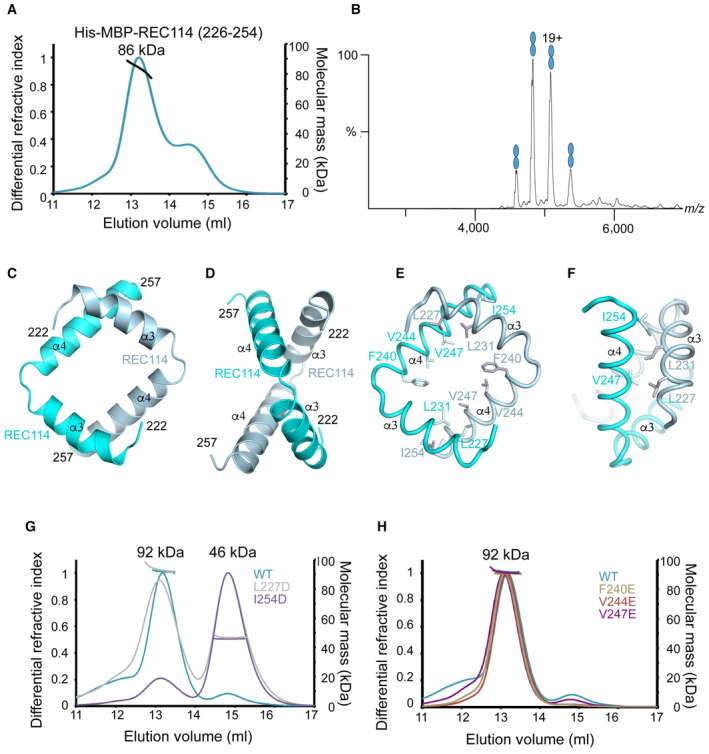
Since MEI41–43 interacts with two REC114226–254 molecules, we wanted to test whether the C terminus of REC114 can dimerize also in the absence of MEI4. MALLS analysis revealed that indeed His‐MBP‐REC114226–254 with theoretical molecular mass of 48 kDa forms probable dimers (measured molecular weight of 86 kDa) in solution (Fig 2A). This was confirmed by native MS. We analyzed the sample from the main gel filtration peak. MS data showed a clear dimer of His‐MBP‐REC114226–254 (Fig 2B).
Figure 2. Characterization of the REC114 dimerization domain.
-
AMolecular mass determination of His‐MBP‐REC114226–254 by MALLS using Superdex 200 column. The calculated molecular weight of His‐MBP‐REC114226–254 is 48 kDa. The measured molecular mass of the main peak is 86 kDa, which corresponds to dimeric His‐MBP‐REC114226–254 of 96 kDa. The injected sample was at 3 mg/ml.
-
BNative MS spectrum of His‐MBP‐REC114226–254. This protein is a dimer.
-
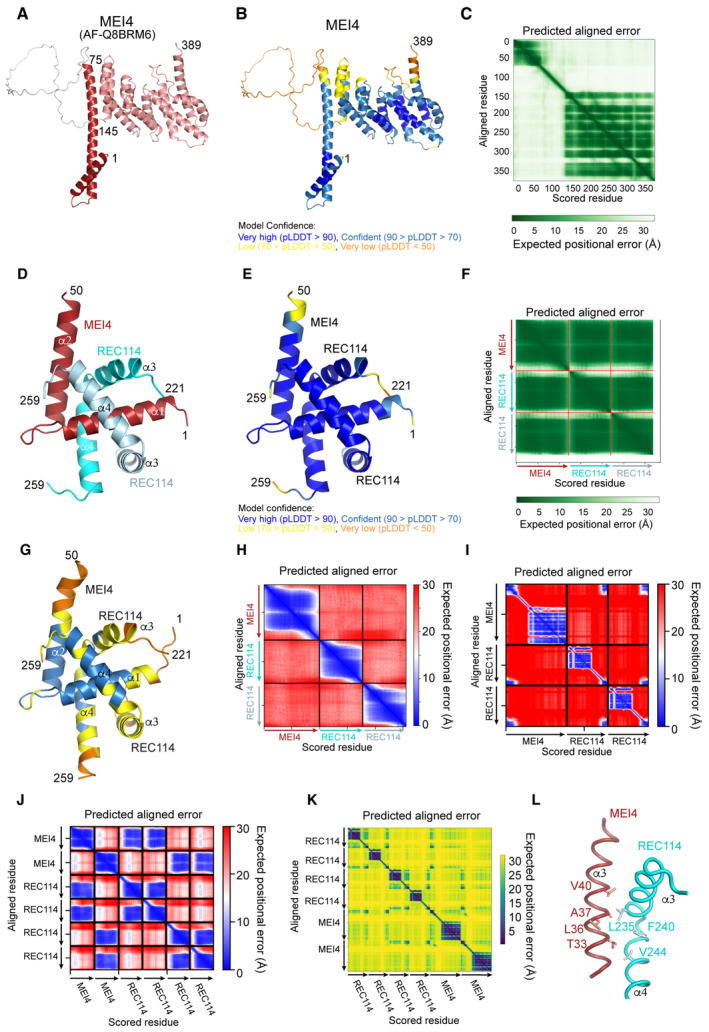
C, DAlphaFold2 model of the REC114 dimer including its C terminus (residues 222–257). The secondary structures are labeled. The modeled complex structure colored according to the AlphaFold2 per‐residue estimate of confidence (pLDDT), and predicted aligned error plots are shown in Fig EV1D–F.
-
E, FDetails of the predicted interactions between the two REC114 molecules formed by the extremities of the two helices.
-
GComparison of molecular mass between WT and mutated versions of His‐MBP‐REC114222–256 by MALLS. L227D elutes partially as a monomer and I254D elutes mostly as a monomer. The injected samples were at 3 mg/ml.
-
HComparison of molecular mass between WT and mutated versions of His‐MBP‐REC114222–256 by MALLS. All three tested REC114 mutants remain dimeric. The injected samples were at 3 mg/ml.
Source data are available online for this figure.
A high accuracy predicted AlphaFold2 model of REC114 is available in the EBI AlphaFold2 database (https://alphafold.ebi.ac.uk/) under the AF‐Q9CWH4 accession number. Consistent with previous experimental structures, REC114 is predicted to contain the PH domain in its N terminus connected by a flexible linker to a short helical segment in its C terminus that interacts with MEI4 (Fig EV1A–C; Kumar et al, 2018). AlphaFold2 (Jumper et al, 2021) predicts a dimer of the REC114 C terminus with high confidence (Figs 2C–F and EV1D–F). The predicted dimerization region corresponds to residues 224–255. The two C‐terminal helices α3 and α4 of REC114 molecules form an antiparallel square‐like structure. The contacts between the two REC114 protomers are located at the ends of both helices. In particular, the conserved L227 and L231 of α3 of one protomer are predicted to interact with area around I254 on α4 of the other protomer (Fig 2E and F). A language model‐based ESMfold (Lin et al, 2023), which does not rely on multiple‐sequence alignments, predicts an essentially identical model (Fig EV1G and H).
Figure EV1. Structure prediction of the REC114 dimer.
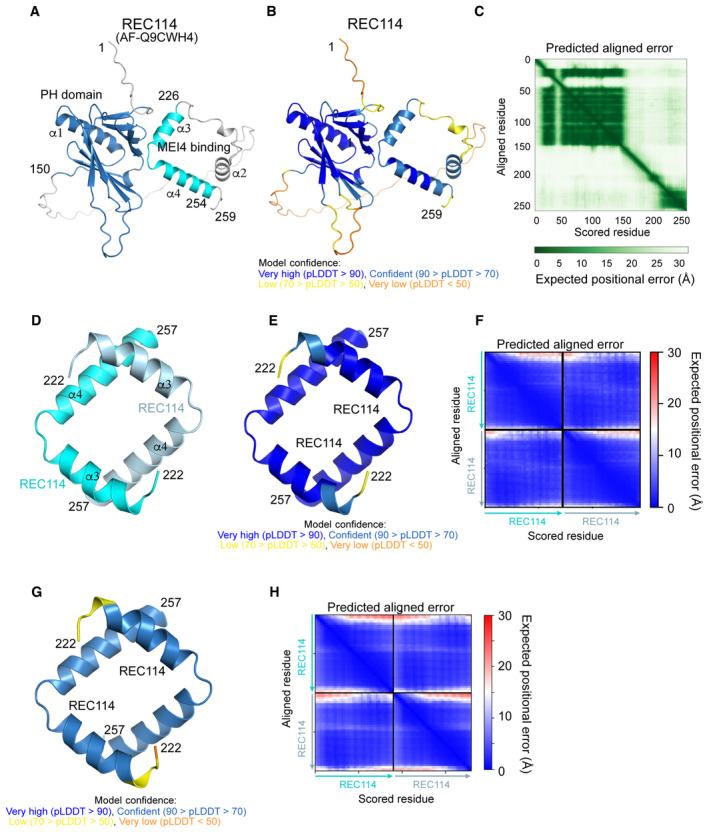
- AlphaFold2 model of REC114 (AF‐Q9CWH4) colored by domain.
- AlphaFold2 model of REC114 (AF‐Q9CWH4) colored according to the AlphaFold2 per‐residue estimate of confidence (pLDDT).
- Predicted aligned error plot for the model shown in (A).
- AlphaFold2 model of the homodimeric complex of REC114222–527 colored by protein chain.
- AlphaFold2 model of the homodimeric complex of REC114222–257 colored according to pLDDT.
- Predicted aligned error plot for the model shown in (D).
- ESMfold model of the homodimeric complex of REC114222–257 colored according to pLDDT.
- Predicted aligned error plot for the ESMfold model shown in (G).
In order to validate this model, we mutated residues I254 and L227, respectively, to aspartates and analyzed their oligomeric state by MALLS. To accommodate potential extra contacts between the protomers predicted with low confidence, the construct was slightly extended to residues 222–256. Since His‐tags can sometimes mediate formation of oligomers through coordination of metal ions (Ayoub et al, 2023), we showed by MALLS that the sample treated with 5 mM EDTA has an essentially identical MALLS profile (Appendix Fig S1B). While the L227D eluted as a mixture of monomers and dimers, the I254D mutant was mostly monomeric (Fig 2G). Mutations F240E, V244E, and V247E did not have any impact on the dimerization of His‐MBP‐REC114222–256 (Fig 2H) being consistent with the AlphaFold2 model, according to which these residues do not play an important role in REC114 dimerization. In summary, these results show that the REC114 C terminus is able to mediate REC114 homodimerization in the absence of MEI4. But given the rather modest dimeric interface (Fig 2C–F), it is likely that MEI4 binding stabilizes this complex.
REC114‐MEI4 complex structure prediction
We then attempted to determine the structure of the REC114‐MEI4 minimal complex, but crystallization, NMR, and SAXS analysis failed, likely due to the fast exchange between the different oligomeric states of the complex (Appendix Fig S2A–C). A high‐confidence AlphaFold2 model of MEI4 is available in EBI AlphaFold2 database (AF‐Q8BRM6) that predicts MEI4 to contain a helical N‐terminal segment (binding to REC114) connected flexibly to a larger helical domain (Fig EV2A–C). It should be noted that in our hands, MEI4 constructs covering this helical domain could not be produced soluble in bacteria nor insect cells. AlphaFold2 predicts a very convincing model of the REC114‐MEI4 2:1 heterotrimer (Figs 3A–C and EV2D–F) that includes contacts between the segments that we biochemically defined as minimal interacting regions (Fig 1B and C). In addition, a very similar model, albeit with low confidence, was also predicted by ESMfold (Fig EV2G and H). The structure prediction of the complex of full‐length proteins did not show other contacts between the proteins (Fig EV2I). Finally, predictions of the 4:2 REC114‐MEI4 complex by AlphaFold2 did not reveal other convincing interactions (Fig EV2J and K).
Figure EV2. REC114‐MEI4 complex structure prediction.
- AlphaFold2 model of MEI4 (AF‐Q8BRM6) colored by domain.
- AlphaFold2 model of REC114 (AF‐Q8BRM6) colored according to the AlphaFold2 per‐residue estimate of confidence (pLDDT).
- Predicted aligned error plot for the model shown in (A).
- AlphaFold2 model of the heterotrimeric complex between REC114221–259 and MEI41–50 colored by protein chain.
- AlphaFold2 model of the heterotrimeric complex between REC114221–259 and MEI41–50 colored according to pLDDT.
- Predicted aligned error plot for the model shown in (D).
- ESMfold model of the heterotrimeric complex between REC114221–259 and MEI41–50 colored according to pLDDT.
- Predicted aligned error plot for the model shown in (G).
- Predicted aligned error plot for AlphaFold2 modeling the 2:1 complex of full‐length REC114‐MEI4. Only contacts between N‐term. of MEI4 and C‐term. of REC114 are predicted as reliable.
- Predicted aligned error plot for AlphaFold2 modeling the 4:2 complex of REC114211–259‐MEI41–50. Only 2:1 REC114‐MEI4 reliable contacts are predicted.
- Predicted aligned error plot for AlphaFold2 modeling the 4:2 complex of FL REC114 and MEI4. The little dark blue squares indicate interactions of the short regions of REC114 and MEI4.
- Details of the predicted interaction between one of the REC114 molecules with the helix α2 of MEI4.
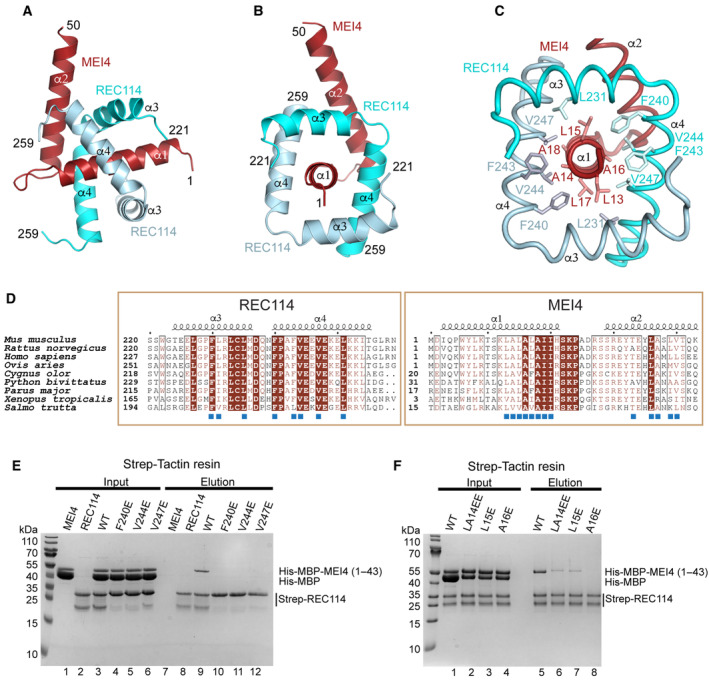
Figure 3. REC114‐MEI4 complex structure prediction.
-
A, BAlphaFold2 model of the REC114‐MEI4 complex structure in 2:1 stoichiometry, including the REC114 C terminus (residues 221–259) and the MEI4 N terminus (residues 1–50). The secondary structures are labeled. The modeled complex structure colored according to the AlphaFold2 per‐residue estimate of confidence (pLDDT), and the predicted aligned error plots are shown in Fig EV2D–F.
-
CDetails of the predicted interactions between REC114 and MEI4. A sequence of hydrophobic residues of the MEI4 helix α1 is interacting with hydrophobic surfaces of the two molecules of REC114 wrapping around it.
-
DSequence alignments of the interacting regions of REC114 and MEI4. Identical residues are in brown boxes. The residues involved in the interaction are shown as blue squares.
-
EPull‐down experiments of full‐length Strep‐tagged REC114 mutants indicated above the lanes with His‐MBP‐MEI41–43. All proteins were first purified by affinity chromatography and gel filtration. A total of 0.9% of the input (lanes 1–6) and 1% of the eluates (lanes 7–12) were analyzed on 15% SDS–PAGE gels stained with Coomassie brilliant blue. Control lanes 1–2 and 7–8 show inputs and elutions of REC114 and MEI4 alone, respectively. The MEI4 sample contains also free MBP tag. The REC114 sample also contains a degradation product, likely corresponding to its PH domain.
-
FPull‐down experiments of Strep‐tagged REC114 with His‐MBP‐MEI41–43 mutants indicated above the lanes. All proteins were first purified by affinity chromatography and gel filtration. A total of 0.9% of the input (lanes 1–4) and 1% of the eluates (lanes 5–8) were analyzed on 15% SDS–PAGE gels stained with Coomassie brilliant blue. The MEI4 sample contains also free MBP tag. The REC114 sample also contains a degradation product, likely corresponding to its PH domain.
Source data are available online for this figure.
In the AlphaFold2 predicted 2:1 model, the C‐terminal helices α3 and α4 of two REC114 molecules wrap around the helix α1 of MEI4 (Fig 3A–C). One of the REC114 protomers makes additional contact also with the MEI4 helix α2 (Figs 3A–C and EV2L). Most of the predicted contacts are mediated by hydrophobic residues. On MEI4 α1, the interacting residues include a repetitive sequence 13‐LALALAII‐20 that form multiple contacts with REC114 F230, L231, F240, F243, V244, and V247 (Fig 3C). While L13, A14, L17, and A18 interact with one REC114 protomer, L15, A16, I19, and I20 bind the other one (Fig 3C). Within MEI4 helix α2, T33, L36, A37, and V40 pack against hydrophobic residues of one of the REC114 protomers, including L235, F240, and V244 (Fig EV2L). Most residues predicted to interact are highly conserved in both proteins across vertebrates (Fig 3D). Despite sequence divergence, equivalent models can also be predicted for other species, such as A. thaliana, S. cerevisiae, and S. pombe (Appendix Fig S3). To confirm that the residues predicted to mediate the interaction between REC114 and MEI4 are correct, we mutated REC114 residues F240, V244, and V247, respectively, to glutamates. In pull‐down assays with the Strep‐tagged full‐length REC114, all three mutations F240E, V244E, and V247E led to undetectable interaction with His‐MBP‐MEI41–43 (Fig 3E, lanes 10–12). When MEI4 α1 residues predicted as key for binding of REC114 were mutated and tested in pull‐down assays with the Strep‐tagged full‐length REC114, the A16E mutation completely abolished the binding (Fig 3F, lane 8). A significantly reduced binding was observed for L15E and a double mutant L13E, A14E (Fig 3F, lanes 6–7). The mutations introduced into REC114 did not significantly alter the structure of these proteins as judged by gel filtration analysis (Appendix Fig S4A and B). His‐MBP‐MEI41–43 tends to aggregate in the absence of REC114, but only monomeric fractions of the WT and mutant versions were used for the pull‐down experiment (Appendix Fig S4C–G). These mutagenesis results are in agreement with the AlphaFold2 prediction of the REC114‐MEI4 complex structure.
IHO1 tetramerizes via a parallel four‐stranded coiled‐coil
Mouse IHO1 is predicted to be largely disordered, except for its central region (110–240) predicted to be helical and possess a coiled‐coil domain (Fig 4A). We were not able to efficiently overexpress the full‐length IHO1, but could express it in two fragments as His‐MBP fusions: IHO11–281 and IHO1281–574 (Fig 4A). When IHO11–281 was analyzed by MALLS, a likely tetrameric stoichiometry was observed (measured 120 kDa, calculated 126 kDa for a tetramer; Fig 4B). While the central region of IHO1 spanning residues 125–281 retained its tetrameric form (measured 67 kDa, calculated 71 kDa for a tetramer), His‐MBP‐IHO11–113 was monomeric (Fig 4B; Appendix Fig S5A). Finally, even the short fragment covering the C‐terminal part of the IHO1 helical domain (residues 196–245) still forms a stable tetramer (measured 24 kDa, calculated 23 kDa for a tetramer; Fig 4B). The IHO1 AlphaFold2 model is available in the EBI AlphaFold2 database (https://alphafold.ebi.ac.uk/) under the AF‐Q6PDM4 accession number and confirms the presence of the long helix between residues 114 and 245 within otherwise disordered protein (Fig EV3A and B). When a tetrameric stoichiometry is modeled, AlphaFold2 predicts with high confidence an IHO1 tetramer, based on a parallel four‐stranded coiled‐coil between residues 130 and 245 (Figs 4C and EV3C). After residue 245, the prediction is less convincing. The language model‐based ESMfold also predicts an equivalent IHO1 homotetramer, albeit with lower confidence (Fig EV3D and E). The sequence corresponding to the coiled‐coil region is better conserved than the surrounding parts of IHO1 (Fig 4D). Similar tetrameric models can also be modeled for IHO1 orthologs in other species, such as A. thaliana, S. pombe, and Sordaria macrospora (Appendix Fig S5B–D). The model of S. cerevisiae Mer2 is predicted with lower confidence (Appendix Fig S5E). While the N‐terminal section of the coiled‐coil contains a few irregularities in the heptad repeats, the a and d positions (the 1st and 4th positions in heptad repeats) are regularly spaced in the C‐terminal part (residues 180–245; Fig 4D) being consistent with our MALLS results (Fig 4B).
Figure 4. IHO1 forms tetramers.
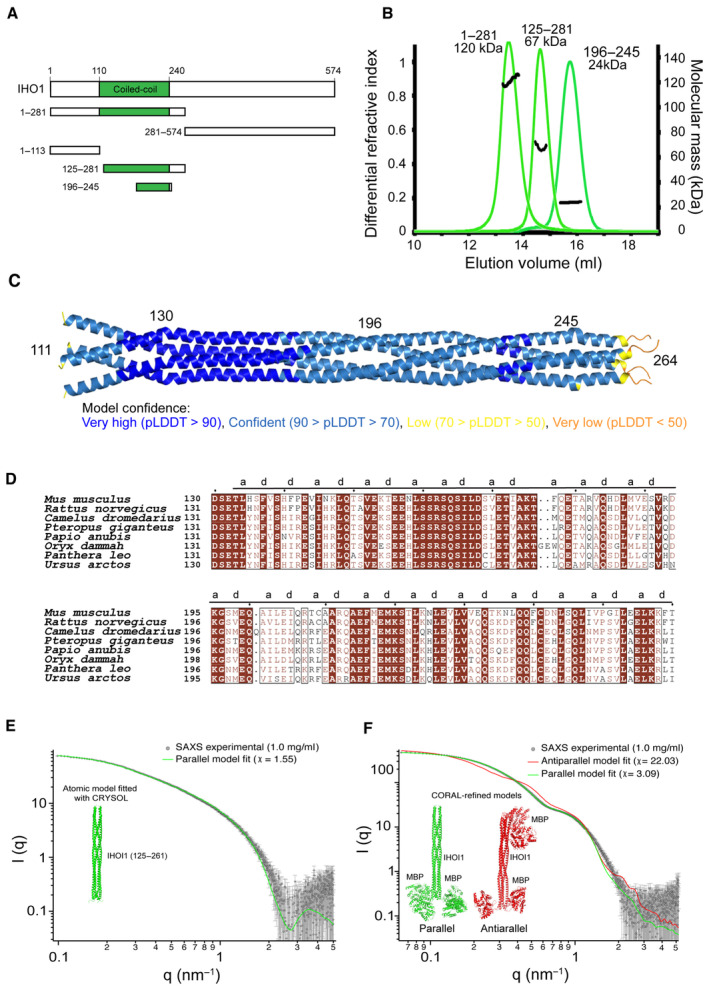
- Schematic representation of the domain structure of mouse IHO1 and its constructs used in this study.
- Molecular mass determination of IHO11–281, IHO1125–281, and IHO1196–245 by MALLS using Superose 6 column. The measured molecular mass of the main peak of each construct is 120, 67, and 24 kDa, respectively. These values correspond to calculated molecular weights of IHO1 tetramers (125, 72, and 24 kDa, respectively). The samples were injected at 5–10 mg/ml.
- AlphaFold2 model of tetrameric IHO1111–280 colored according to the AlphaFold2 per‐residue estimate of confidence (pLDDT). Only residues 111–264 are shown. The predicted aligned error plot for this model is shown in Fig EV3C.
- Sequence alignments of the helical region of IHO1 (residues 130–260). Identical residues are in brown boxes. (A) and (D) positions of the heptad repeats are shown.
- Comparison of experimental SAXS curve of IHO1125–261 construct at 1.0 mg/ml and the CRYSOL fit of the parallel atomic model (green line).
- Comparison of CORAL fits of a parallel (green line) and antiparallel (red line) MBP‐IHO1 models against experimental SAXS data (1 mg/ml). The comparison and χ‐values show that the parallel model is in very good agreement with the data, while the antiparallel model cannot fit them within the conformational space allowed by the linkers. A slight mismatch of the predicted curve of the parallel model with the experimental data in the q‐range between 1 and 2 nm−1 can most likely be attributed to the fact that a single model was fitted, while the flexible linker allows for multiple conformations.
Source data are available online for this figure.
Figure EV3. Structure prediction of the IHO1 coiled‐coil.
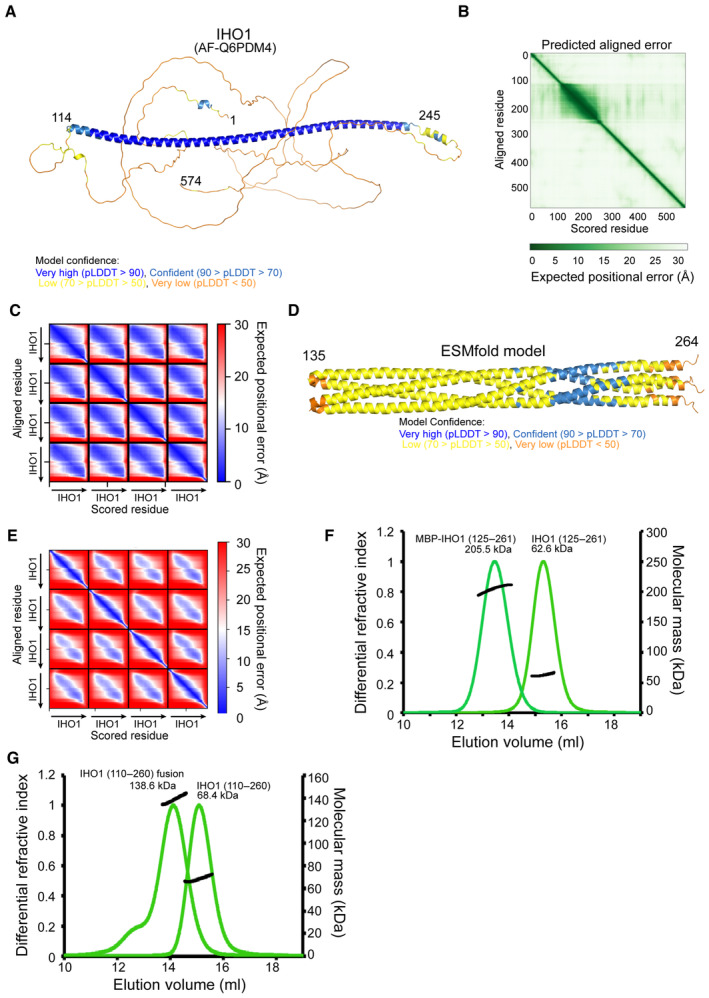
- AlphaFold2 model of IHO1 (AF‐Q6PDM4) colored according to the AlphaFold2 per‐residue estimate of confidence (pLDDT).
- Predicted aligned error plot for the model shown in (A).
- Predicted aligned error plot for the AlphaFold2 model shown in Fig 4C.
- ESMfold model of the tetrameric IHO1110–281 colored according to pLDDT. Only residues 135–264 are shown.
- The predicted aligned error plot for the ESMfold model is shown in (D).
- Molecular mass determination of IHO1125–261 and MBP‐IHO1125–261 by MALLS using Superose 6 column. The measured molecular mass of the main peak of the two constructs is 62.6 Da and 205.5 kDa, respectively. These values correspond to calculated molecular weights of IHO1 tetramers (63.2 and 224.4 kDa, respectively). The samples were injected at 4 mg/ml.
- Molecular mass determination of IHO1110–260 and the fusion construct containing two copies of IHO1110–260 separated by a 16 residues linker by MALLS using Superose 6 column. The measured molecular mass of the main peak of the two constructs is 68.4 Da and 138.6 kDa, respectively. These values correspond to calculated molecular weights of IHO1 tetramers (69.6 and 143.2 kDa, respectively). The samples were injected at 4 mg/ml.
Yeast Mer2 has already been reported to form homotetramers (Rousova et al, 2021; Claeys Bouuaert et al, 2021a). However, the tetrameric coiled‐coil was proposed to have an antiparallel topology (Claeys Bouuaert et al, 2021a). To clarify this contradiction with the parallel topology predicted by AlphaFold2 and ESMfold, we used two following experiments. First, we used small‐angle X‐ray scattering (SAXS) to verify the overall correctness of the predicted model. We prepared a new IHO1 construct covering the best‐predicted coiled‐coil region (residues 125–261). MALLS analysis confirmed that it formed tetramers (Fig EV3F). The predicted X‐ray scattering curve of the AlphaFold2 model fits well the experimental SAXS curve obtained for this construct, indicating that the model is overall correct (Fig 4E). To obtain insight into the coiled‐coil topology, which cannot be deduced from this SAXS experiment, we prepared IHO1125–261 fused by a short linker containing only five residues to MBP and analyzed this construct by SAXS. This contruct remains tetrameric as judged by MALLS (Fig EV3F). We used the CORAL software to model positions of the MBP domains flexibly linked to the IHO1125–261 tetramer to best match the measured SAXS curve of the complex. While the parallel topology IHO1125–261 with four MBP domains on the same side of the coiled‐coil could be modeled to fit well the experimental curve, a good fit cannot be achieved for the antiparallel IHO1125–261 topology where each side of the coiled‐coil is linked to two MBP domains (Fig 4F). This result thus supports the parallel topology of the IHO1 coiled‐coil. In addition, we performed the experiment that previously indicated the antiparallel topology of yeast Mer2 (Claeys Bouuaert et al, 2021a). We used a fusion of two copies of IHOI110–260 separated by a 16 amino acid linker. If IHO1 formed antiparallel coiled‐coils, this fusion construct should form dimers with size similar to the IHOI110–260 tetramer. In the case of parallel arrangement, since the linker is too short for intramolecular parallel coiled‐coil formation, the fusion construct should form tetramers of twice higher molecular weight. MALLS analysis indeed showed that while single IHOI110–260 forms tetramers of 68.4 kDa (calculated Mw—69.6 kDa), the fusion construct formed tetramers of 138.6 kDa, again consistent with parallel coiled‐coil arrangement (calculated Mw for tetramer—143.2 kDa; Fig EV3G). In summary, these results support the predicted structure model, confirming that mouse IHO1 forms homotetramers based on a parallel four‐stranded coiled‐coil.
IHO1 binds to the REC114 PH domain with its conserved N terminus
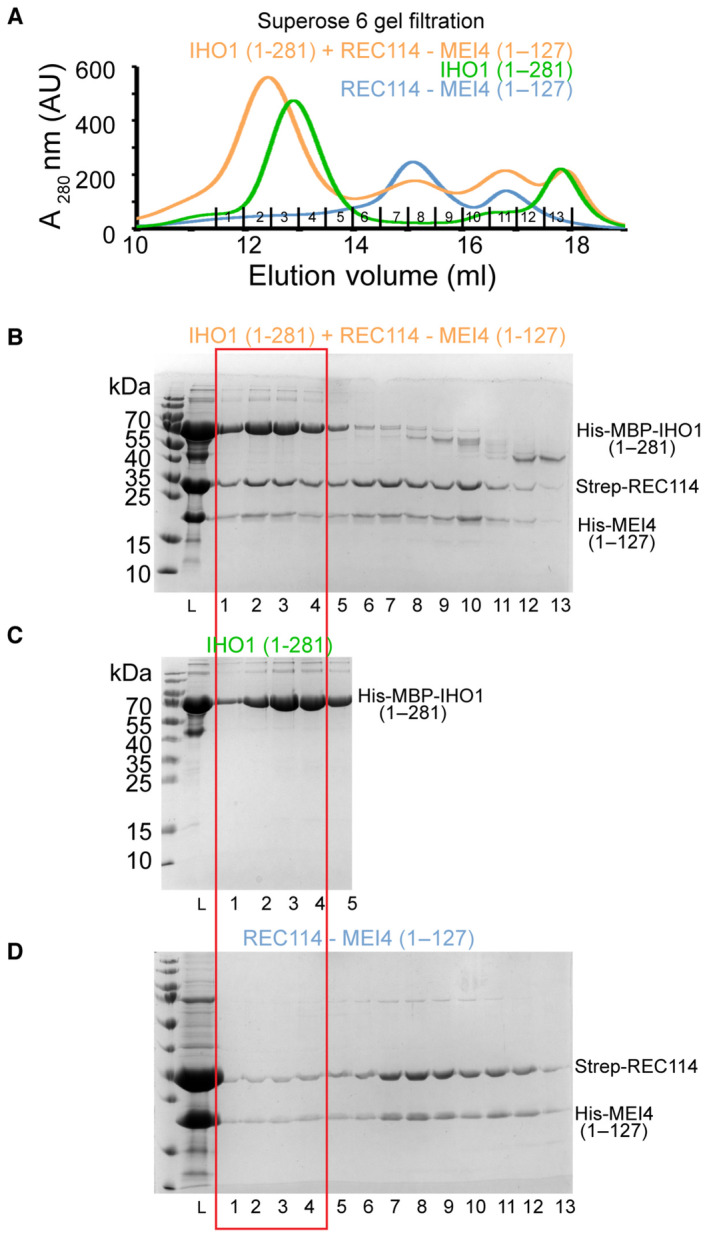
IHO1 was previously shown to interact with REC114 in Y2H (Stanzione et al, 2016). We were thus interested in testing whether IHO1 can directly bind the REC114‐MEI41–127 in vitro. Interestingly, when the purified REC114‐MEI41–127 complex and His‐MBP‐IHO11–281 were mixed and injected onto a Superose 6 gel filtration column, the three proteins co‐eluted in separate peak, compared with His‐MBP‐IHO11–281 and REC114‐MEI41–127 alone (Figs 5A and B, and EV4A–D). Similarly, the three proteins co‐elute together, when IHO11–281 was fused to a His‐Sumo tag (Appendix Fig S6). No complex formation was observed using IHO1281–574. Using Y2H, it has been shown that the N‐terminal region of the Sordaria macrospora IHO1 ortholog Asy2 (residues 1–156) is sufficient for REC114 binding (Tessé et al, 2017). Since this region bears a short motif with a distant similarity to the extreme N terminus of mouse IHO1, we were interested in testing whether this motif is required for the interaction with REC114 in the mouse. Indeed, when the first conserved 23 residues were deleted from IHO11–281, it could no longer interact with the REC114‐MEI41–127 complex (Fig 5C and D; Appendix Fig S7). In agreement with these results, using isothermal titration calorimetry (ITC), we show that His‐MBP‐IHO11–281 interacts with the REC114‐MEI41–127 complex with a dissociation constant (K d) of 26.9 μM (Fig 5E), while no binding is observed for His‐MBP‐IHO124–281 lacking the first 23 amino acids (Fig 5F). In addition, we could show that the first 23 residues are sufficient for the interaction, as His‐MBP‐IHO11–23 interacts with the REC114‐MEI41–127 complex with K d of 31.9 μM, being equivalent to the one of His‐MBP‐IHO11–281 (Fig 5G). Finally, ITC measurements revealed that neither the REC114 C terminus nor MEI41–127 is required for the complex formation, since the REC114 PH domain (residues 1–159) binds His‐MBP‐IHO11–23 with K d of 30.4 μM (Fig 6A). These results provide evidence that IHO1 and REC114‐MEI4 form a ternary complex, that mouse REC114 and IHO1 directly interact in vitro, and that the REC114 PH domain and the first 23 residues of IHO1 are the required regions for this interaction (Fig 6B).
Figure 5. IHO1 forms a complex with REC114‐MEI4.
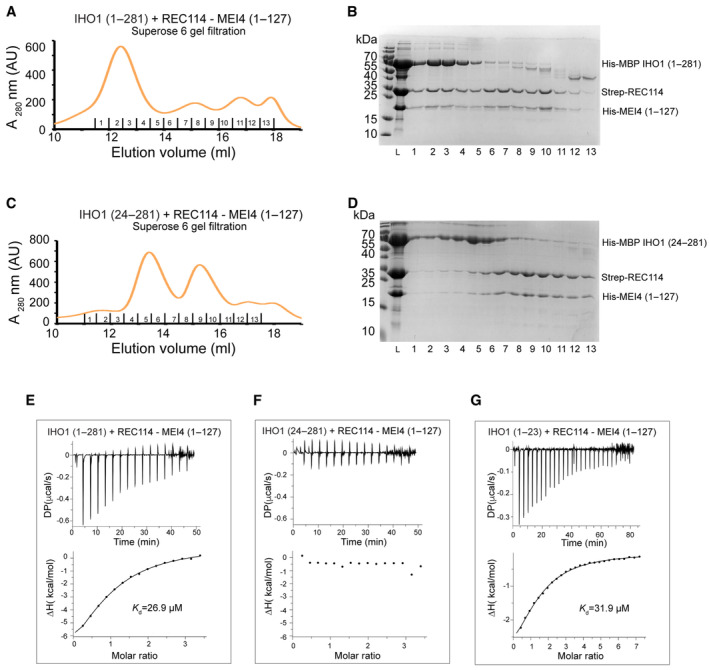
- Superose 6 gel filtration elution profile of His‐MBP‐IHO11–281 mixed with Strep‐REC114‐His‐MEI41–127. Overlay with individual elution profiles of His‐MBP‐IHO11–281 and the Strep‐REC114‐His‐MEI41–127 complex and the corresponding SDS–PAGE analysis of the elution fractions are shown in Fig EV4.
- SDS–PAGE analysis of fraction 1–13 of the Superose 6 gel filtration elution profile shown in (A). L indicates input sample loaded onto the column.
- Superose 6 gel filtration elution profile of His‐MBP‐IHO124–281 mixed with Strep‐REC114‐His‐MEI41–127, showing a lack of binding. Overlay with individual elution profiles of His‐MBP‐IHO124–281 and the Strep‐REC114‐His‐MEI41–127 complex and the corresponding SDS–PAGE analysis of the elution fractions are shown in Appendix Fig S7.
- SDS–PAGE analysis of fraction 1–13 of the Superose 6 gel filtration elution profile shown in (C). L indicates input sample loaded onto the column.
- ITC measurement of the interaction affinity between His‐MBP‐IHO11–281 and Strep‐REC114‐His‐MEI41–127.
- ITC measurement of the interaction affinity between His‐MBP‐IHO124–281 and Strep‐REC114‐His‐MEI41–127
- ITC measurement of the interaction affinity between His‐MBP‐IHO11–23 and Strep‐REC114‐His‐MEI41–127.
Source data are available online for this figure.
Figure EV4. IHO1‐REC114‐MEI4 complex formation.
-
AOverlay of Superose 6 gel filtration elution profiles of His‐MBP‐IHO11–281, the Strep‐REC114‐His‐MEI41–127 complex and their mixture.
-
B–DSDS–PAGE analysis of fraction 1–13 of the Superose 6 gel filtration elution profile shown in (A). Only fractions 1–5 are shown for the His‐MBP‐IHO11–281 profile. L indicates input sample loaded onto the column. The gel shown in (B) is the same as in Fig 5B.
Figure 6. IHO1 interacts with the PH domain of REC114.
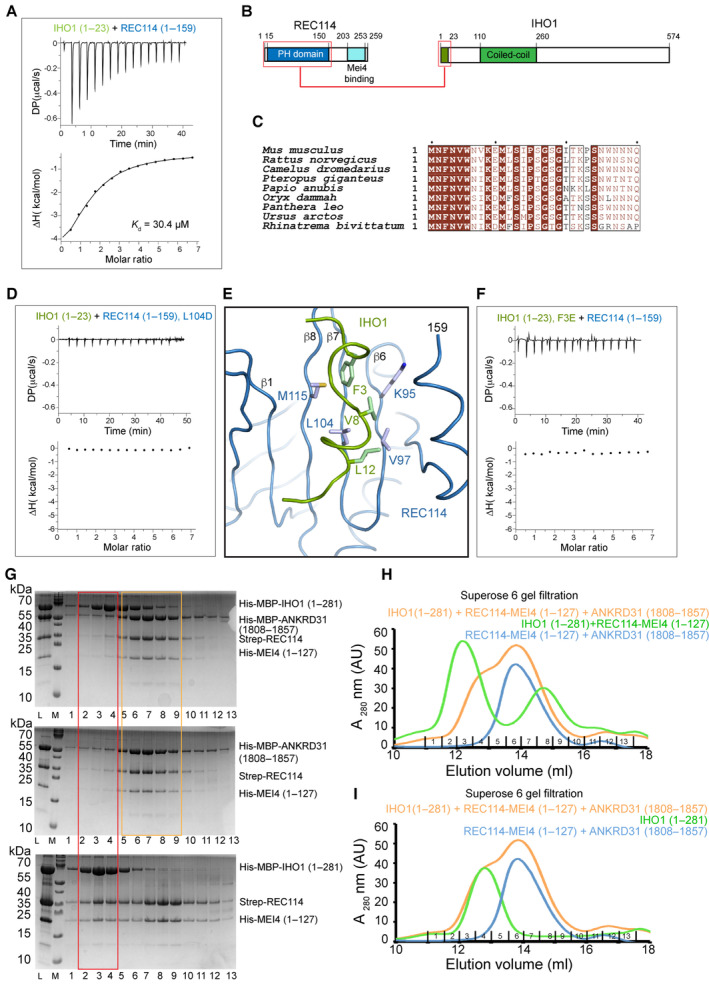
- ITC measurement of the interaction affinity between His‐MBP‐IHO11–23 and Strep‐REC1141–159 (PH domain).
- Schematic representation of the interacting regions of REC114 and IHO1 highlighted with red boxes.
- Sequence alignments of the N‐terminal sequence of IHO1. Identical residues are in brown boxes. Only first 30 residues are shown.
- ITC measurement of the interaction affinity between His‐MBP‐IHO11–23 and the L104D mutant of Strep‐REC1141–159.
- AlphaFold2 model of the complex between the REC114 PH domain (blue) and the N‐terminal peptide of IHO1 (residues 1–15, green). Hydrophobic IHO1 residues are predicted to interact with the REC114 β‐sheet formed of strands β1 and β6–β8. The secondary structures are labeled. The modeled complex structure colored according to the AlphaFold2 per‐residue estimate of confidence (pLDDT), and predicted aligned error plot is shown in Fig EV5A and B.
- ITC measurement of the interaction affinity between the F3E mutant of His‐MBP‐IHO11–23 and Strep‐REC1141–159.
- SDS–PAGE analysis of fractions 1–13 of Superose 6 gel filtration elution profiles of His‐MBP‐IHO11–281 mixed with His‐MBP‐ANKRD311808–1857, Strep‐REC114, and His‐MEI41–127 (upper panel); mixture of His‐MBP‐ANKRD311808–1857 with Strep‐REC114‐His‐MEI41–127 (middle panel) and His‐MBP‐IHO11–281 mixed with Strep‐REC114 and His‐MEI41–127 (lower panel). L indicates input sample loaded onto the column. The red frame highlights the complex of IHO1 bound to REC114 and MEI4 (lower panel) and the lack of this complex in the presence of ANKRD31 (upper panel). Orange square shows equivalent elution of ANKRD31, REC114, and MEI4 in the presence or absence of IHO1.
- Superose 6 gel filtration elution profiles of His‐MBP‐IHO11–281 mixed with His‐MBP‐ANKRD311808–1857, Strep‐REC114, and His‐MEI41–127 (orange); His‐MBP‐ANKRD311808–1857, Strep‐REC114 and His‐MEI41–127 (blue) and His‐MBP‐IHO11–281 mixed with Strep‐REC114‐His‐MEI41–127 (green). Corresponding SDS–PAGE gel analysis is shown in (G).
- Superose 6 gel filtration elution profiles of His‐MBP‐IHO11–281 mixed with His‐MBP‐ANKRD311808–1857, Strep‐REC114, and His‐MEI41–127 (orange); His‐MBP‐ANKRD311808–1857, Strep‐REC114 and His‐MEI41–127 (blue) and His‐MBP‐IHO11–281 (green). Corresponding SDS–PAGE gel analysis is shown in Appendix Fig S8.
Source data are available online for this figure.
IHO1, ANKRD31, and TOPOVIBL bind to the same REC114 surface
The REC114‐binding region of IHO1 is very well conserved among mammals (Fig 6C), and some sequence similarities have been reported across species up to S. cerevisiae (Tessé et al, 2017). The PH domain has previously been shown to interact via its β‐sheet formed of strands β1, β2, and β6‐β8 in a mutually exclusive way with hydrophobic and aromatic residues of short motifs of TOPOVIBL (Nore et al, 2022) and ANKRD31 (Boekhout et al, 2019). A mutation of L104 on its β‐strand β7 abolished the binding to both ANKRD31 (Boekhout et al, 2019) and to TOPOVIBL (Nore et al, 2022). We could show by ITC that the L104D mutation prevents also the interaction between REC114 and IHO1, suggesting that IHO1 uses this β‐sheet surface for the interaction with REC114 too (Fig 6D). The L104D mutation does not impact the REC114 PH domain structure (Nore et al, 2022). AlphaFold2 models the possible structure of the complex between the REC114 PH domain and the IHO11–30 peptide with a low confidence (Figs 6E and EV5A and B). However, the predicted aligned error plot shows certain degree of confidence about the mutual positions of the two proteins (Fig EV5B). Since in this model the IHO1 peptide is predicted to interact with L104 that is indeed required for the interaction, we also mutated F3 of IHO1, predicted to insert into the cavity that can also accommodate W562 of TOPOVIBL (Nore et al, 2022) and W1842 of ANKRD31 (Boekhout et al, 2019), both essential for binding to REC114. ITC measurement confirmed that the F3E mutation in His‐MBP‐IHO11–23 abolished the interaction with REC114 (Fig 6F). While the AlphaFold2 model is not of sufficient quality to be certain of positions of individual residues of IHO1, our biochemical results demonstrate that IHO1 uses an equivalent surface on REC114 as do TOPOVIBL and ANKRD31 (Fig EV5C–E).
Figure EV5. IHO1‐REC114 interface.
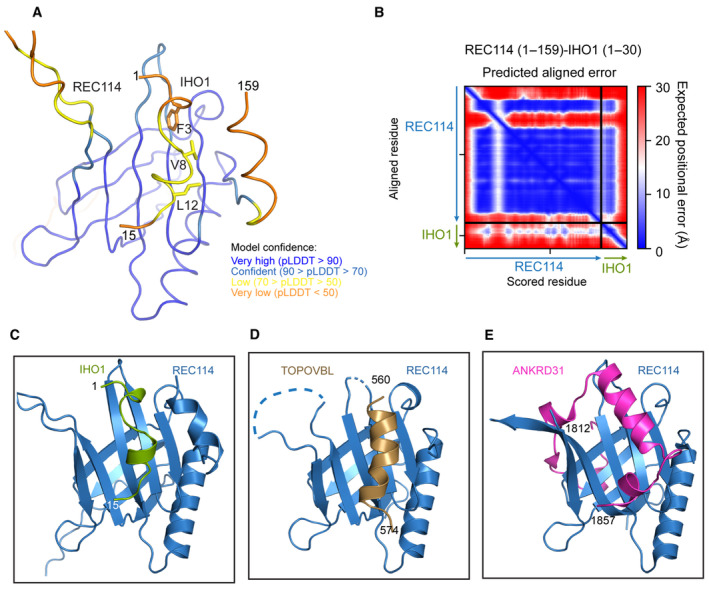
-
AAlphaFold2 model of the complex between REC1141–159 and IHO11–30 colored according to the AlphaFold2 per‐residue estimate of confidence (pLDDT). Only IHO1 residues 1–15 are shown.
-
BPredicted aligned error plot for the model shown in (A).
-
C–EComparison of the AlphaFold2 model of the complex between the PH domain of REC114 and IHO11–15 with crystal structure of the REC114 PH domain bound to a peptide of TOPOVIBL (PDB code: 7QWV) and ANKRD31 (PDB code: 6NXF).
To further test whether IHO1 binding to REC114 is mutually exclusive with the binding of ANKRD31, we wanted to verify whether quaternary complexes including these proteins can be formed on Superose 6 gel filtration. To this end, we prepared a complex between Strep‐REC114, His‐MEI41–127 and MBP‐ANKRD311808–1857 that elutes as a distinct single peak (Fig 6G, middle panel and Fig 6H), showing that REC114 can bind ANKRD31 and MEI4 in the same time. We then mixed MBP‐IHO11–281 with this REC114‐MEI4‐ANKRD31 complex. As expected, in the presence of ANKRD311808–1857 IHO1 does not bind REC114‐MEI4 anymore, and those elute only in complex with ANKRD311808–1857 (Fig 6G, top panel and Fig 6H). The elution profile of IHO1 in mixture with the REC114‐MEI4‐ANKRD31 complex is essentially the same as when IHO1 is injected on its own (Fig 6I; Appendix Fig S8). In the absence of ANKRD311808–1857, IHO1 forms a complex with REC114 and MEI4, as shown above in Fig 5A and B (Fig 6G, bottom panel and Fig 6H). These results show that a REC114 does not interact in the same time with IHO1 and ANKRD31. When TOPOVIBL452–579 is mixed with the complex of Strep‐REC114‐His‐MEI41–127, the resulting complex elutes on Superose 6 in a large peak overlapping with the elution volume of MBP‐IHO11–281, making an equivalent experiment with TOPOVIBL452–579 less interpretable (Appendix Fig S9). It can, however, be noted that the His‐MBP‐IHO11–281 elution peak is not shifted when mixed with Strep‐REC114‐His‐MEI41–127 in the presence of TOPOVIBL452–579 indicating a probable lack of complex formation (Appendix Fig S9). These results thus further show that the binding of IHO1 to REC114 is incompatible with the binging of ANKRD31 or TOPOVIBL.
Discussion
REC114, MEI4, and IHO are known to be essential for DSB formation, and based on their co‐localization and Y2H assays, they were proposed to function as a complex (Pre‐DSB recombinosome), which regulates the TOPOVIL catalytic complex activity (Kumar et al, 2010, 2015, 2018; Stanzione et al, 2016; Dereli et al, 2021). The interaction network and molecular architecture of such a complex remain unclear.
Mouse REC114 possesses a PH domain in its N terminus that forms mutually exclusive interactions with ANKRD31 (Boekhout et al, 2019) and the TOPOVIBL subunit of the catalytic complex forming DSBs (Nore et al, 2022). In addition, its C‐terminal region (residues 203–259) interacts with MEI41–127 in pull‐down assays and gel filtration (Kumar et al, 2018). Similarly, in S. cerevisiae these two proteins interact with equivalent regions, likely with a 2:1 stoichiometry (Claeys Bouuaert et al, 2021a). We could now show that, in the mouse, the two interacting regions can be further truncated to REC114226–254 and MEI41–43. Our attempts to structurally characterize this complex were not successful. In particular, different approaches to analyze the complex by NMR indicated that the complex has a molecular mass higher than expected and is subject to fast exchange between different molecular states. Using native MS, we confirmed this hypothesis. Indeed, REC114 and MEI41–127 form a mixture of 2:1 and 4:2 complexes (Fig 7A). In addition, analytical ultracentrifugation showed that even the minimal complex REC114226–254‐MEI41–43 forms 2:1 and 4:2 complex with fast exchange at pH 8 and slower exchange at pH 4.5. AlphaFold2 predicts with high confidence the structure of the 2:1 REC114:MEI4 complex with contacts between the two short segments we identified in vitro. Mutations of REC114 and MEI4 residues predicted to be key for the interaction indeed abolished the binding in pull‐down assays, providing further evidence for correctness of the model. The interacting residues are conserved in mammals and equivalent prediction can also be made for more distantly related species up to S. cerevisiae, where sequence conservation of the two proteins is less obvious. Overall, even in the absence of experimental structure, these results support the 2:1 stoichiometry of the complex and identified residues essential for the binding.
Figure 7. Model of the IHO1‐REC114‐MEI4 complex.
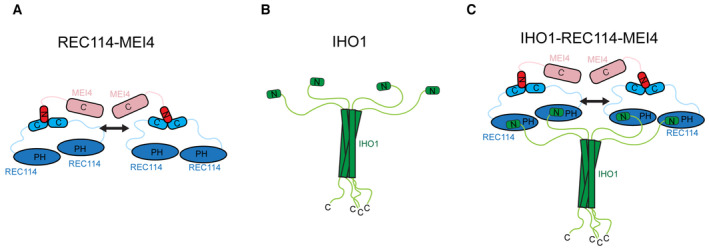
- Model summarizing the current knowledge on the REC114‐MEI4 complex architecture. REC114‐MEI4 form 2:1 and 4:2 complexes through the C termini of REC114 and N terminus of MEI4. The arrow indicates potential dimerization of the REC114‐MEI4 heterotrimers.
- Model summarizing the current knowledge on IHO1 domain architecture. IHO1 forms tetramers and interacts with REC114 with its conserved N terminus.
- Proposed model of the 4:4:2 IHO1‐REC114‐MEI4 complex. The tetramer of IHO1 interacts with four molecules of REC114 binding two molecules of MEI4. The arrow indicates potential dimerization of the REC114‐MEI4 heterotrimers.
REC114226–254 forms homodimers as judged by MALLS and native MS even in the absence of MEI4. Similarly, the S. cerevisiae Rec114 forms Mei4‐independent homodimers (Claeys Bouuaert et al, 2021a). AlphaFold2 predicted structure of the REC114 dimer corresponds to the REC114 dimer in complex with MEI4 (2:1 complex), and we confirmed the residues essential for the homodimerization by mutagenesis. It is likely that the REC114 homodimers are stabilized by MEI4. AlphaFold2 does not predict a convincing model for the 4:2 complex, and atomic details of the dimerization of the REC114‐MEI4 heterotrimers thus remain unknown. It should be noted that we were not able to produce MEI4 with its C‐terminal domain, which might provide further dimerization contacts. We recently reported that REC114‐MEI41–127 forms a stable complex with TOPOVIBL452–579 (Nore et al, 2022). We hypothesize that one of the functions of the REC114‐MEI4 complex might be to contribute to dimerization TOPOVIBL. Indeed, the AlphaFold2 model of the mouse SPO11‐TOPOVIBL complex indicates that the putative TOPOVIBL ATP‐binding site, which is required in TOPOVIB for its ATP‐mediated dimerization, is degenerated (Nore et al, 2022). Hence, the interaction with REC114‐MEI4 might provide an alternative means of dimerization of the catalytic complex.
IHO1 was shown to interact with REC114 in Y2H assay, but direct interaction between the two proteins could not be detected (Stanzione et al, 2016). In S. cerevisiae, Rec114‐Mei4 and Mer2 (IHO1 ortholog) were proposed not to form a complex, but rather to create common DNA‐based condensates. Here, we demonstrate by gel filtration and ITC measurement that in the mouse, IHO1 and REC114‐MEI4 form a stable complex. This interaction requires a highly conserved N terminus of IHO1, and the PH domain of REC114 and the K d of the interaction measured by ITC is 30.4 μM. The AlphaFold2 model of the complex is not predicted with high confidence; nevertheless, it guided us to identify conserved residues of REC114 and IHO1 that are indeed required for the interaction.
We could also show by MALLS that mouse IHO1 forms tetramers with its central helical region (Fig 7B). This has already been shown for the yeast Mer2 (Rousova et al, 2021; Claeys Bouuaert et al, 2021a). AlphaFold2 predicts the tetramerization region to be a long four‐stranded parallel coiled‐coil for mouse and other species. Given that REC114 and MEI4 form 2:1 and 4:2 complexes and each PH domain of REC114 possess a binding site for one N‐terminal peptide of IHO1, it is tempting to speculate that the REC114‐MEI4‐IHO1 complex might be formed of 4 IHO1, 4 REC114, and 2 MEI4 molecules (Fig 7A–C). Native MS and MALLS characterization of such a complex did not yield convincing stoichiometry values, likely due to the fast exchange and low binding affinity. Importantly, the IHO1 binding requires the same REC114 residue L104, which is positioned centrally in its β‐sheet and which interacts with hydrophobic and aromatic residues of short motifs of TOPOVIBL (Nore et al, 2022) and ANKRD31 (Boekhout et al, 2019), indicating a shared interacting surface and hence mutually exclusive binding of these proteins. The binding of ANKRD31 and TOPOVIBL to REC114 is indeed incompatible (Nore et al, 2022). We could show, using size exclusion chromatography, that in the presence of ANKRD311808–1857, IHO1 does not bind REC114‐MEI4 anymore. The same is probably true for TOPOVIBL, since no peak shift of IHO1 is observed when REC114‐MEI4 is first mixed with TOPOVIBL452–579. The binding affinity of ANKRD31 for REC114 is not known, since the ANKRD31 peptide aggregates in the absence of REC114, but given the large interaction interface on REC114 it is likely higher than that of TOPOVIBL (K d = 3 μM; Nore et al, 2022). IHO1 thus binds to REC114 with lower affinity than TOPOIVBL and ANKRD31, even though within the larger IHO1‐REC114‐MEI4 complex containing 4 REC114‐IHO1 interfaces, the affinity might be higher. This modest affinity might also explain why a direct REC114‐IHO1 interaction was not detected in pull‐downs or immunoprecipitations (Stanzione et al, 2016). The affinity might also be modified by posttranslational modifications or other protein or DNA factors. Indeed, in yeast, recruitment of Rec114 and Mei4 to chromosomal axis depends on Mer2 phosphorylation by Cdk (Henderson et al, 2006; Sasanuma et al, 2008; Panizza et al, 2011).
How these different proteins interact in vivo remains a challenging question. Considering the biochemical knowledge, one would expect at least two main complexes, the SPO11‐TOPOVIBL complex and the IHO1‐MEI4‐REC114 complex. SPO11‐TOPOVIBL is the catalytic activity and may not be in excess as suggested by dosage effect of SPO11 on DSB activity (Cole et al, 2012). SPO11 is also predicted to form a dimer, essential for DNA cleavage, as in archeal TOPOVIA the catalytic site is formed by residues of two protomers (Nichols et al, 1999). In TOPOVI, the dimerization is promoted by the ATP‐binding activity of TOPOVIB (Corbett et al, 2007; Graille et al, 2008). Since TOPOVIBL is likely defective for ATP binding (Nore et al, 2022), it is possible that the SPO11‐TOPOVIBL complex has adopted an alternative strategy to dimerize. This strategy may be based on the REC114‐MEI4 2:1 complex via the interaction of REC114 with TOPOVIBL. In addition to the catalytic activity, DSB formation has one additional predicted requirement: DSBs should take place in the context of the chromosome axis. This implies that specific interactions bring the DSB site in proximity to axis and to REC114‐MEI4‐IHO1. In S. cerevisiae, this step is ensured by Spp1, which interacts both with H3K4me3 (near DSB sites) and with Mer2 (Acquaviva et al, 2013; Sommermeyer et al, 2013). In mice, the DSB sites are bound by PRDM9 and have several epigenetic modifications (Grey et al, 2018). Following a model based on S. cerevisiae observations, it is possible that the PRDM9‐dependent epigenetic modifications (H3K4me3, H3K36me3, and indirectly H3K9Ac) are recognized by a reader, which also interacts directly or indirectly with the axis‐located REC114‐MEI4‐IHO1. Since ANKRD31 has a potential to interact with chromatin (Saredi et al, 2016; Boekhout et al, 2019), it may be involved in such DSB/axis interaction. If so, it is not absolutely required since DSBs can still form, although at reduced levels at PRDM9 sites in Ankrd31 −/− mice (Boekhout et al, 2019; Papanikos et al, 2019). One could envision that ANKRD31 acts early in the control of DSB formation via its interaction with REC114, possibly transiently and that in a second step, once DSB sites are located near axes, ANKRD31 may detach from REC114 which is then available to interact with TOPOVIBL for promoting the above‐discussed dimerization. In analogy to yeast, the REC114‐MEI4‐IHO1 complex may be a condensate with multiple complexes; it is also possible that some REC114 molecules may still be interacting with ANKRD31 while others with IHO1 that could further stabilize the complex on axes since IHO1 is an interactor of the axis protein HORMAD1 (Stanzione et al, 2016). Such dynamic and stepwise regulation in the organization of these complexes could be consistent with the exclusive binding of ANKRD31, IHO1, and TOPOVIBL to the PH domain of REC114. The complexity is further strengthened by observations that in yeast two‐hybrid assays ANKRD31 directly interacted with IHO1 in addition to REC114 (Papanikos et al, 2019) and that MEI4 also co‐immunoprecipitates with IHO1 even in cells lacking REC114, indicating other potential contacts between these proteins (Kumar et al, 2018). These observations imply subtle regulations that could be influenced by stoichiometry and/or posttranslational modifications. How exactly IHO1, TOPOVIBL, and ANKRD31 succeed each other on the surface of REC114 in vivo and how these interactions are coordinated in order to regulate meiotic recombination in different parts of the genome thus remains to be established.
Materials and Methods
Protein expression and purification
All IHO1 constructs were expressed as His‐MBP‐tag fusions from the pETM41 vector (EMBL), or as a His‐Sumo‐tag fusion from pETM11 vector (EMBL) in E. coli BL21‐Gold cells (DE3, Agilent). The protein was first purified on amylose resin (NEB) in a buffer containing 20 mM Tris pH 8, 100 mM NaCl, 2 mM β‐mercaptoethanol, 5% glycerol, and 1 mM EDTA. To prepare an untagged protein, the His‐MBP tag was cleaved off by TEV protease and the protein was further purified by a passage through a Ni2+‐Chelating Sepharose (GE Healthcare). IHO1 was then purified by a gel filtration on Superdex 200 (GE Healthcare).
REC114226–254, REC114222–257, and its mutants were expressed in E. coli BL21‐Gold cells (DE3, Agilent) from pETM41 vector (EMBL) as His‐MBP‐tag fusions. REC1141–159 and its mutant were cloned into pRSFDuet‐1 vector as Strep‐tag fusions. The proteins were, respectively, purified by affinity chromatography (amylose resin [NEB] or Strep‐Tactin XT resin [IBA]) and by Superdex 200 size exclusion chromatography in a buffer containing 20 mM Tris pH 8, 100 mM NaCl, and 2 mM β‐mercaptoethanol.
Protein complex reconstitution
Strep‐Full‐length REC114 and His‐MEI41–127 were co‐expressed from pRSFDuet‐1 (Novagen) and pProEXHTb (Invitrogen) vectors, respectively, in E. coli BL21Gold (DE3) cells. The REC114‐MEI4 complex was purified using a Strep‐Tactin XT resin (IBA) and by a gel filtration on Superdex 200 (GE Healthcare). For complex formation with IHO1, the REC114‐MEI4 complex was first mixed with the purified His‐MBP‐IHO1 (or His‐Sumo‐IHO1) in a molar ratio of 2:1. The sample was then applied onto a Superose 6 gel filtration column (GE Healthcare) in 20 mM Tris pH 8, 100 mM NaCl, 5% glycerol, and 2 mM β‐mercaptoethanol.
His‐MBP‐REC114226–254 and His‐MEI41–43 were co‐expressed from pETM41 (EMBL) and pProEXHTb (Invitrogen) vectors, respectively, in E. coli BL21‐Gold cells (DE3, Agilent) and were first purified by affinity chromatography using the amylose resin (NEB). For untagged complex, the His‐MBP and His‐tags were removed by TEV protease and a passage through a Ni2+ chelating Sepharose (GE Healthcare). The final purification step was size exclusion chromatography on Superdex 200 size exclusion chromatography (GE Healthcare).
ANKRD311808–1857 was cloned as His‐MBP fusion into pETM41 (EMBL). The Strep‐FL‐REC114‐His‐MEI41–127 complex and ANKRD311808–1857 were individually expressed in E. coli BL21Gold (DE3) cells. Following cell disruption, supernatants containing soluble Strep‐FL‐REC114‐His‐MEI41–127 and ANKRD311808–1857 were mixed. The ternary complex was further purified by Strep‐Tactin XT resin (IBA) and Superose 6 size exclusion chromatography (GE Healthcare).
TOPOVIBL452–579 was cloned as a His‐tag fusion into pProEXHTb (Invitrogen). REC114‐MEI4 complex and TOPOVIBL452–579 were individually expressed in E. coli BL21Gold (DE3) cells and purified, respectively, on Strep‐Tactin XT resin (IBA) or Ni2+‐Chelating Sepharose (GE Healthcare). Proteins were mixed in a molar ratio of 2:1 and further purified by gel filtration on Superose 6 (GE, Healthcare).
Pull‐down assays
MEI4 constructs were cloned into pProEXHTb (Invitrogen) as a His‐tag fusion and REC114226–254 into pETM41 vector as a His‐MBP fusion. His‐MBP‐REC114226–254 was co‐expressed with the different constructs of MEI4 in E. coli BL21‐Gold (DE3) cells (Agilent). Following cell disruption, the REC114‐MEI4 protein‐containing supernatants were loaded onto an Amylose resin (NEB). After extensive washing with a buffer containing 20 mM Tris pH 8, 100 mM NaCl, 5% glycerol, and 2 mM β‐mercaptoethanol, bound proteins were eluted by the addition of 10 mM maltose and analyzed on 15% SDS–PAGE. For analysis of the interaction between REC114 constructs and MEI4, REC114 variants were cloned as N‐terminal Strep‐tag fusions into pRSFDuet‐1 (Novagen) and co‐expressed with MEI41–127 that was cloned as a His‐tag fusion into pProEXHTb (Invitrogen). Supernatants were applied to Strep‐Tactin XT resin (IBA) that was extensively washed with 20 mM Tris pH 8, 100 mM NaCl, 5% glycerol, and 2 mM β‐mercaptoethanol, and the bound proteins were eluted with the addition of 50 mM of D‐Biotin.
To analyze the impact of REC114 and MEI4 mutants, full‐length REC114 and its mutants were cloned as Strep‐tag fusions into pRSFDuet‐1 (Novagen). MEI41–43 and its mutants were cloned as His‐MBP fusions in pETM41. Proteins were expressed individually in E. coli BL21Gold (DE3) cells. REC114 and MEI4 variants were purified by affinity chromatography (Strep‐Tactin XT resin (IBA) and Ni2+‐Chelating Sepharose, GE Healthcare, respectively) and gel filtration on Superdex 200 (GE, Healthcare). REC114 and MEI4 were mixed and loaded onto Strep‐Tactin XT (IBA) resin columns. Columns were extensively washed with 20 mM Tris pH 8, 100 mM NaCl, 5% glycerol, and 2 mM β‐mercaptoethanol, and bound proteins were eluted by the addition of 50 mM of D‐Biotin and analyzed by 15% SDS–PAGE.
Isothermal titration calorimetry (ITC)
ITC experiments were performed at 25°C using an ITC200 microcalorimeter (MicroCal). Experiments included one 0.5 μl injection and 15–25 injections of 1.5–2.5 μl of 0.5‐1 mM His‐MBP‐IHO1 (IHO11–281, IHO11–23, or IHO11–23, F3E) into the sample cell that contained 30 μM Strep‐REC114‐His‐MEI41–127 (or Strep‐REC1141–159 or Strep‐REC1141–159, L104D) in 20 mM Tris pH 8.0, 100 mM NaCl, and 2 mM β‐mercaptoethanol. The initial data point was deleted from the data sets. Binding isotherms were fitted with a one‐site binding model by nonlinear regression using the MicroCal PEAQ‐ITC Analysis software.
Size exclusion chromatography coupled to multiangle laser light scattering
SEC‐MALLS experiments were performed on high‐performance liquid chromatography (HPLC) system (Shimadzu, Kyoto, Japan), consisting of a DGU‐20 AD degasser, an LC‐20 AD pump, a SIL20‐ACHT autosampler, an XL‐Therm column oven (WynSep, Sainte Foy d'Aigrefeuille, France), a CBM‐20A communication interface, an SPD‐M20A UV–visible detector, a miniDAWN TREOS static light scattering detector, a DynaPro NanoStar dynamic light scattering detector, and an Optilab rEX refractive index detector (Wyatt, Santa Barbara, USA). The samples were stored at 4°C, and a volume of 50–100 μl was injected on a Superdex 200 size exclusion column equilibrated with 20 mM Tris pH 8.0 and 100 mM NaCl, filtered at 0.1 μm, at a flow rate of 0.5 ml/min. The analysis of the data was done with the software ASTRA v5 (Wyatt, Santa Barbara, USA).
Analytical ultracentrifugation
Sedimentation velocity experiments were performed at 130,000 g and 10°C, on a Beckman XLI analytical ultracentrifuge using a AN‐50 Ti rotor (Beckman Coulter, Brea, USA) and double‐sector cells with optical path lengths of 12 and 3 mm equipped with sapphire windows (Nanolytics, Potsdam, DE). The reference were sample buffers, for pH 8.0 samples: 200 mM NaCl, 20 mM Tris pH 8.0 and for pH 4.5 samples: 500 mM NaCl, 20 mM Sodium Acetate pH 4.5. Measurements were made on 0.2, 1, and 4.5 mg/ml sample using absorbance at 280 nm and interference optics. Data were processed with the REDATE software (https://www.utsouthwestern.edu/labs/mbr/software/), and the parameters were determined with SEDNTERP and SEDFIT (Schuck, 2000). Analysis of sedimentation coefficients and molecular weights was performed using SEDFIT (Schuck, 2000) and GUSSI (Brautigam, 2015).
Liquid chromatography/electrospray‐ionization mass spectrometry (LC/ESI‐TOF‐MS)
To assess the mass of the different proteins, a 6210 TOF mass spectrometer coupled to a HPLC system (1100 series, Agilent Technologies) was used. The mass spectrometer was calibrated with tuning mix (ESI‐L, Agilent Technologies). The following instrumental settings were used: gas temperature (nitrogen) 300°C, drying gas (nitrogen) 7 l/min, nebulizer gas (nitrogen) 10 psi, Vcap 4 kV, fragmentor 250 V, skimmer 60 V, and Vpp (octopole RF) 250 V. The HPLC mobile phases were prepared with HPLC‐grade solvents. Mobile phase A composition was: H2O 95%, ACN 5%, and TFA 0.03%. Mobile phase B composition was as follows: ACN 95%, H2O 5%, and TFA 0.03%. Each protein was diluted to 5 uM using mobile phase A. Four μl of each sample (20 pmol) was injected into HPLC system MS analysis and was first desalted online for 3 min with 100% of mobile phase A (flow rate of 50 μl/min), using a C8 reverse phase micro‐column (Zorbax 300SB‐C8, 5 μm, 5 × 0.3 mm, Agilent Technologies). The sample was then eluted with 70% of mobile phase B (flow rate of 50 μl/min), and MS spectra were acquired in the positive ion mode in the 300–3,000 m/z range (Boeri Erba et al, 2018). Data were processed using MassHunter software (v. B.02.00, Agilent Technologies) and GPMAW software (v. 7.00b2, Lighthouse Data, Denmark).
Native mass spectrometry
The samples were analyzed by native mass spectrometry (Boeri Erba et al, 2018, 2020; Puglisi et al, 2020). Protein ions were generated using a nanoflow electrospray (nano‐ESI) source. Nanoflow platinum‐coated borosilicate electrospray capillaries were bought from Thermo Electron SAS (Courtaboeuf, France). MS analyses were carried out on a quadrupole time‐of‐flight mass spectrometer (Q‐TOF Ultima, Waters Corporation, Manchester, U.K.). The instrument was modified for the detection of high masses (Sobott et al, 2002; van den Heuvel et al, 2006). The following instrumental parameters were used: capillary voltage = 1.2–1.3 kV, cone potential = 40 V, RF lens‐1 potential = 40 V, RF lens‐2 potential = 1 V, aperture‐1 potential = 0 V, collision energy = 30–140 V, and microchannel plate (MCP) = 1,900 V. All mass spectra were calibrated externally using a solution of cesium iodide (6 mg/ml in 50% isopropanol) and were processed using the Masslynx 4.0 software (Waters Corporation, Manchester, UK) Massign software package (Morgner & Robinson, 2012) and UniDec (Marty et al, 2015).
Small‐angle X‐ray scattering (SAXS)
All SAXS datasets were recorded at the BioSAXS BM29 beamline at the European Synchrotron Radiation Facility (ESRF), Grenoble, France (Tully et al, 2023), using an X‐ray wavelength of 0.99 Å and a sample‐detector distance of 2.867 m. All 2D detector images (samples and buffers) were reduced into 1D SAXS curves with ESRF in‐house software (Kieffer et al, 2022). Batch samples were measured at 3–4 concentrations (between 1 and 4 mg/ml) to check for particle interaction effects, with ten 1 s exposure frames per concentration. The final 1D SAXS curves were obtained by averaging a maximum of individual sample and buffer frames (while excluding frames that displayed radiation damage) and by subtracting the thus averaged buffer from the respective averaged sample. SEC‐SAXS data were recorded using the online HPLC (Tully et al, 2023). Six hundred individual 4 s frames were recorded, during which the absorbance at 280 nm was monitored. Radii of gyration (RG) were determined using the Guinier approximation with the program PRIMUS from the ATSAS suite (Manalastas‐Cantos et al, 2021). Fits of atomic models were carried out using the program CRYSOL from the same suite, in standard mode and without solvent optimization. The parallel tetrameric MBP‐IHO1125–261 model was assembled manually using the crystal structure of MBP (PDB code‐4H1G), which was linked by a 5‐residue linker to the AlphaFold2 model of IHO1125–261 tetramer. The antiparallel version was modeled manually in Coot (Emsley et al, 2010). The starting MBP‐IHO1125–261 models were refined using the program CORAL from the ATSAS suite, by allowing a flexible linker (five residues) between rigid individual coiled‐coil and MBP domains, and by imposing fixed relative positions of all four coiled‐coil domains (i.e., only the four MBP domains were allowed to move within the steric linker restraints).
Author contributions
Hamida Laroussi: Conceptualization; data curation; formal analysis; validation; investigation; methodology; writing – review and editing. Ariadna B Juarez‐Martinez: Data curation; formal analysis; investigation; methodology. Aline Le Roy: Data curation; formal analysis; investigation; methodology; writing – review and editing. Elisabetta Boeri Erba: Data curation; formal analysis; investigation; methodology; writing – review and editing. Frank Gabel: Data curation; formal analysis; investigation; methodology; writing – review and editing. Bernard de Massy: Conceptualization; funding acquisition; writing – original draft; writing – review and editing. Jan Kadlec: Conceptualization; data curation; formal analysis; supervision; funding acquisition; validation; investigation; writing – original draft; project administration; writing – review and editing.
Disclosure and competing interests statement
The authors declare that they have no conflict of interest.
Supporting information
Appendix
Expanded View Figures PDF
PDF+
Source Data for Figure 1
Source Data for Figure 2
Source Data for Figure 3
Source Data for Figure 4
Source Data for Figure 5
Source Data for Figure 6
Acknowledgements
We thank Adrien Favier and Cameron D. Mackereth for initial NMR analysis. We thank Marjolaine Noirclerc‐Savoye for help with AlphaFold2 modeling. We thank Henri‐Marc Bourbon for discussions on the AlphaFold2 models. We thank Anne‐Emmanuelle Foucher for help with biochemical experiments. We acknowledge access to the BioSAXS beamline BM29 at ESRF through the mx2398 BAG proposal system and assistance by the local contact Petra Pernot during the experiments. IBS acknowledges integration into the Interdisciplinary Research Institute of Grenoble (IRIG, CEA). This work used the platforms of the Grenoble Instruct‐ERIC center (ISBG; UAR 3518 CNRS‐CEA‐UGA‐EMBL) within the Grenoble Partnership for Structural Biology (PSB), supported by FRISBI (ANR‐10‐INBS‐0005‐02) and GRAL, and financed within the University Grenoble Alpes graduate school (Ecoles Universitaires de Recherche) CBH‐EUR‐GS (ANR‐17‐EURE‐0003). We thank Caroline Mas for assistance with ITC. JK and BdM were funded by ANR Topobreaks (ANR‐18‐CE11‐0024‐01). BdM was funded by ERC (European Research Council [ERC] Executive Agency under the European Union's Horizon 2020 research and innovation program [Grant Agreement No. 883605]). Ariadna B Juarez‐Martinez was supported by the Labex GRAL (Grenoble Alliance for Integrated Structural Cell Biology; ANR‐10‐LABX‐49‐01) and the People Programme (Marie Curie Actions) of the European Union's Seventh Framework Programme (FP7/2007‐2013) under REA grant agreement PCOFUND‐GA‐2013‐609102, through the PRESTIGE program coordinated by Campus France. Financial support from the Centre National de la Recherche Scientifique (IR‐RMN‐THC Fr3050) is gratefully acknowledged.
The EMBO Journal (2023) 42: e113866
Data availability
The original SAXS data are referenced under the following DOIs: https://doi.org/10.15151/ESRF‐ES‐1057334215 and https://doi.org/10.15151/ESRF‐ES‐701731695.
References
- Acquaviva L, Székvölgyi L, Dichtl B, Dichtl BS, Saint André CDLR, Nicolas A, Géli V (2013) The COMPASS subunit Spp1 links histone methylation to initiation of meiotic recombination. Science 339: 215–218 [DOI] [PubMed] [Google Scholar]
- Acquaviva L, Boekhout M, Karasu ME, Brick K, Pratto F, Li T, van Overbeek M, Kauppi L, Camerini‐Otero RD, Jasin M et al (2020) Ensuring meiotic DNA break formation in the mouse pseudoautosomal region. Nature 582: 426–431 [DOI] [PMC free article] [PubMed] [Google Scholar]
- Arora C, Kee K, Maleki S, Keeney S (2004) Antiviral protein Ski8 is a direct partner of Spo11 in meiotic DNA break formation, independent of its cytoplasmic role in RNA metabolism. Mol Cell 13: 549–559 [DOI] [PubMed] [Google Scholar]
- Ayoub N, Roth P, Ucurum Z, Fotiadis D, Hirschi S (2023) Structural and biochemical insights into his‐tag‐induced higher‐order oligomerization of membrane proteins by cryo‐EM and size exclusion chromatography. J Struct Biol 215: 107924 [DOI] [PubMed] [Google Scholar]
- Baudat F, Manova K, Yuen JP, Jasin M, Keeney S (2000) Chromosome synapsis defects and sexually dimorphic meiotic progression in mice lacking Spo11. Mol Cell 6: 989–998 [DOI] [PubMed] [Google Scholar]
- Baudat F, Imai Y, De Massy B (2013) Meiotic recombination in mammals: localization and regulation. Nat Rev Genet 14: 794–806 [DOI] [PubMed] [Google Scholar]
- Boekhout M, Karasu ME, Wang J, Acquaviva L, Pratto F, Brick K, Eng DY, Xu J, Camerini‐Otero RD, Patel DJ et al (2019) REC114 partner ANKRD31 controls number, timing, and location of meiotic DNA breaks. Mol Cell 74: 1053–1068 [DOI] [PMC free article] [PubMed] [Google Scholar]
- Boeri Erba E, Signor L, Oliva MF, Hans F, Petosa C (2018) Characterizing intact macromolecular complexes using native mass spectrometry. Methods Mol Biol 1764: 133–151 [DOI] [PubMed] [Google Scholar]
- Boeri Erba E, Signor L, Petosa C (2020) Exploring the structure and dynamics of macromolecular complexes by native mass spectrometry. J Proteomics 222: 103799 [DOI] [PubMed] [Google Scholar]
- Brautigam CA (2015) Calculations and publication‐quality illustrations for analytical ultracentrifugation data. Methods Enzymol 562: 109–133 [DOI] [PubMed] [Google Scholar]
- Brinkmeier J, Coelho S, de Massy B, Bourbon H‐M (2022) Evolution and diversity of the TopoVI and TopoVI‐like subunits with extensive divergence of the TOPOVIBL subunit. Mol Biol Evol 39: msac227 [DOI] [PMC free article] [PubMed] [Google Scholar]
- Claeys Bouuaert C, Pu S, Wang J, Oger C, Daccache D, Xie W, Patel DJ, Keeney S (2021a) DNA‐driven condensation assembles the meiotic DNA break machinery. Nature 592: 144–149 [DOI] [PMC free article] [PubMed] [Google Scholar]
- Claeys Bouuaert C, Tischfield SE, Pu S, Mimitou EP, Arias‐Palomo E, Berger JM, Keeney S (2021b) Structural and functional characterization of the Spo11 core complex. Nat Struct Mol Biol 28: 92–102 [DOI] [PMC free article] [PubMed] [Google Scholar]
- Cole F, Kauppi L, Lange J, Roig I, Wang R, Keeney S, Jasin M (2012) Homeostatic control of recombination is implemented progressively in mouse meiosis. Nat Cell Biol 14: 424–430 [DOI] [PMC free article] [PubMed] [Google Scholar]
- Corbett KD, Benedetti P, Berger JM (2007) Holoenzyme assembly and ATP‐mediated conformational dynamics of topoisomerase VI. Nat Struct Mol Biol 14: 611–619 [DOI] [PubMed] [Google Scholar]
- Dereli I, Stanzione M, Olmeda F, Papanikos F, Baumann M, Demir S, Carofiglio F, Lange J, De Massy B, Baarends WM et al (2021) Four‐pronged negative feedback of DSB machinery in meiotic DNA‐break control in mice. Nucleic Acids Res 49: 2609–2628 [DOI] [PMC free article] [PubMed] [Google Scholar]
- Emsley P, Lohkamp B, Scott WG, Cowtan K (2010) Features and development of coot. Acta Crystallogr D Biol Crystallogr 66: 486–501 [DOI] [PMC free article] [PubMed] [Google Scholar]
- Graille M, Cladière L, Durand D, Lecointe F, Gadelle D, Quevillon‐Cheruel S, Vachette P, Forterre P, van Tilbeurgh H (2008) Crystal structure of an intact type II DNA topoisomerase: insights into DNA transfer mechanisms. Structure 16: 360–370 [DOI] [PubMed] [Google Scholar]
- Grey C, Baudat F, de Massy B (2018) Prdm9, a driver of the genetic map. PLoS Genet 14: e1007479 [DOI] [PMC free article] [PubMed] [Google Scholar]
- Henderson KA, Kee K, Maleki S, Santini PA, Keeney S (2006) Cyclin‐dependent kinase directly regulates initiation of meiotic recombination. Cell 125: 1321–1332 [DOI] [PMC free article] [PubMed] [Google Scholar]
- van den Heuvel RH, van Duijn E, Mazon H, Synowsky SA, Lorenzen K, Versluis C, Brouns SJ, Langridge D, van der Oost J, Hoyes J et al. (2006) Improving the performance of a quadrupole time-of-flight instrument for macromolecular mass spectrometry. Anal Chem 78: 7473–7483 [DOI] [PubMed] [Google Scholar]
- Hunter N (2015) Meiotic recombination: the essence of heredity. Cold Spring Harb Perspect Biol 7: a016618 [DOI] [PMC free article] [PubMed] [Google Scholar]
- Jiao K, Salem L, Malone R (2003) Support for a meiotic recombination initiation complex: interactions among Rec102p, Rec104p, and Spo11p. Mol Cell Biol 23: 5928–5938 [DOI] [PMC free article] [PubMed] [Google Scholar]
- Jumper J, Evans R, Pritzel A, Green T, Figurnov M, Ronneberger O, Tunyasuvunakool K, Bates R, Žídek A, Potapenko A et al (2021) Highly accurate protein structure prediction with AlphaFold. Nature 596: 583–589 [DOI] [PMC free article] [PubMed] [Google Scholar]
- Kieffer J, Brennich M, Florial J‐B, Oscarsson M, Antolinos ADM, Tully M, Pernot P (2022) New data analysis for BioSAXS at the ESRF. J Synchrotron Rad 29: 1318–1328 [DOI] [PMC free article] [PubMed] [Google Scholar]
- Kumar R, Bourbon HM, De Massy B (2010) Functional conservation of Mei4 for meiotic DNA double‐strand break formation from yeasts to mice. Genes Dev 24: 1266–1280 [DOI] [PMC free article] [PubMed] [Google Scholar]
- Kumar R, Ghyselinck N, Ishiguro K, Watanabe Y, Kouznetsova A, Höög C, Strong E, Schimenti J, Daniel K, Toth A et al (2015) MEI4 ‐ a central player in the regulation of meiotic DNA double‐strand break formation in the mouse. J Cell Sci 128: 1800–1811 [DOI] [PMC free article] [PubMed] [Google Scholar]
- Kumar R, Oliver C, Brun C, Juarez‐Martinez AB, Tarabay Y, Kadlec J, De Massy B (2018) Mouse REC114 is essential for meiotic DNA double‐strand break formation and forms a complex with MEI4. Life Sci Alliance 1: e201800259 [DOI] [PMC free article] [PubMed] [Google Scholar]
- Lam I, Keeney S (2015) Mechanism and regulation of meiotic recombination initiation. Cold Spring Harb Perspect Biol 7: a016634 [DOI] [PMC free article] [PubMed] [Google Scholar]
- Lin Z, Akin H, Rao R, Hie B, Zhu Z, Lu W, Smetanin N, Verkuil R, Kabeli O, Shmueli Y et al (2023) Evolutionary‐scale prediction of atomic‐level protein structure with a language model. Science 379: 1123–1130 [DOI] [PubMed] [Google Scholar]
- Maleki S, Neale MJ, Arora C, Henderson KA, Keeney S (2007) Interactions between Mei4, Rec114, and other proteins required for meiotic DNA double‐strand break formation in Saccharomyces cerevisiae. Chromosoma 116: 471–486 [DOI] [PMC free article] [PubMed] [Google Scholar]
- Manalastas‐Cantos K, Konarev PV, Hajizadeh NR, Kikhney AG, Petoukhov MV, Molodenskiy DS, Panjkovich A, Mertens HDT, Gruzinov A, Borges C et al (2021) ATSAS 3.0: expanded functionality and new tools for small‐angle scattering data analysis. J Appl Cryst 54: 343–355 [DOI] [PMC free article] [PubMed] [Google Scholar]
- Marty MT, Baldwin AJ, Marklund EG, Hochberg GKA, Benesch JLP, Robinson CV (2015) Bayesian deconvolution of mass and ion mobility spectra: from binary interactions to polydisperse ensembles. Anal Chem 87: 4370–4376 [DOI] [PMC free article] [PubMed] [Google Scholar]
- de Massy B (2013) Initiation of meiotic recombination: how and where? Conservation and specificities among eukaryotes. Annu Rev Genet 47: 563–599 [DOI] [PubMed] [Google Scholar]
- Morgner N, Robinson CV (2012) Massign: an assignment strategy for maximizing information from the mass spectra of heterogeneous protein assemblies. Anal Chem 84: 2939–2948 [DOI] [PubMed] [Google Scholar]
- Nichols MD, DeAngelis K, Keck JL, Berger JM (1999) Structure and function of an archaeal topoisomerase VI subunit with homology to the meiotic recombination factor Spo11. EMBO J 18: 6177–6188 [DOI] [PMC free article] [PubMed] [Google Scholar]
- Nore A, Juarez‐Martinez AB, Clément J, Brun C, Diagouraga B, Laroussi H, Grey C, Bourbon HM, Kadlec J, Robert T et al (2022) TOPOVIBL‐REC114 interaction regulates meiotic DNA double‐strand breaks. Nat Commun 13: 7048 [DOI] [PMC free article] [PubMed] [Google Scholar]
- Panizza S, Mendoza MA, Berlinger M, Huang L, Nicolas A, Shirahige K, Klein F (2011) Spo11‐accessory proteins link double‐strand break sites to the chromosome axis in early meiotic recombination. Cell 146: 372–383 [DOI] [PubMed] [Google Scholar]
- Papanikos F, Clément JAJ, Testa E, Ravindranathan R, Grey C, Dereli I, Bondarieva A, Valerio‐Cabrera S, Stanzione M, Schleiffer A et al (2019) Mouse ANKRD31 regulates spatiotemporal patterning of meiotic recombination initiation and ensures recombination between X and Y sex chromosomes. Mol Cell 74: 1069–1085 [DOI] [PubMed] [Google Scholar]
- Puglisi R, Boeri Erba E, Pastore A (2020) A guide to native mass spectrometry to determine complex interactomes of molecular machines. FEBS J 287: 2428–2439 [DOI] [PMC free article] [PubMed] [Google Scholar]
- Reinholdt LG, Schimenti JC (2005) Mei1 is epistatic to Dmc1 during mouse meiosis. Chromosoma 114: 127–134 [DOI] [PubMed] [Google Scholar]
- Robert T, Nore A, Brun C, Maffre C, Crimi B, Guichard V, Bourbon H‐M, de Massy B (2016) The TopoVIB‐like protein family is required for meiotic DNA double‐strand break formation. Science 351: 943–949 [DOI] [PubMed] [Google Scholar]
- Romanienko PJ, Camerini‐Otero RD (2000) The mouse Spo11 gene is required for meiotic chromosome synapsis. Mol Cell 6: 975–987 [DOI] [PubMed] [Google Scholar]
- Rousova D, Nivsarkar V, Altmannova V, Raina VB, Funk SK, Liedtke D, Janning P, Müller F, Reichle H, Vader G et al (2021) Novel mechanistic insights into the role of Mer2 as the keystone of meiotic DNA break formation. Elife 10: e72330 [DOI] [PMC free article] [PubMed] [Google Scholar]
- Saredi G, Huang H, Hammond CM, Alabert C, Bekker‐Jensen S, Forne I, Reverón‐Gómez N, Foster BM, Mlejnkova L, Bartke T et al (2016) H4K20me0 marks post‐replicative chromatin and recruits the TONSL‐MMS22L DNA repair complex. Nature 534: 714–718 [DOI] [PMC free article] [PubMed] [Google Scholar]
- Sasanuma H, Hirota K, Fukuda T, Kakusho N, Kugou K, Kawasaki Y, Shibata T, Masai H, Ohta K (2008) Cdc7‐dependent phosphorylation of Mer2 facilitates initiation of yeast meiotic recombination. Genes Dev 22: 398–410 [DOI] [PMC free article] [PubMed] [Google Scholar]
- Schuck P (2000) Size‐distribution analysis of macromolecules by sedimentation velocity ultracentrifugation and Lamm equation modeling. Biophys J 78: 1606–1619 [DOI] [PMC free article] [PubMed] [Google Scholar]
- Sobott F, Hernandez H, McCammon MG, Tito MA, Robinson CV (2002) A tandem mass spectrometer for improved transmission and analysis of large macromolecular assemblies. Anal Chem 74: 1402–1407 [DOI] [PubMed] [Google Scholar]
- Sommermeyer V, Béneut C, Chaplais E, Serrentino ME, Borde V (2013) Spp1, a member of the Set1 complex, promotes meiotic DSB formation in promoters by tethering histone H3K4 methylation sites to chromosome axes. Mol Cell 49: 43–54 [DOI] [PubMed] [Google Scholar]
- Stanzione M, Baumann M, Papanikos F, Dereli I, Lange J, Ramlal A, Tränkner D, Shibuya H, de Massy B, Watanabe Y et al (2016) Meiotic DNA break formation requires the unsynapsed chromosome axis‐binding protein IHO1 (CCDC36) in mice. Nat Cell Biol 18: 1208–1220 [DOI] [PMC free article] [PubMed] [Google Scholar]
- Tessé S, Bourbon HM, Debuchy R, Budin K, Dubois E, Liangran Z, Antoine R, Piolot T, Kleckner N, Zickler D (2017) Asy2/Mer2: an evolutionarily conserved mediator of meiotic recombination, pairing, and global chromosome compaction. Genes Dev 31: 1880–1893 [DOI] [PMC free article] [PubMed] [Google Scholar]
- Tock AJ, Henderson IR (2018) Hotspots for initiation of meiotic recombination. Front Genet 9: 521 [DOI] [PMC free article] [PubMed] [Google Scholar]
- Tully MD, Kieffer J, Brennich ME, Cohen Aberdam R, Florial JB, Hutin S, Oscarsson M, Beteva A, Popov A, Moussaoui D et al (2023) BioSAXS at European Synchrotron Radiation Facility ‐ extremely brilliant source: BM29 with an upgraded source, detector, robot, sample environment, data collection and analysis software. J Synchrotron Radiat 30: 258–266 [DOI] [PMC free article] [PubMed] [Google Scholar]
- Yadav VK, Claeys Bouuaert C (2021) Mechanism and control of meiotic DNA double‐Strand break formation in S. cerevisiae. Front Cell Dev Biol 9: 642737 [DOI] [PMC free article] [PubMed] [Google Scholar]