

Key Points
Question
Are long-term exposures to particulate air pollution from different emission sources associated with incident dementia?
Findings
In this nationally representative cohort study in the US, higher residential levels of fine particulate matter were associated with greater rates of incident dementia, especially for fine particulate matter generated by agriculture and wildfires.
Meaning
These findings support the hypothesis that airborne particulate matter pollution is associated with the likelihood of developing dementia and suggest that selective interventions to reduce pollution exposure may decrease the life-long risk of dementia; however, more research is needed to confirm these relationships.
This cohort study examines the associations between incident dementia and long-term fine particulate matter expressed as total mass and fine particulate matter from unique emission sources.
Abstract
Importance
Emerging evidence indicates that exposure to fine particulate matter (PM2.5) air pollution may increase dementia risk in older adults. Although this evidence suggests opportunities for intervention, little is known about the relative importance of PM2.5 from different emission sources.
Objective
To examine associations of long-term exposure of total and source-specific PM2.5 with incident dementia in older adults.
Design, Setting, and Participants
The Environmental Predictors of Cognitive Health and Aging study used biennial survey data from January 1, 1998, to December 31, 2016, for participants in the Health and Retirement Study, which is a nationally representative, population-based cohort study in the US. The present cohort study included all participants older than 50 years who were without dementia at baseline and had available exposure, outcome, and demographic data between 1998 and 2016 (N = 27 857). Analyses were performed from January 31 to May 1, 2022.
Exposures
The 10-year mean total PM2.5 and PM2.5 from 9 emission sources at participant residences for each month during follow-up using spatiotemporal and chemical transport models.
Main Outcomes and Measures
The main outcome was incident dementia as classified by a validated algorithm incorporating respondent-based cognitive testing and proxy respondent reports. Adjusted hazard ratios (HRs) were estimated for incident dementia per IQR of residential PM2.5 concentrations using time-varying, weighted Cox proportional hazards regression models with adjustment for the individual- and area-level risk factors.
Results
Among 27 857 participants (mean [SD] age, 61 [10] years; 15 747 [56.5%] female), 4105 (15%) developed dementia during a mean (SD) follow-up of 10.2 [5.6] years. Higher concentrations of total PM2.5 were associated with greater rates of incident dementia (HR, 1.08 per IQR; 95% CI, 1.01-1.17). In single pollutant models, PM2.5 from all sources, except dust, were associated with increased rates of dementia, with the strongest associations for agriculture, traffic, coal combustion, and wildfires. After control for PM2.5 from all other sources and copollutants, only PM2.5 from agriculture (HR, 1.13; 95% CI, 1.01-1.27) and wildfires (HR, 1.05; 95% CI, 1.02-1.08) were robustly associated with greater rates of dementia.
Conclusion and Relevance
In this cohort study, higher residential PM2.5 levels, especially from agriculture and wildfires, were associated with higher rates of incident dementia, providing further evidence supporting PM2.5 reduction as a population-based approach to promote healthy cognitive aging. These findings also indicate that intervening on key emission sources might have value, although more research is needed to confirm these findings.
Introduction
Fine particulate matter (PM2.5) air pollution has recently been recognized as a risk factor for dementia.1,2 Fine particulate matter may affect cognitive function via neuroinflammation as a result of systemic inflammation or oxidative stress following lung irritation.3,4 It has also been proposed that the smallest particles, often coated with neurotoxic chemicals,5,6 can enter the brain through the olfactory bulb or cross the blood-brain barrier.7,8 Unlike many other common risk factors for dementia (eg, hypertension, stroke, and diabetes), exposures to air pollution can be modified at the population level, making it a prime target for large-scale prevention efforts.
Notably, PM2.5 originates from many sources in the environment, including traffic, coal-fired power plants, agricultural emissions, and wildfires. Each source can emit PM2.5 with distinct physical and chemical characteristics. For example, components such as black carbon and nitrates are more common in PM2.5 from traffic-related sources, whereas ammonium is often in PM2.5 from agriculture.9 Although variations in emission sources are hypothesized to contribute to observed differences in associations across studies of PM2.5 and cognitive health,10 PM2.5 is typically quantified by the total mass. As a result, it remains unknown whether PM2.5 from all emission sources affects the brain similarly despite clear relevance for designing strategies to reduce PM2.5 pollution. In this study, we aimed to address this knowledge gap by estimating associations between incident dementia and long-term PM2.5 expressed as total mass and PM2.5 from 9 unique emission sources in a large cohort study in the US.
Methods
Study Population
The Environmental Predictors of Cognitive Health and Aging (EPOCH) cohort study used data from the Health and Retirement Study (HRS), a nationally representative cohort of older adults in the US. Since 1992, participants have been interviewed biennially about their cognition, overall health, and health behaviors until death or loss to follow-up.11 The HRS has replenished its sample every 6 years to account for the aging of the original cohort.12 All participants older than 50 years with at least 2 interviews between January 1, 1998, and December 31, 2016, were eligible for our study if they were free of dementia at their first interview during this period. For participants who were unable or unwilling to be interviewed, a proxy respondent (most often a spouse or child) completed the survey questions. These proxy interviews were intended to minimize informative loss during the follow-up period. As illustrated in eFigure 1 in Supplement 1, we excluded participants with missing exposure, outcome, or key covariates. The current study (EPOCH) and HRS were both approved by the University of Michigan Institutional Review Board. Written informed consent was obtained from all study participants. This study followed the Strengthening the Reporting of Observational Studies in Epidemiology (STROBE) reporting guideline.
Exposure Assessment
We used a spatiotemporal prediction model to estimate total PM2.5 at participants’ residential addresses.13 Briefly, this model leverages (1) measurements from the Environmental Protection Agency regulatory networks and several research studies; (2) more than 300 geographic covariates characterizing nearby transportation, land cover and use, population density, emission sources, and vegetation; and (3) spatial correlations to predict concentrations for each 2-week period at any location in the US between 1999 and 2016.14 Because monitoring data for PM2.5 before 2000 is limited, we used a simplified annual mean spatiotemporal model between 1990 and 1999.13,15 To account for potential confounding by other pollutants, we also estimated coarse particulate matter (PM10-2.5), nitrogen dioxide, and ozone concentrations using similar spatiotemporal models.16,17
We derived source-specific PM2.5 concentrations by multiplying the total PM2.5 concentration at each address by local fractions of PM2.5 attributable to each of 9 emission sources (ie, agriculture, road traffic, nonroad traffic, coal combustion for energy production, other energy production, coal combustion for industry, other industry, wildfires, and windblown dust). We provided detailed descriptions for each source in eAppendix 2 in Supplement 1. These fractions were generated at a resolution of 0.5° × 0.625° by serially running an atmospheric chemistry-transport model (GEOS-Chem) with all sources but 1 to isolate the unique contribution of that source to the total PM2.5 mixture (eAppendix 1 in Supplement 1).18 We evaluated all other sources as part of total PM2.5 owing to lower confidence levels in the quality of underlying emission data. Although these data were generated using data from 2017, we assume that these estimates are reliable estimates of source contributions during the past decade, because primary PM2.5 emissions as reported in the National Emissions Inventory in 2017 were strongly correlated with 10-year mean emissions from 2007 to 2017 for most sources (R2 = 0.76) (eFigure 2 in Supplement 1) and the rank order was largely stable over time (eFigure 3 in Supplement 1).19 We assigned concentrations of all pollutants during the 10-year period before each follow-up assessment using participants’ residential histories.
Dementia Classification
The HRS has conducted cognitive assessments biennially since 1998. For self-respondents, assessments included immediate and delayed word recall, serial sevens subtraction, and counting backward tests. For proxy respondents, the cognitive assessment included questions about the participant’s memory and instrumental activities of daily living limitations, as well as an interviewer assessment of the participant’s cognitive impairment.20
We defined dementia using the Langa-Weir algorithm,20 which has calibrated the HRS responses to assessments of clinically diagnosed dementia in a substudy.21 The algorithm classifies respondents as having dementia if their cognitive test scores are 6 or less of 27 points or proxy-respondent scores are 6 to 11 of 11 points.20
Covariates
Detailed information about personal characteristics was collected during all study interviews. We also used the residential location to estimate urbanicity based on the Beale Rural-Urban Continuum22 and neighborhood socioeconomic status (NSES). The NSES was defined using 11 US Census variables, with higher levels indicating locations with lower SES.23
Statistical Analysis
We used a time-dependent Cox proportional hazards regression model to estimate associations of total and source-specific PM2.5 with incident dementia. Confounding by time was an important consideration, because (1) air pollution concentrations follow secular trends (eFigure 4 in Supplement 1),24 (2) age is a strong determinant of dementia risk, (3) the HRS recruited from a wide range of birth cohorts, and (4) there are observed trends in dementia that may be due to causes other than air pollution.25 Therefore, we used calendar dates as our time axis and further stratified our models by 2-year birth cohorts and age at recruitment. Given the stratified, multistage sample design, we applied the HRS person-level sampling weights and accounted for geographic stratification and clustering.26 Finally, we verified the proportional hazards assumption for all variables in the Cox models using scaled Schoenfeld residuals.
In our primary models, we adjusted for potential confounders beyond age and time by including terms for sex, race and ethnicity (non-Hispanic Black, Hispanic, non-Hispanic White, and people of other races [ie, American Indian, Alaska Native, Asian, and Pacific Islander] for whom the sample size was insufficient to analyze individually), educational attainment (less than high school, general equivalency diploma, high school graduate, some college, and college and above), ownership of the primary residence, and total household wealth, which was adjusted by fitting natural spline with 5 df. We also adjusted for urbanicity and NSES based on participants’ residential histories. We similarly incorporated a flexible set of unpenalized thin-plate regression splines with 10 df to adjust for additional potential differences in place.27,28 We did not adjust for health status indicators (eg, hypertension and stroke) because these may be causal intermediates.
Our analysis first focused on single-pollutant models (model 1). Then we modeled associations of PM2.5 from each source adjusted for the sum of PM2.5 from all other sources (model 2) and other copollutants (model 3). We reported hazard ratios (HRs) per interquartile range (IQR) to reflect differences across the observed ranges in concentrations and 1 μg/m3 to reflect toxicity for a unit change. We further examined whether associations with PM2.5 varied by sex, race or ethnicity, and baseline age (<75 vs ≥75 years) using interaction terms and then fitted penalized spline for each PM2.5 in our single-pollutant models to account for the possible nonlinear association between PM2.5 and incident dementia. With our observed HRs in model 1, we then estimated the burden of incident dementia attributable to total PM2.5 for the US population in 2015 following a global burden of disease comparative risk assessment framework (eAppendix 3 in Supplement 1).29 Additionally, we evaluated the association of incident dementia with other pollutants and the sum of PM2.5 from sources that have not been included as source-specific ones.
In sensitivity analyses, we examined associations using different mean exposure periods (1 year and 5 years), using dementia identified by other algorithms as outcome30 and restricting our analyses to the nonmovers during the follow-up. Given that our assumption of temporal stability of source contribution is particularly strong for wildfires,31 we additionally evaluated satellite-based estimates for wildfire-derived PM2.5 from 2006 to 2016. Then we further tested our adjustment for SES by excluding or including the SES indicators in the models, including a binary indicator of agriculture-related occupation as a surrogate for exposure to neurotoxic pesticides.32 Last, to examine the impact of potential selective attrition, we computed inverse probability-of-attrition weights for each observation and accounted for these weights in our models.33 Data analysis was performed from January 31 to May 1, 2022.
Results
A total of 27 857 individuals (mean [SD] age, 61 [10] years; 15 747 [56.5%] female and 12 110 [43.5%] male; 3164 [11.4%] Hispanic, 4654 [16.7%] non-Hispanic Black, 19 249 [69.1%] non-Hispanic White, and 790 [2.8%] people of other races, including Asian, American Indian, Alaska Native, and Pacific Islander) participated in the study (Table). We identified 4105 incident dementia cases during the mean (SD) follow-up of 10.2 (5.6) years. Compared with those who did not develop dementia, participants with incident dementia were more likely to have a race other than White, have less formal education, have less wealth, and have higher ambient PM2.5 levels at their address.
Table. Characteristics of the Study Population, Overall and by Incident Dementia Status During Follow-Up From 1998 to 2016a.
| Characteristic | All (N = 27 857) | Dementia free during follow-up (n = 23 752) | Incident dementia during follow-up (n = 4105) |
|---|---|---|---|
| Follow-up time, mean (SD), y | 10.2 (5.6) | 10.5 (5.6) | 8.3 (5.1) |
| Age at baseline, mean (SD), y | 61 (10) | 60 (9) | 68 (10) |
| Sex | |||
| Female | 15 747 (56.5) | 13 236 (55.7) | 2511 (61.2) |
| Male | 12 110 (43.5) | 10 516 (44.3) | 1594 (38.8) |
| Race and ethnicity | |||
| Hispanic | 3164 (11.4) | 2589 (10.9) | 575 (14.0) |
| Non-Hispanic Black | 4654 (16.7) | 3756 (15.8) | 898 (21.9) |
| Non-Hispanic White | 19 249 (69.1) | 16 710 (70.4) | 2539 (61.9) |
| Otherb | 790 (2.8) | 697 (2.9) | 93 (2.3) |
| Educational attainment | |||
| Less than high school | 5825 (20.9) | 4045 (17.0) | 1780 (43.4) |
| GED | 1369 (4.9) | 1175 (4.9) | 194 (4.7) |
| High school | 8278 (29.7) | 7144 (30.1) | 1134 (27.6) |
| Some college | 6561 (23.6) | 5972 (25.1) | 589 (14.3) |
| College and above | 5824 (20.9) | 5416 (22.8) | 408 (9.9) |
| Own primary residence | 21 572 (77.4) | 18 649 (78.5) | 2923 (71.2) |
| Baseline total wealth without primary residence, mean (SD), $ | 242 012 (1 010 704) | 256 381 (1 074 788) | 158 873 (490 124) |
| NSES, mean (SD)c | 0.23 (0.92) | 0.20 (0.93) | 0.40 (0.88) |
| Urbanicity | |||
| Urban | 14 475 (52.0) | 12 503 (52.6) | 1972 (48.0) |
| Suburban | 6028 (21.6) | 5108 (21.5) | 920 (22.4) |
| Exurban | 6201 (22.3) | 5218 (22.0) | 983 (23.9) |
| Region | |||
| Northeast | 4631 (16.6) | 3942 (16.6) | 689 (16.8) |
| Midwest | 6493 (23.3) | 5595 (23.6) | 898 (21.9) |
| South | 11 203 (40.2) | 9398 (39.6) | 1805 (44.0) |
| West | 5530 (19.9) | 4817 (20.3) | 713 (17.4) |
| 10-Year air pollutants during follow-up, median (IQR) | |||
| Total PM2.5, μg/m3 | 11.2 (9.5-13.2) | 11.1 (9.4-13.1) | 12.2 (10.4-14.3) |
| Agriculture | 1.1 (0.6-1.7) | 1.1 (0.6-1.7) | 1.2 (0.7-1.8) |
| Road traffic | 1.4 (1.1-1.7) | 1.4 (1.1-1.7) | 1.6 (1.2-1.8) |
| Nonroad traffic | 0.4 (0.3-0.5) | 0.4 (0.2-0.5) | 0.4 (0.3-0.6) |
| Energy generation (coal) | 0.8 (0.5-1.1) | 0.8 (0.5-1.1) | 0.9 (0.6-1.2) |
| Energy generation (other) | 0.6 (0.4-0.7) | 0.5 (0.4-0.7) | 0.6 (0.5-0.7) |
| Industry (coal) | 0.2 (0.2-0.3) | 0.2 (0.2-0.3) | 0.2 (0.2-0.3) |
| Industry (other) | 0.9 (0.7-1.2) | 0.9 (0.7-1.2) | 1.0 (0.8-1.3) |
| Wildfires | 1.0 (0.7-1.3) | 1.0 (0.7-1.3) | 1.1 (0.8-1.4) |
| Windblown dust | 0.1 (0.0-0.1) | 0.1 (0.0-0.1) | 0.1 (0.0-0.2) |
| Coarse PM, μg/m3 | 8.9 (6.8-11.6) | 8.9 (6.8-11.6) | 9.0 (6.8-11.6) |
| Nitrogen dioxide, ppb | 9.0 (6.0-13.7) | 8.9 (5.9-13.5) | 10.2 (6.7-15.6) |
| Ozone, ppb | 27.0 (24.8-28.6) | 27.1 (24.9-28.7) | 26.6 (24.1-28.3) |
Abbreviations NSES, neighborhood socioeconomic status; PM2.5, fine particulate matter; ppb, parts per billion.
Data are reported as number (percentage) of study participants unless otherwise indicated.
Other includes American Indian, Alaska Native, Asian, and Pacific Islander.
The 11 variables used to derive the NSES included (1) income-related variables (ie, median household income, the percentage of households living under the poverty level, the percentage of households receiving public assistance, and the percentage of single-parent families), (2) wealth-related variables (ie, the percentage of households that own their home, the percentage of households that receive interest, dividend, or rental income, and the median value of owner-occupied homes), (3) education-related variables (ie, the percentage of persons with at least a high school degree and the percentage with at least a bachelor’s degree), and (4) occupation-related variables (ie, the percentage unemployed and the percentage with a nonmanagerial occupation).
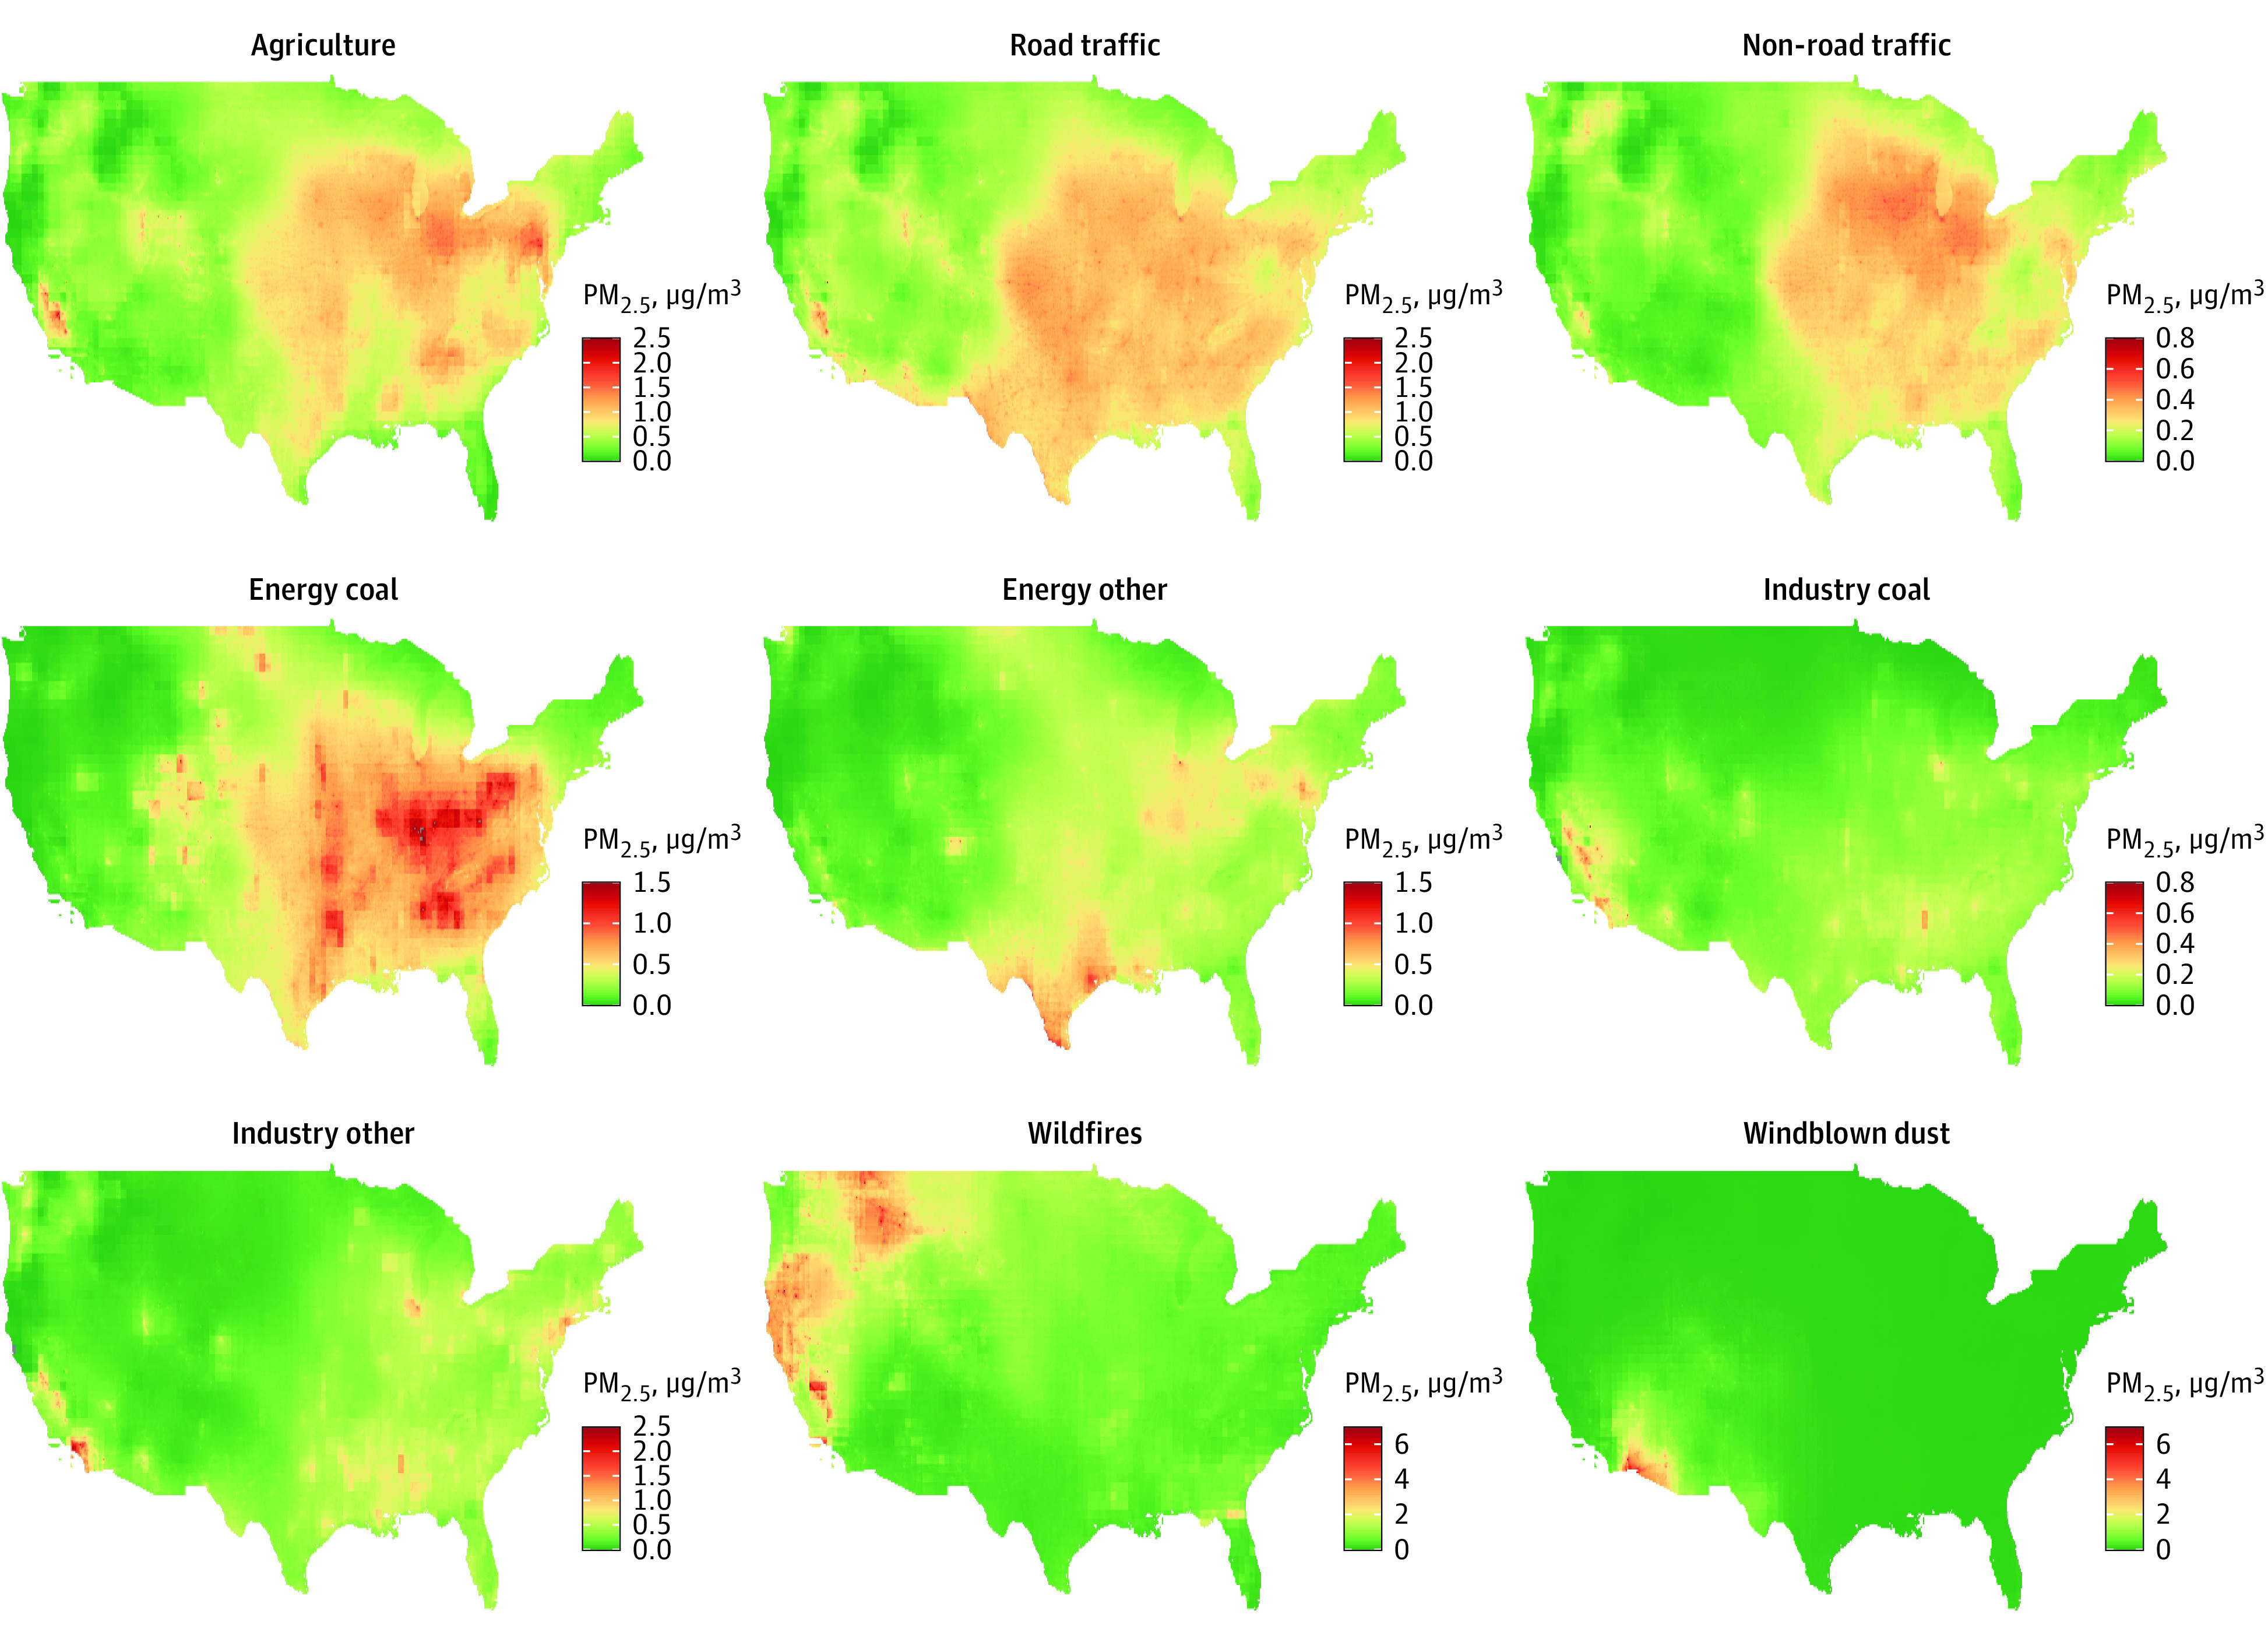
The median (IQR) 10-year total PM2.5 concentration during the follow-up was 11.2 (9.5-13.2) μg/m3. PM2.5 from agriculture, traffic, energy production, and other industry sectors varied by region, with generally higher concentrations in the Midwest and lower concentrations in the West (Figure 1). Fine particulate matter from wildfires and windblown dust was mainly concentrated in the West and Southwest, respectively. Relatively high correlations were observed among PM2.5 from agriculture, road traffic, and nonroad traffic as well as among industry-related coal combustion and other industrial sources (Pearson r > 0.8) (eTable 1 in Supplement 1). Concentrations of PM2.5 were higher for those who were older, were non-Hispanic Black, had less formal education, and had less wealth except for PM2.5 from wildfires and windblown dust (eTable 2 in Supplement 1).
Figure 1. The Spatial Distribution of Source-Specific Fine Particulate Matter (PM2.5) Across the US in 2017.
Associations of PM2.5 With Dementia
In single-pollutant models, we observed an 8% (HR, 1.08 per IQR; 95% CI, 1.01-1.17) increase in the hazard rates of incident dementia per IQR of total PM2.5 averaged during the previous 10 years (Figure 2). Dementia HRs for IQRs of PM2.5 from the 9 sources ranged from 1.00 (95% CI, 0.99-1.01) for windblown dust to 1.17 (95% CI, 1.05-1.30) for agriculture (Figure 2). The largest HRs per IQR (≥1.1) were for PM2.5 from agriculture, road traffic, and nonroad traffic, whereas HRs were modest (HRs of approximately 1.05) for PM2.5 from wildfires and coal combustion for energy production and industry. We observed weak, imprecise, or no associations for PM2.5 from noncoal energy production and industry as well as windblown dust. For a 1-μg/m3 scalar (eTable 3 in Supplement 1), the HRs for PM2.5 were largest for coal combustion for industry and traffic sources followed by agriculture, energy production, and wildfires.
Figure 2. Hazard Ratios (95% CIs) of Incident Dementia in the Health and Retirement Study (1998-2016) Associated With Interquartile Differences in 10-Year Mean Concentrations of Source-Specific Fine Particulate Matter (PM2.5) in Single Pollutant and Multipollutant Models.

The IQRs for each total and source-specific PM2.5 with concentrations are given in parentheses in micrograms per cubic meter. Model 1 is the single-pollutant model, stratified by 2-year birth cohorts and 2-year age at baseline and adjusted for sex, race, educational attainment, ownership of the primary residence, total household wealth, urbanicity, neighborhood socioeconomic status, and a flexible set of unpenalized thin-plate regression splines with 10 df. Model 2 is model 1 plus other PM2.5. Model 3 is model 2 plus coarse PM, nitrogen dioxide, and ozone.
In models adjusted for all other PM2.5 and copollutants, our findings remained qualitatively similar for PM2.5 from agriculture, road traffic, nonroad traffic, coal combustion for energy production, and wildfires, although the magnitudes of the associations were generally weaker or less precise than single-pollutant models (Figure 2). After adjustment for other pollutants, only the association with PM2.5 from agriculture (HR, 1.13; 95% CI, 1.01-1.27) and fires (HR, 1.05; 95% CI, 1.02-1.08) remained strong and statistically different from no association. We did not observe any significant association of incident dementia with the sum of PM2.5 from sources that have not been included as source-specific ones. For pollutants other than PM2.5 (eFigure 5 in Supplement 1), we found evidence of positive associations of PM10-2.5 and nitrogen dioxide in single-pollutant models, although these associations were imprecise and could not be distinguished from no association.
In our secondary analyses, we estimated that nearly 188 000 new cases per year of dementia were attributable to total PM2.5 exposure in the US if these associations were causal. We did not find strong evidence of effect modification of the observed associations, although associations were generally stronger among men, non-Hispanic White people, and those younger than 75 years at our baseline examination (eFigures 6-8 in Supplement 1).
In sensitivity analyses, we observed nearly linear associations for PM2.5 emitted from agriculture, road traffic, nonroad traffic, industry coal, and wildfires, except for low or rarely occurring concentrations (eFigure 9 in Supplement 1). We also found that the associations were relatively robust to the use of different exposure periods, although slightly larger and/or more precise for the primary 10-year mean period (eTable 4 in Supplement 1), use of different algorithms to classify dementia, adjustment for NSES indicators (eTable 5 in Supplement 1), and use of the inverse probability-of-attrition weights. In addition, associations remained robust when we restricted our analyses to nonmovers (eTable 6 in Supplement 1). Moreover, the associations with time-varying PM2.5 from wildfires were similarly consistent with our main analysis (eTable 7 in Supplement 1).
Discussion
In this nationally representative cohort study in the US, we found that higher long-term exposure to total PM2.5 was associated with a greater risk of incident dementia. The strength of the observed associations differed across emission sources, with the strongest and most robust associations for PM2.5 from agriculture and wildfires. Road traffic, nonroad traffic, and coal combustion for energy and industry were also associated with incident dementia, although these results were sensitive to adjustment for PM2.5 from other sources. According to our estimation, nearly 188 000 new cases per year of dementia were attributable to total PM2.5 exposure in the US, suggesting that reducing PM2.5 through actions such as regulations, technological advances, or use of personal air purifiers may promote healthy cognitive aging. Our data further indicate that intervening on key emission sources might have value, although we cannot conclude causality, and more research is needed to confirm these findings.
Overall, our findings agree with the accumulated evidence on the association between total PM2.5 and incident dementia.34,35,36 When results were scaled to 1 μg/m3, we observed a 2% increased rate of dementia for total PM2.5, which is consistent with the overall HR of dementia reported by a recently published meta-analysis among 51 studies identified from 2080 records.37 Our results are also comparable with 2 other studies of national cohorts in the US,34,36 including 1 of more than 12 million US Medicare beneficiaries (aged ≥65 years).36 This finding is particularly notable given that our individual-level exposure estimates and standardized dementia classifications should have less measurement error than the zip code–level exposure estimates and administrative outcomes used in the Medicare beneficiaries study.
This study extends the literature by newly examining associations of incident dementia with PM2.5 from key emission sources rather than just total PM2.5 mass. Despite the clear implications for pollution reduction policies, to our knowledge, only 1 other study has investigated the association of PM2.5 from individual emission sources with dementia.38 That investigation focused on PM2.5 from traffic and residential wood burning in a Swedish cohort. As with our single-pollutant models, they found that higher PM2.5 concentrations from both sources were associated with increased hazards of dementia. However, that study did not test whether the findings were robust to the adjustment of other PM2.5, whereas we found blunt associations with traffic-related PM2.5 and nitrogen dioxide, a marker of traffic. The association for wildfires was stronger in the Swedish cohort than what we observed. This finding may not be surprising, however, because personal exposures to residential wood burning are more proximal than smoke from wildfires in the outdoor environment. Interestingly, although the Medicare cohort study39 did not evaluate PM2.5 from agriculture specifically, it did report evidence for an association of ammonium with dementia, which could reflect emissions from agriculture. That study also reported a robust association with dementia for sulfate, an indicator for PM2.5 from fossil fuel combustion. Although our findings did not support this link, a handful of studies9,40,41 found associations of cardiovascular disease–related outcomes with coal-generated PM2.5 and PM2.5 metals. Even though we observed more variability in emissions from energy production over time compared with most other sources, we do not suspect that this is the sole cause of our null association given the high correlation (R2 = 0.76) between 2017 estimates and the 10-year mean.
In this cohort, PM2.5 from agriculture and wildfires was most strongly and robustly associated with dementia when scaled to an IQR, which considers both the hazards and range of concentrations observed across the cohort. Agriculture is a notable source of the PM2.5 precursor, ammonia, which accounts for the formation of 30% of PM2.5 in the US.42 The common application of neurotoxic pesticides or herbicides in agriculture43,44,45 could also plausibly explain observed associations between PM2.5 from agriculture and dementia. Similarly, in addition to producing high levels of PM2.5, wildfires release components that are likely to be highly toxic because they incinerate natural and synthetic materials in an uncontrolled manner. Furthermore, although individual wildfires may be short-lived, they have become more frequent and destructive in the past decades because of warmer temperatures, earlier spring snowmelt, and longer fire seasons.46 Additionally, although the precise locational origin of wildfires may vary, the long-range smoke from wildfires frequently impacts the same downwind locations, resulting in wildfire smoke becoming a more long-term presence; many US cities now experience more than 30 days affected by smoke each year.47 Wildfires have been estimated to contribute up to 25% of the annual mean PM2.5 across the US and up to 50% in some Western regions.48,49 Despite reported adverse associations with cardiovascular diseases, mental health disorders, and all-cause mortality,50,51,52,53,54 little is known of the effects of wildfire smoke on the brain, although 1 study observed associations between short-term levels of wildfire-related PM2.5 and decreased cognitive functioning using game app data.55 Additionally, because rural participants may breathe more PM2.5 emitted from agriculture and wildfires, our observed associations with agriculture and wildfires may provide a possible explanation for the persistent rural-urban disparities previously observed in dementia risk among HRS participants.56
Our finding that the association with PM2.5 from road traffic was sensitive to adjustment for PM2.5 from other sources was interesting considering that traffic-related air pollution has been consistently linked to adverse health.57,58,59 One possible explanation is that the low spatial resolution of our source data only captures regional traffic emissions rather than highly localized gradients.60 If fresh rather than aged traffic particles are more important, then our models would not capture those influences. Notably, however, the association with nitrogen dioxide predicted with the fine-scale resolution was also blunted by the adjustment of total PM2.5.
Strengths and Limitations
One important strength of this work is our investigation of PM2.5 from both traditionally recognized and more novel sources, including agriculture and wildfires. In addition, instead of using chemical components as tracers for specific sources,39,61,62 which can often have a lack of specificity, we isolated source-specific PM2.5 by removing each source individually from a chemical-transport dispersion model. This approach is beneficial because it accounts for both the primary and secondary pollutants that would be generated by that source. Other strengths of this work include the nationally representative cohort that used validated and standardized methods to assess dementia status during 18 years of follow-up. This approach captures populations from rural and urban areas and reduces potential differential misclassification due to detection bias.63 Similarly, the use of proxy respondents and survey weights minimizes selection bias due to attrition. Finally, we had detailed individual and area-level information on other risk factors for dementia, including key copollutants, that could confound our associations.
Despite these advantages, our study has some limitations. First, different from our fine estimates of the total PM2.5 from the spatiotemporal model, the temporal resolution of the PM2.5 source contributions derived from the GEOS-Chem model was relatively crude, so we had to assume stability across the duration of our study period. Notably, however, we verified that there was high temporal stability of source contributions during the past decade even for less predictable sources (eg, wildfires). Our findings for wildfires were robust to the use of time-varying data. Second, the crude spatial resolution of our emissions data also prevented us from capturing the impacts of highly localized sources (eg, traffic), although our findings for traffic were consistent with those for nitrogen dioxide, a marker of traffic that was estimated at the individual level. Third, the relatively high correlations among different sources raise the possibility that differential measurement error may interfere with our ability to confidently disentangle the effects of single sources. As with all observational studies, we cannot completely rule out the possibility that our observed associations are attributable to unmeasured confounding or selection bias. However, our findings were robust to adjustment of a variety of known NSES indicators across individual and area levels (eTable 5 in Supplement 1). Our results could also be underestimated by “healthy survivor” bias because those with comorbidities associated with both air pollution and dementia may be more likely to be lost to follow-up. The use of proxies and sampling weights should minimize this bias, although larger associations found for younger participants could indicate this healthy selection bias among the older study participants as has also been seen in previous studies.36,64
Conclusions
With the rapid aging of the global population and marked increases in the mean life expectancy around the world, the prevention of dementia has become increasingly important. Our cohort study suggests that reducing PM2.5 and perhaps selectively targeting certain sources for policy interventions might be effective strategies to reduce the burden of dementia at the population level, although more research is needed to confirm our findings.
eAppendix 1. Steps for Derivation of Sources-Specific PM2.5
eAppendix 2. Description of Nine Emission Sources
eAppendix 3. Estimation of the Burden of Incident Dementia Attributable to Total PM2.5 for the US Population in 2015
eFigure 1. Schematic Flowchart of the Study Population Selection
eFigure 2. Correlations Between Primary Source-Specific PM2.5 Emissions From 2017 and 10-Year Average Primary Source-Specific PM2.5 Emissions From 2007-2017 for Each State in the United States
eFigure 3. Difference in the Rank of States by Source-Specific Primary PM2.5 Emissions Between 2017 and the Average Over the 10 Years Before 2017 in the United States
eFigure 4. 10-year Average Concentrations of Total PM2.5 by Biennial HRS Wave
eFigure 5. Hazard Ratios (95% Confidence Intervals) of Incident Dementia in the Health and Retirement Study (1998-2016) Associated With Interquartile Differences in 10-Year Average Concentrations of Pollutants Beyond PM2.5 in Single and Multipollutant Models
eFigure 6. Hazard Ratios (95% Confidence Intervals) of Incident Dementia in the Health and Retirement Study (1998-2016) Associated With Interquartile Differences in 10-Year Average Concentrations of Source-Specific PM2.5 in Single Pollutant Models by Sex
eFigure 7. Hazard Ratios (95% Confidence Intervals) of Incident Dementia in the Health and Retirement Study (1998-2016) Associated With Interquartile Differences in 10-Year Average Concentrations of Source-Specific PM2.5 in Single Pollutant Models by Race/Ethnicity
eFigure 8. Hazard Ratios (95% Confidence Intervals) of Incident Dementia in the Health and Retirement Study (1998-2016) Associated With Interquartile Differences in 10-Year Average Concentrations of Source-Specific PM2.5 in Single Pollutant Models by Baseline Age.
eFigure 9. The Concentration–Response Curves for Each Total and Source-Specific PM2.5 With Incident Dementia Derived From the Single-Pollutant Models, Adjusted for 2-Year Birth Cohorts, 2-Year Age at Baseline, Sex, Race, Educational Attainment, Ownership of the Primary Residence, Total Household Wealth, Urbanicity, NSES and a Flexible Set of Unpenalized Thin-Plate Regression Splines With 10 df
eTable 1. Correlations Among 10-Year Average Air Pollutants for Participants of the Health and Retirement Study (1998-2016)
eTable 2. The Median (IQR) Concentrations of Air Pollutants Within Each Category of the Baseline Characteristics of Our Study Population During Follow-Up From 1998 to 2016
eTable 3. Hazard Ratios (95% Confidence Intervals) of Incident Dementia in the Health and Retirement Study (1998-2016) per 1-μg/m3 Increment in 10-Year Average Concentrations of Source-Specific PM2.5 in Single- and Multi-Pollutant Models
eTable 4. Hazard Ratios (95% Confidence Intervals) of Incident Dementia in the Health and Retirement Study (1998-2016) Associated With Interquartile Differences in Source-Specific PM2.5 Concentrations in Single Pollutant Models With Different Exposure Averaging Periods
eTable 5. Hazard Ratios (95% Confidence Intervals) of Incident Dementia in the Health and Retirement Study Associated With Interquartile Differences in 10-Year Average Concentrations of Total and Source-Specific PM2.5 When Excluding or Including the SES Indicators in Single-Pollutant Models
eTable 6. Hazard Ratios (95% Confidence Intervals) of Incident Dementia in the Health and Retirement Study Associated With Interquartile Differences in 10-Year Average Concentrations of Source-Specific PM2.5 in Single-Pollutant Models When Limiting to Non-Movers
eTable 7. Hazard Ratios (95% Confidence Intervals) of Incident Dementia in the Health and Retirement Study Associated With Interquartile Differences in Average Concentrations of PM2.5 From Wildfires Estimated With Time-Fixed Emission Data (Primary) and Wildfires Estimated With Time-Varying Emission Data (2006 to 2016) With Different Average Periods and Baseline
eReferences.
Data Sharing Statement
References
- 1.Livingston G, Huntley J, Sommerlad A, et al. Dementia prevention, intervention, and care: 2020 report of the Lancet Commission. Lancet. 2020;396(10248):413-446. doi: 10.1016/S0140-6736(20)30367-6 [DOI] [PMC free article] [PubMed] [Google Scholar]
- 2.US Environmental Protection Agency . Integrated Science Assessment (ISA) for Particulate Matter (Final Report, December 2019). Accessed June 30, 2023. https://cfpub.epa.gov/ncea/isa/recordisplay.cfm?deid=347534
- 3.Clifford A, Lang L, Chen R, Anstey KJ, Seaton A. Exposure to air pollution and cognitive functioning across the life course: a systematic literature review. Environ Res. 2016;147:383-398. doi: 10.1016/j.envres.2016.01.018 [DOI] [PubMed] [Google Scholar]
- 4.Simard AR, Rivest S. Neuroprotective properties of the innate immune system and bone marrow stem cells in Alzheimer’s disease. Mol Psychiatry. 2006;11(4):327-335. doi: 10.1038/sj.mp.4001809 [DOI] [PubMed] [Google Scholar]
- 5.Lai W, Li S, Li Y, Tian X. Air pollution and cognitive functions: evidence from straw burning in China. Am J Agric Econ. 2022;104(1):190-208. doi: 10.1111/ajae.12225 [DOI] [Google Scholar]
- 6.Scieszka D, Hunter R, Begay J, et al. Neuroinflammatory and neurometabolic consequences from inhaled wildfire smoke-derived particulate matter in the western United States. Toxicol Sci. 2022;186(1):149-162. doi: 10.1093/toxsci/kfab147 [DOI] [PMC free article] [PubMed] [Google Scholar]
- 7.Lucchini RG, Dorman DC, Elder A, Veronesi B. Neurological impacts from inhalation of pollutants and the nose-brain connection. Neurotoxicology. 2012;33(4):838-841. doi: 10.1016/j.neuro.2011.12.001 [DOI] [PMC free article] [PubMed] [Google Scholar]
- 8.González-Maciel A, Reynoso-Robles R, Torres-Jardón R, Mukherjee PS, Calderón-Garcidueñas L. Combustion-derived nanoparticles in key brain target cells and organelles in young urbanites: culprit hidden in plain sight in Alzheimer’s disease development. J Alzheimers Dis. 2017;59(1):189-208. doi: 10.3233/JAD-170012 [DOI] [PubMed] [Google Scholar]
- 9.Kazemiparkouhi F, Honda T, Eum K-D, Wang B, Manjourides J, Suh HH. The impact of Long-Term PM2.5 constituents and their sources on specific causes of death in a US Medicare cohort. Environ Int. 2022;159:106988. doi: 10.1016/j.envint.2021.106988 [DOI] [PubMed] [Google Scholar]
- 10.Kioumourtzoglou M-A, Austin E, Koutrakis P, Dominici F, Schwartz J, Zanobetti A. PM2.5 and survival among older adults: effect modification by particulate composition. Epidemiology. 2015;26(3):321-327. doi: 10.1097/EDE.0000000000000269 [DOI] [PMC free article] [PubMed] [Google Scholar]
- 11.Fisher GG, Ryan LH. Overview of the health and retirement study and introduction to the special issue. Work Aging Retire. 2018;4(1):1-9. doi: 10.1093/workar/wax032 [DOI] [PMC free article] [PubMed] [Google Scholar]
- 12.Sonnega A, Faul JD, Ofstedal MB, Langa KM, Phillips JWR, Weir DR. Cohort profile: the health and retirement study (HRS). Int J Epidemiol. 2014;43(2):576-585. doi: 10.1093/ije/dyu067 [DOI] [PMC free article] [PubMed] [Google Scholar]
- 13.Kirwa K, Szpiro AA, Sheppard L, et al. Fine-scale air pollution models for epidemiologic research: insights from approaches developed in the Multi-ethnic Study of Atherosclerosis and Air Pollution (MESA Air). Curr Environ Health Rep. 2021;8(2):113-126. doi: 10.1007/s40572-021-00310-y [DOI] [PMC free article] [PubMed] [Google Scholar]
- 14.Keller JP, Olives C, Kim S-Y, et al. A unified spatiotemporal modeling approach for predicting concentrations of multiple air pollutants in the multi-ethnic study of atherosclerosis and air pollution. Environ Health Perspect. 2015;123(4):301-309. doi: 10.1289/ehp.1408145 [DOI] [PMC free article] [PubMed] [Google Scholar]
- 15.Kim S-Y, Olives C, Sheppard L, et al. Historical prediction modeling approach for estimating long-term concentrations of PM2.5 in cohort studies before the 1999 implementation of widespread monitoring. Environ Health Perspect. 2017;125(1):38-46. doi: 10.1289/EHP131 [DOI] [PMC free article] [PubMed] [Google Scholar]
- 16.Wang M, Sampson PD, Bechle M, Marshall J, Vedal S, Kaufman JD. National PM2.5 and NO2 spatiotemporal models integrating intensive monitoring data and satellite-derived land use regression in a universal kriging framework in the United States: 1999-2016. Accessed June 30, 2023. https://ehp.niehs.nih.gov/doi/abs/10.1289/isesisee.2018.O02.02.02
- 17.Wang M, Sampson PD, Hu J, et al. Combining land-use regression and chemical transport modeling in a spatiotemporal geostatistical model for ozone and PM2.5. Environ Sci Technol. 2016;50(10):5111-5118. doi: 10.1021/acs.est.5b06001 [DOI] [PMC free article] [PubMed] [Google Scholar]
- 18.McDuffie EE, Martin RV, Spadaro JV, et al. Source sector and fuel contributions to ambient PM2.5 and attributable mortality across multiple spatial scales. Nat Commun. 2021;12(1):3594. doi: 10.1038/s41467-021-23853-y [DOI] [PMC free article] [PubMed] [Google Scholar]
- 19.US Environmental Protection Agency. Air Pollutant Emissions Trends Data. Published 2022. Accessed April 12, 2023. https://www.epa.gov/air-emissions-inventories/air-pollutant-emissions-trends-data
- 20.Langa KM. Langa-Weir Classification of Cognitive Function (1995 Onward). Survey Research Center Institute for Social Research, University of Michigan; 2020.
- 21.Crimmins EM, Kim JK, Langa KM, Weir DR. Assessment of cognition using surveys and neuropsychological assessment: the Health and Retirement Study and the Aging, Demographics, and Memory Study. J Gerontol B Psychol Sci Soc Sci. 2011;66(suppl 1):i162-i171. doi: 10.1093/geronb/gbr048 [DOI] [PMC free article] [PubMed] [Google Scholar]
- 22.USDA Economic Research Service. Rural-Urban Continuum Codes. Updated December 10, 2020. Accessed July 14, 2023. https://www.ers.usda.gov/data-products/rural-urban-continuum-codes
- 23.Hajat A, Diez-Roux AV, Adar SD, et al. Air pollution and individual and neighborhood socioeconomic status: evidence from the Multi-Ethnic Study of Atherosclerosis (MESA). Environ Health Perspect. 2013;121(11-12):1325-1333. doi: 10.1289/ehp.1206337 [DOI] [PMC free article] [PubMed] [Google Scholar]
- 24.Adar SD, Chen Y-H, D’Souza JC, et al. Longitudinal analysis of long-term air pollution levels and blood pressure: a cautionary tale from the multi-ethnic study of atherosclerosis. Environ Health Perspect. 2018;126(10):107003. doi: 10.1289/EHP2966 [DOI] [PMC free article] [PubMed] [Google Scholar]
- 25.Power MC, Bennett EE, Turner RW, et al. Trends in relative incidence and prevalence of dementia across non-Hispanic Black and White individuals in the United States, 2000-2016. JAMA Neurol. 2021;78(3):275-284. doi: 10.1001/jamaneurol.2020.4471 [DOI] [PMC free article] [PubMed] [Google Scholar]
- 26.Health and Retirement Study. Sample sizes and response rates. Survey Research Center, Institute for Social Research, University of Michigan. April 2017. Accessed June 26, 2023. https://hrs.isr.umich.edu/publications/biblio/9042 [Google Scholar]
- 27.Keller JP, Szpiro AA. Selecting a scale for spatial confounding adjustment. J R Stat Soc Ser A Stat Soc. 2020;183(3):1121-1143. doi: 10.1111/rssa.12556 [DOI] [PMC free article] [PubMed] [Google Scholar]
- 28.Chan SH, Van Hee VC, Bergen S, et al. Long-term air pollution exposure and blood pressure in the sister study. Environ Health Perspect. 2015;123(10):951-958. doi: 10.1289/ehp.1408125 [DOI] [PMC free article] [PubMed] [Google Scholar]
- 29.Murray CJL, Aravkin AY, Zheng P, et al. ; GBD 2019 Risk Factors Collaborators . Global burden of 87 risk factors in 204 countries and territories, 1990-2019: a systematic analysis for the Global Burden of Disease Study 2019. Lancet. 2020;396(10258):1223-1249. doi: 10.1016/S0140-6736(20)30752-2 [DOI] [PMC free article] [PubMed] [Google Scholar]
- 30.Gianattasio KZ, Wu Q, Glymour MM, Power MC. Comparison of methods for algorithmic classification of dementia status in the Health and Retirement Study. Epidemiology. 2019;30(2):291-302. doi: 10.1097/EDE.0000000000000945 [DOI] [PMC free article] [PubMed] [Google Scholar]
- 31.McClure CD, Jaffe DA. US particulate matter air quality improves except in wildfire-prone areas. Proc Natl Acad Sci U S A. 2018;115(31):7901-7906. doi: 10.1073/pnas.1804353115 [DOI] [PMC free article] [PubMed] [Google Scholar]
- 32.Aloizou A-M, Siokas V, Vogiatzi C, et al. Pesticides, cognitive functions and dementia: a review. Toxicol Lett. 2020;326:31-51. doi: 10.1016/j.toxlet.2020.03.005 [DOI] [PubMed] [Google Scholar]
- 33.Weuve J, Tchetgen Tchetgen EJ, Glymour MM, et al. Accounting for bias due to selective attrition: the example of smoking and cognitive decline. Epidemiology. 2012;23(1):119-128. doi: 10.1097/EDE.0b013e318230e861 [DOI] [PMC free article] [PubMed] [Google Scholar]
- 34.Ailshire J, Walsemann KM. Education differences in the adverse impact of PM2.5 on incident cognitive impairment among US older adults. J Alzheimer Dis. 2021;79(2):1-11. doi: 10.3233/JAD-200765 [DOI] [PubMed] [Google Scholar]
- 35.Shaffer RM, Blanco MN, Li G, et al. Fine particulate matter and dementia incidence in the Adult Changes in Thought study. Environ Health Perspect. 2021;129(8):87001. doi: 10.1289/EHP9018 [DOI] [PMC free article] [PubMed] [Google Scholar]
- 36.Shi L, Steenland K, Li H, et al. A national cohort study (2000-2018) of long-term air pollution exposure and incident dementia in older adults in the United States. Nat Commun. 2021;12(1):6754. doi: 10.1038/s41467-021-27049-2 [DOI] [PMC free article] [PubMed] [Google Scholar]
- 37.Wilker EH, Osman M, Weisskopf MG. Ambient air pollution and clinical dementia: systematic review and meta-analysis. BMJ. 2023;381:e071620. doi: 10.1136/bmj-2022-071620 [DOI] [PMC free article] [PubMed] [Google Scholar]
- 38.Oudin A, Segersson D, Adolfsson R, Forsberg B. Association between air pollution from residential wood burning and dementia incidence in a longitudinal study in Northern Sweden. PLoS One. 2018;13(6):e0198283. doi: 10.1371/journal.pone.0198283 [DOI] [PMC free article] [PubMed] [Google Scholar]
- 39.Shi L, Zhu Q, Wang Y, et al. Incident dementia and long-term exposure to constituents of fine particle air pollution: a national cohort study in the United States. Proc Natl Acad Sci U S A. 2023;120(1):e2211282119. doi: 10.1073/pnas.2211282119 [DOI] [PMC free article] [PubMed] [Google Scholar]
- 40.Thurston GD, Ito K, Lall R, et al. NPACT study 4: mortality and long-term exposure to PM2.5 and its components in the American Cancer Society’s Cancer Prevention Study II cohort. In: National Particle Component Toxicity (NPACT) Initiative: Integrated Epidemiologic and Toxicologic Studies of the Health Effects of Particulate Matter Components. Health Effects Institute; 2013:127-166. [PubMed]
- 41.Grande G, Ljungman PLS, Eneroth K, Bellander T, Rizzuto D. Association between cardiovascular disease and long-term exposure to air pollution with the risk of dementia. JAMA Neurol. 2020;77(7):801-809. doi: 10.1001/jamaneurol.2019.4914 [DOI] [PMC free article] [PubMed] [Google Scholar]
- 42.Wyer KE, Kelleghan DB, Blanes-Vidal V, Schauberger G, Curran TP. Ammonia emissions from agriculture and their contribution to fine particulate matter: a review of implications for human health. J Environ Manage. 2022;323:116285. doi: 10.1016/j.jenvman.2022.116285 [DOI] [PubMed] [Google Scholar]
- 43.Sun H, Chen H, Yao L, et al. Sources and health risks of PM2.5-bound polychlorinated biphenyls (PCBs) and organochlorine pesticides (OCPs) in a North China rural area. J Environ Sci (China). 2020;95:240-247. doi: 10.1016/j.jes.2020.03.051 [DOI] [PubMed] [Google Scholar]
- 44.Ji T, Lin T, Wang F, Li Y, Guo Z. Seasonal variation of organochlorine pesticides in the gaseous phase and aerosols over the East China Sea. Atmos Environ. 2015;109:31-41. doi: 10.1016/j.atmosenv.2015.03.004 [DOI] [Google Scholar]
- 45.Zhao Y-L, Qu Y, Ou Y-N, Zhang Y-R, Tan L, Yu J-T. Environmental factors and risks of cognitive impairment and dementia: a systematic review and meta-analysis. Ageing Res Rev. 2021;72:101504. doi: 10.1016/j.arr.2021.101504 [DOI] [PubMed] [Google Scholar]
- 46.Ford B, Val Martin M, Zelasky SE, et al. Future fire impacts on smoke concentrations, visibility, and health in the contiguous United States. Geohealth. 2018;2(8):229-247. doi: 10.1029/2018GH000144 [DOI] [PMC free article] [PubMed] [Google Scholar]
- 47.Saldanha A, Romero FJ, Wells C, Glantz A. As California Burns, America Breathes Toxic Smoke. Published 2021. Accessed June 30, 2023. https://publichealthwatch.org/2021/09/28/as-california-burns-america-breathes-toxic-smoke/
- 48.Reid CE, Brauer M, Johnston FH, Jerrett M, Balmes JR, Elliott CT. Critical review of health impacts of wildfire smoke exposure. Environ Health Perspect. 2016;124(9):1334-1343. doi: 10.1289/ehp.1409277 [DOI] [PMC free article] [PubMed] [Google Scholar]
- 49.Liu JC, Pereira G, Uhl SA, Bravo MA, Bell ML. A systematic review of the physical health impacts from non-occupational exposure to wildfire smoke. Environ Res. 2015;136:120-132. doi: 10.1016/j.envres.2014.10.015 [DOI] [PMC free article] [PubMed] [Google Scholar]
- 50.Heaney A, Stowell JD, Liu JC, Basu R, Marlier M, Kinney P. Impacts of fine particulate matter from wildfire smoke on respiratory and cardiovascular health in California. Geohealth. 2022;6(6):GH000578. doi: 10.1029/2021GH000578 [DOI] [PMC free article] [PubMed] [Google Scholar]
- 51.Wettstein ZS, Hoshiko S, Fahimi J, Harrison RJ, Cascio WE, Rappold AG. Cardiovascular and cerebrovascular emergency department visits associated with wildfire smoke exposure in California in 2015. J Am Heart Assoc. 2018;7(8):e007492. doi: 10.1161/JAHA.117.007492 [DOI] [PMC free article] [PubMed] [Google Scholar]
- 52.Chen G, Guo Y, Yue X, et al. Mortality risk attributable to wildfire-related PM2·5 pollution: a global time series study in 749 locations. Lancet Planet Health. 2021;5(9):e579-e587. doi: 10.1016/S2542-5196(21)00200-X [DOI] [PubMed] [Google Scholar]
- 53.Grant E, Runkle JD. Long-term health effects of wildfire exposure: a scoping review. J Clim Change Health. 2022;6:100110. doi: 10.1016/j.joclim.2021.100110 [DOI] [Google Scholar]
- 54.Ma Y, Zang E, Liu Y, et al. Wildfire smoke PM2.5 and mortality in the contiguous United States. medRxiv. Preprint posted online February 1, 2023. doi: 10.1101/2023.01.31.23285059 [DOI]
- 55.Cleland SE, Wyatt LH, Wei L, et al. Short-term exposure to wildfire smoke and PM2.5 and cognitive performance in a brain-training game: a longitudinal study of US adults. Environ Health Perspect. 2022;130(6):67005. doi: 10.1289/EHP10498 [DOI] [PMC free article] [PubMed] [Google Scholar]
- 56.Weden MM, Shih RA, Kabeto MU, Langa KM. Secular trends in dementia and cognitive impairment of US rural and urban older adults. Am J Prev Med. 2018;54(2):164-172. doi: 10.1016/j.amepre.2017.10.021 [DOI] [PMC free article] [PubMed] [Google Scholar]
- 57.Salvi A, Salim S. Neurobehavioral consequences of traffic-related air pollution. Front Neurosci. 2019;13:1232. doi: 10.3389/fnins.2019.01232 [DOI] [PMC free article] [PubMed] [Google Scholar]
- 58.Costa LG, Cole TB, Coburn J, Chang Y-C, Dao K, Roqué PJ. Neurotoxicity of traffic-related air pollution. Neurotoxicology. 2017;59:133-139. doi: 10.1016/j.neuro.2015.11.008 [DOI] [PMC free article] [PubMed] [Google Scholar]
- 59.Tham R, Schikowski T. The role of traffic-related air pollution on neurodegenerative diseases in older people: an epidemiological perspective. J Alzheimers Dis. 2021;79(3):949-959. doi: 10.3233/JAD-200813 [DOI] [PubMed] [Google Scholar]
- 60.Su JG, Jerrett M, Beckerman B, Wilhelm M, Ghosh JK, Ritz B. Predicting traffic-related air pollution in Los Angeles using a distance decay regression selection strategy. Environ Res. 2009;109(6):657-670. doi: 10.1016/j.envres.2009.06.001 [DOI] [PMC free article] [PubMed] [Google Scholar]
- 61.Wurth R, Kioumourtzoglou M-A, Tucker KL, Griffith J, Manjourides J, Suh H. Fine particle sources and cognitive function in an older Puerto Rican cohort in Greater Boston. Environ Epidemiol. 2018;2(3):e022. doi: 10.1097/EE9.0000000000000022 [DOI] [PMC free article] [PubMed] [Google Scholar]
- 62.Chang K-H, Chang M-Y, Muo C-H, Wu T-N, Chen C-Y, Kao C-H. Increased risk of dementia in patients exposed to nitrogen dioxide and carbon monoxide: a population-based retrospective cohort study. PLoS One. 2014;9(8):e103078. doi: 10.1371/journal.pone.0103078 [DOI] [PMC free article] [PubMed] [Google Scholar]
- 63.Taylor DH Jr, Østbye T, Langa KM, Weir D, Plassman BL. The accuracy of Medicare claims as an epidemiological tool: the case of dementia revisited. J Alzheimers Dis. 2009;17(4):807-815. doi: 10.3233/JAD-2009-1099 [DOI] [PMC free article] [PubMed] [Google Scholar]
- 64.Power MC, Weisskopf MG, Alexeeff SE, Coull BA, Spiro A III, Schwartz J. Traffic-related air pollution and cognitive function in a cohort of older men. Environ Health Perspect. 2011;119(5):682-687. doi: 10.1289/ehp.1002767 [DOI] [PMC free article] [PubMed] [Google Scholar]
Associated Data
This section collects any data citations, data availability statements, or supplementary materials included in this article.
Supplementary Materials
eAppendix 1. Steps for Derivation of Sources-Specific PM2.5
eAppendix 2. Description of Nine Emission Sources
eAppendix 3. Estimation of the Burden of Incident Dementia Attributable to Total PM2.5 for the US Population in 2015
eFigure 1. Schematic Flowchart of the Study Population Selection
eFigure 2. Correlations Between Primary Source-Specific PM2.5 Emissions From 2017 and 10-Year Average Primary Source-Specific PM2.5 Emissions From 2007-2017 for Each State in the United States
eFigure 3. Difference in the Rank of States by Source-Specific Primary PM2.5 Emissions Between 2017 and the Average Over the 10 Years Before 2017 in the United States
eFigure 4. 10-year Average Concentrations of Total PM2.5 by Biennial HRS Wave
eFigure 5. Hazard Ratios (95% Confidence Intervals) of Incident Dementia in the Health and Retirement Study (1998-2016) Associated With Interquartile Differences in 10-Year Average Concentrations of Pollutants Beyond PM2.5 in Single and Multipollutant Models
eFigure 6. Hazard Ratios (95% Confidence Intervals) of Incident Dementia in the Health and Retirement Study (1998-2016) Associated With Interquartile Differences in 10-Year Average Concentrations of Source-Specific PM2.5 in Single Pollutant Models by Sex
eFigure 7. Hazard Ratios (95% Confidence Intervals) of Incident Dementia in the Health and Retirement Study (1998-2016) Associated With Interquartile Differences in 10-Year Average Concentrations of Source-Specific PM2.5 in Single Pollutant Models by Race/Ethnicity
eFigure 8. Hazard Ratios (95% Confidence Intervals) of Incident Dementia in the Health and Retirement Study (1998-2016) Associated With Interquartile Differences in 10-Year Average Concentrations of Source-Specific PM2.5 in Single Pollutant Models by Baseline Age.
eFigure 9. The Concentration–Response Curves for Each Total and Source-Specific PM2.5 With Incident Dementia Derived From the Single-Pollutant Models, Adjusted for 2-Year Birth Cohorts, 2-Year Age at Baseline, Sex, Race, Educational Attainment, Ownership of the Primary Residence, Total Household Wealth, Urbanicity, NSES and a Flexible Set of Unpenalized Thin-Plate Regression Splines With 10 df
eTable 1. Correlations Among 10-Year Average Air Pollutants for Participants of the Health and Retirement Study (1998-2016)
eTable 2. The Median (IQR) Concentrations of Air Pollutants Within Each Category of the Baseline Characteristics of Our Study Population During Follow-Up From 1998 to 2016
eTable 3. Hazard Ratios (95% Confidence Intervals) of Incident Dementia in the Health and Retirement Study (1998-2016) per 1-μg/m3 Increment in 10-Year Average Concentrations of Source-Specific PM2.5 in Single- and Multi-Pollutant Models
eTable 4. Hazard Ratios (95% Confidence Intervals) of Incident Dementia in the Health and Retirement Study (1998-2016) Associated With Interquartile Differences in Source-Specific PM2.5 Concentrations in Single Pollutant Models With Different Exposure Averaging Periods
eTable 5. Hazard Ratios (95% Confidence Intervals) of Incident Dementia in the Health and Retirement Study Associated With Interquartile Differences in 10-Year Average Concentrations of Total and Source-Specific PM2.5 When Excluding or Including the SES Indicators in Single-Pollutant Models
eTable 6. Hazard Ratios (95% Confidence Intervals) of Incident Dementia in the Health and Retirement Study Associated With Interquartile Differences in 10-Year Average Concentrations of Source-Specific PM2.5 in Single-Pollutant Models When Limiting to Non-Movers
eTable 7. Hazard Ratios (95% Confidence Intervals) of Incident Dementia in the Health and Retirement Study Associated With Interquartile Differences in Average Concentrations of PM2.5 From Wildfires Estimated With Time-Fixed Emission Data (Primary) and Wildfires Estimated With Time-Varying Emission Data (2006 to 2016) With Different Average Periods and Baseline
eReferences.
Data Sharing Statement