Abstract
Rhabdomyosarcoma (RMS) is a common childhood cancer that shares features with developing skeletal muscle. Yet, the conservation of cellular hierarchy with human muscle development and the identification of molecularly-defined tumor-propagating cells has not been reported. Using single-cell RNA sequencing, DNA-barcode cell fate mapping, and functional stem cell assays, we uncovered shared tumor cell hierarchies in RMS and human muscle development. We also identified common developmental stages at which tumor cells become arrested. Fusion-negative (FN-) RMS resemble early myogenic cells found in embryonic and fetal development, while fusion-positive (FP-) RMS express a highly specific gene program found in muscle cells transiting from embryonic to fetal development at 7-7.75 weeks of age. FP-RMS also have neural-pathway enriched states, suggesting less-rigid adherence to muscle-lineage hierarchies. Finally, we identified a molecularly-defined tumor-propagating subpopulation in FN-RMS that shares remarkable similarity to bi-potent, muscle mesenchyme progenitors that can make both muscle and osteogenic cells.
Introduction
Many cancers contain less-differentiated cell types that have the capacity to self-renew and proliferate to drive tumor growth1. These tumor-propagating cells (TPCs) also differentiate to give rise to all the cell types within the tumor. Indeed, molecularly-defined TPCs have been identified in acute myeloid leukemia2, breast cancer3, and colorectal cancer4 among others. Yet, some cancers are not hierarchically-organized and exhibit extreme cellular plasticity that drives tumor growth, the most notable example being melanoma5. In addition to defining roles for TPCs in driving tumor growth in specific malignancies, it is not well understood if the same self-renewal programs and cell fate decisions found in the predicted tissue-of-origin are recapitulated in cancer. For example, medulloblastomas coopt the same Sonic Hedgehog (SHH) and WNT signaling pathways to drive cancer self-renewal as found in non-malignant neuron precursor cells6,7. By contrast, MYC drives cancer self-renewal programs that are not restricted to the predicted tissue-of-origin8. These findings suggest that a subset of tumors re-use the same developmental stem cell pathways found in their proposed originating tissue while others adopt new self-renewal programs as part of their transformation process.
Rhabdomyosarcoma (RMS) is the most common soft tissue sarcoma of childhood and shares histopathological features with hierarchically organized skeletal muscle9-11, making it an ideal model to address these questions. Rhabdomyosarcoma consists of two major subtypes, including fusion-positive RMS that harbor PAX3 or PAX7 translocations with FOXO1 (FP-RMS), and fusion-negative RMS that are largely transformed by RAS pathway activation (FN-RMS)12-15. Clinical assignment of high risk RMS includes harboring PAX:FOXO1 translocations, age <1 or older than 10 years of age, developing primary tumor at unfavorable locations, failing to achieve local tumor control, and/or progressing to metastatic disease16-19. Although these common clinical characteristics inform treatment, it is also clear that additional molecular heterogeneity underlies tumor aggression and therapy resistance. For example, PAX3-FOXO1 fusion-positive RMS and the MYODL122R spindle-variant of RMS have poor prognosis compared to fusion-negative or PAX7-FOXO1 RMS17-19, suggesting additional molecular and tumor heterogeneity beyond the purported two RMS subtypes. Indeed, additional genetic perturbations including P53 pathway inactivation are risk factors for developing aggressive and treatment resistant disease in both FN- and FP-RMS20. Despite roles for genetic mutations and molecular heterogeneity in driving RMS aggression, both RMS subtypes express muscle-lineage transcription factors including MYOD (Myoblast Determination Protein 1), MYF5 (Myogenic Factor 5), and/or Myogenin21,22 and morphologically resemble undifferentiated mononucleated muscle cells found throughout fetal, embryonic, and adult development including dermomyotome, satellite cells, muscle progenitors, and myoblasts/myocytes12,23-26. These data suggest that underlying muscle developmental pathways drive the growth and maintenance of a wide array of RMS tumors.
To date, direct assignment of RMS molecular cell states with those from normal human skeletal muscle development have not been reported. Nor is it known the extent to which RMS cell hierarchies recapitulate those found in muscle and the maturation stage at which tumor cells arrest in human development. The controversy for RMS arising from multiple possible cells of origin12,23-25,27 and the lack of detailed molecular description of human RMS tumor cell heterogeneity, including the cell types that sustain tumor cell growth, led us to perform single-cell RNA sequencing of human RMS and make comparison with human muscle development. We also performed functional stem cell assays to identify a largely quiescent tumor-propagating cell (TPC) in FN-RMS that drives cancer regrowth following stress. This FN-RMS TPC shares remarkable similarity to the recently described bipotent mesenchymal stem cell population that makes both muscle and osteogenic lineages28.
Results
scRNA-sequencing reveals RMS heterogeneity
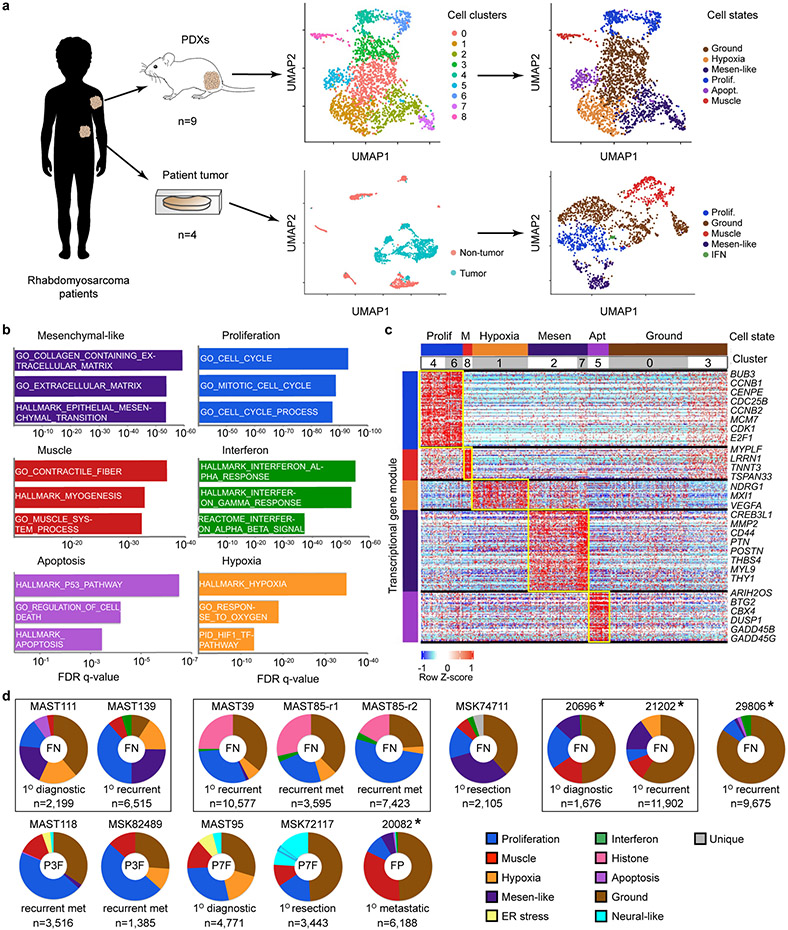
To investigate the cell states and the conservation of muscle developmental hierarchies in RMS, we performed droplet-based 10x single cell RNA-sequencing of patient-derived xenografts (PDXs, n=9 from 7 patients; Fig. 1a, Supplementary Table 1). A mouse cell depletion kit removed stromal cells, with subsequent PDX samples contained only 0-1.3% mouse cells that were efficiently excluded based on failing to map to the human genome. For primary, frozen patient samples common stromal cell types were identified and then excluded based on Cellassign29 (n=4 from 3 patients, Extended Data Fig. 1a). RMS cells were independently confirmed as tumor based on expression of well-known RMS-expressed genes including MYOD, MYOG, and DES and of a highly specific FN- or FP-core signature identified below (Extended Data Fig. 1b, Fig. 6, Extended Data Fig. 9, and Supplementary Table 2).
Fig. 1.
Single-cell RNA-sequencing reveals distinct cell states and intertumoral heterogeneity in human RMS. a. Schematic of experimental design. UMAP renderings of representative fusion-negative (FN) RMS from patient-derived xenograft MAST111 (top) and primary patient 20696 (bottom). Non-tumor cells were removed from primary patient sample analysis using Cellassign and tumor cells verified for expression of RMS subtype-specific gene signatures and diagnostic marker expression (middle panel, bottom). Tumor cells were assigned to UMAP clusters and combined based on shared gene expression similarities (right). b. RMS cell state signatures queried against the Molecular Signatures Database v7.4. Top enriched molecular signatures were generated from analysis of all PDX samples (n=10, including MAST85 run in replicate) and are shown with False Discovery Rate (FDR) q-values noted. c. Representative heatmap showing single cells (x-axis) and genes enriched for specific transcriptional gene modules (y-axis) for FN-MAST111 PDX. d. Quantification of cell states within individual tumors. Frozen patient tumors denoted by asterisks. Fusion negative (FN, top) and fusion-positive (FP, bottom). PAX3:FOXO1 (P3F) and PAX7:FOXO1 (P7F). The black boxes indicate samples obtained from the same patient. MAST85-r1 and r2 are replicates of the same PDX tumor. Number of cells analyzed noted for each tumor within image panels.
Cells were next clustered using shared nearest neighbor (SNN) clustering analysis30 and visualized using UMAP rendering (Uniform Manifold Approximation and Projection, Fig. 1a, Extended Data Fig. 1c). Cell clusters with similar gene expression were combined and conserved cell states assigned using the Molecular Signatures Database v7.431 (Fig. 1b-c, Extended Data Fig. 1d, and Supplementary Table 2). From this analysis, we uncovered common pan-cancer cell states including proliferative, hypoxic, apoptotic, interferon and ER stress responsive cell signatures (Fig. 1d, Extended Data Fig. 1e, 2). We also discovered RMS-specific cell states that included i) a differentiated muscle cell population that expressed MYLPF (Myosin Light chain 2), ACTC1 (Actin Alpha Cardiac Muscle 1), LRRN1 (Leucin Rich Repeat Neuronal 1), TNNT3 (Troponin T3) and TSPAN33 (Tetraspanin-33); ii) a mesenchymal-enriched population (Mesen. like) that expressed extracellular matrix and mesenchymal genes that included MMP2 (Matrix Metalloproteinase 2), CD44, PTN (Pleiotrophin), POSTN (Periostin), and THY1 (CD90); and iii) neural-pathway enriched cell types found only in single FP-RMS samples (Fig. 1d, Extended Data Fig. 3). MYOD, Desmin, and MYC were expressed across all tumors and all RMS cell states, confirming that RMS cells arrest in and express genes associated with muscle lineage commitment (Extended Data Fig. 4). Two mice xenografted with FN-MAST85 PDX were independently analyzed by single cell sequencing, reveling largely similar cell state constitution across engrafted animals (Fig. 1d). Similar cell state composition was also observed from single-nuclei sequencing of four additional primary patient samples (Fig. 1d, denoted with asterisks, and Extended Data Fig. 1).
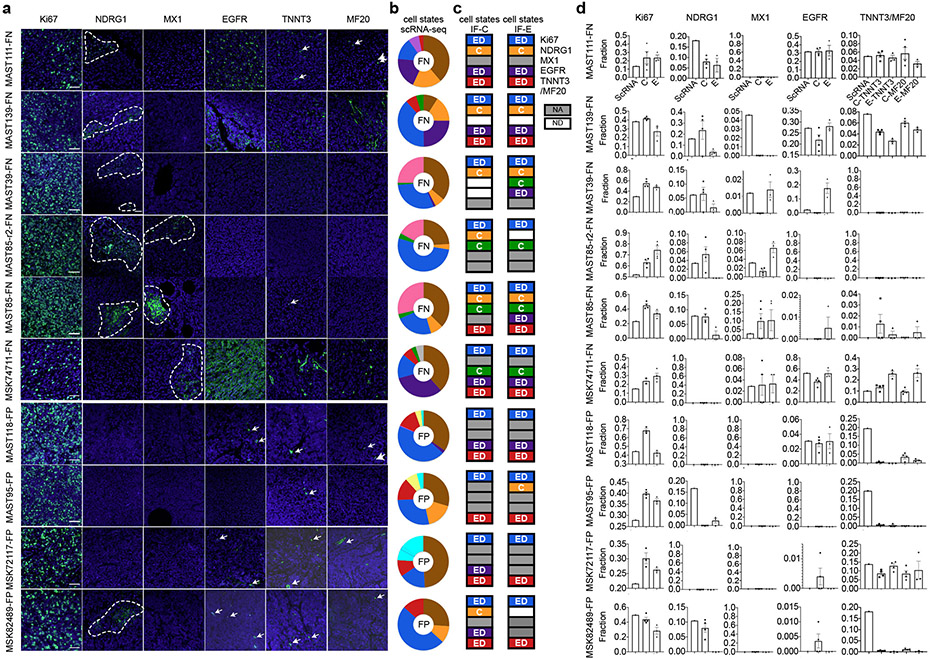
Immunofluorescence staining showed a uniform distribution of cell states within PDX tumors, irrespective if cells were located at the invasive edge or within the central tumor mass with exception of hypoxic and interferon-responsive cells that were regionally confined to heterogeneous patches throughout the tumor mass (Extended Data Fig. 5). IHC staining confirmed similar overall percentages of tumors cell states when compared with scRNA sequencing (Extended Data Fig. 5). Immunohistochemistry cell state markers were identified from our scRNA-sequencing and included Ki67 (MKI67) that labelled proliferative cells, NDRG1 (N-myc Downstream Regulated 1) for hypoxic cells, and MX1 (MX Dynamin Like GTPase 1) for interferon responsive cells. RMS-specific cell states were assessed using EGFR (Epidermal growth factor receptor) for mesenchymal-like cells and TNNT3 and myosin heavy chain (MF20) for differentiated muscle subpopulations.
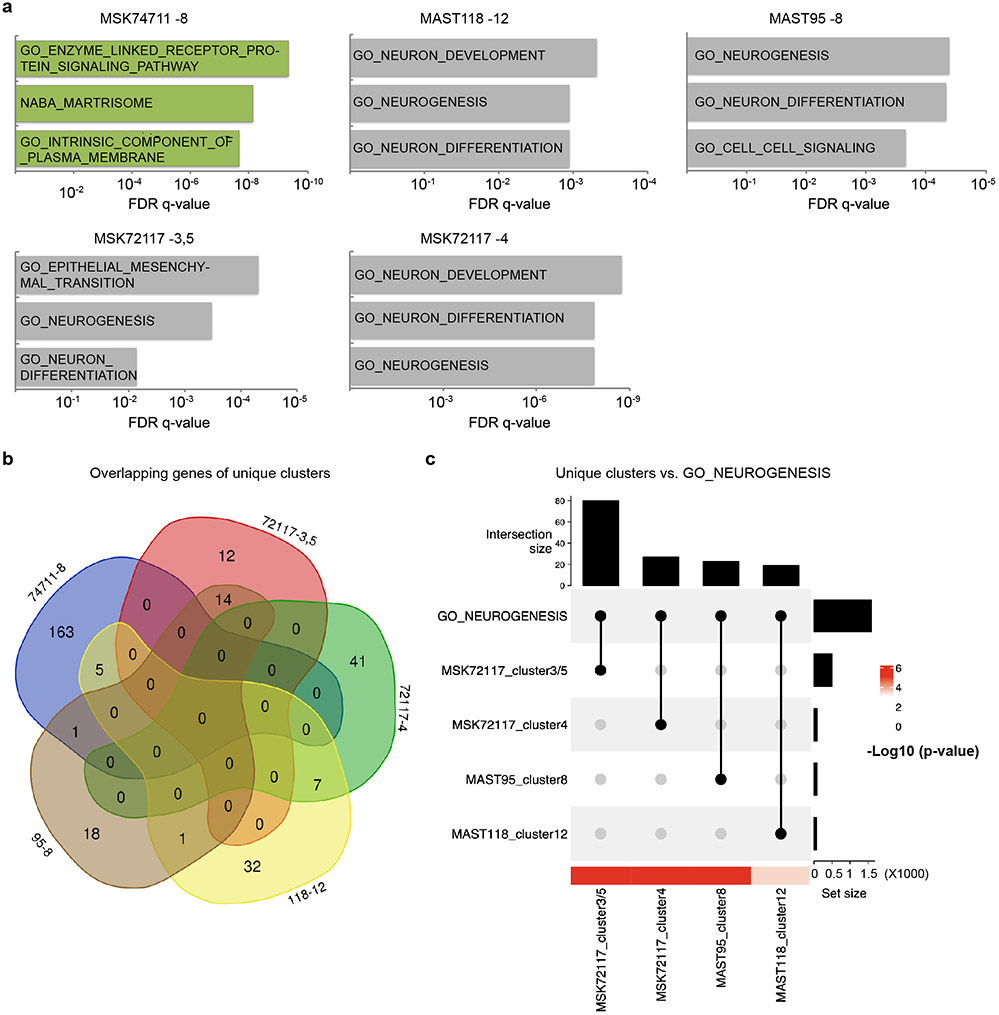
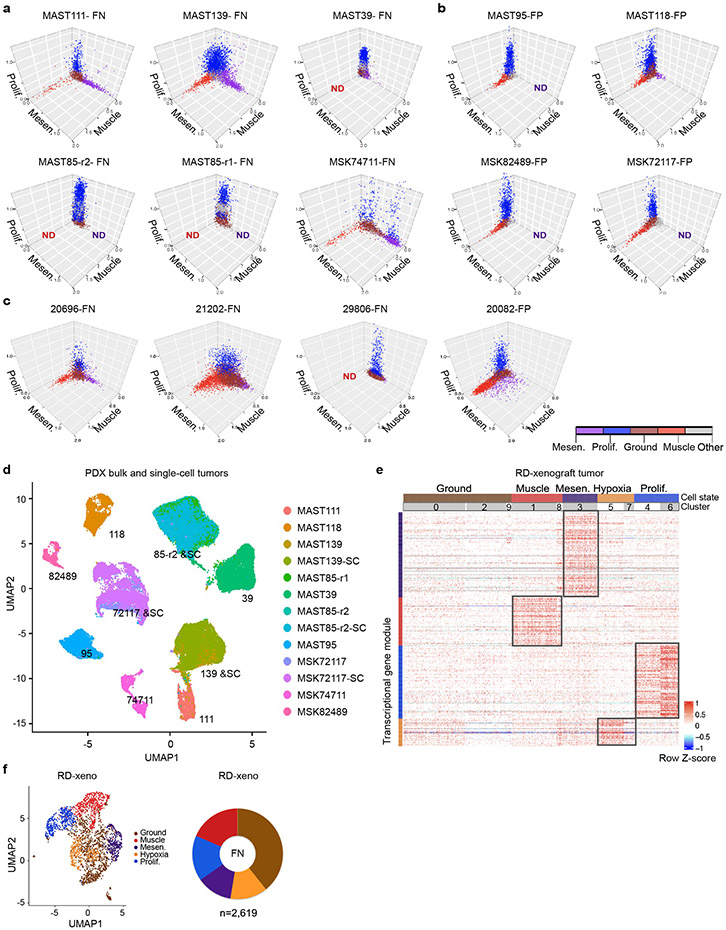
A more detailed analysis of RMS intertumoral heterogeneity reveled that a vast majority of tumors contained differentiated muscle cells (Fig. 1d). Yet, one FN-RMS model (PDX MAST39 and its metastatic lesion MST85) and one FN-primary patient sample (29806) did not contain differentiated muscle cells when assessed by single cell sequencing and IHC, consistent with the clinical presentation of a subset of RMS that lack differentiated muscle cell types. All five FN-RMS tumors contained mesenchymal-enriched cells, while only two of the five FP-RMS contained this cell subpopulation (Fig. 1d). Finally, a majority of FP-RMS harbored neural pathway enriched cells (n=4 of 5), suggesting that FP-RMS tumors may commonly adopt these cell states as part of the transformation process (Fig. 1d, Extended Data Fig. 3). Neural pathway-enriched tumor cell populations contained non-overlapping expressed genes that differed between clusters within the same tumor and across FP-RMS (Extended Data Fig. 3, Supplementary Table 2). Finally, all patient-derived RMS contained large numbers of cells that failed to express any of the above transcriptional gene modules and were assigned as “ground state” (Fig. 1c-d). These ground state cells are committed to muscle lineage and express muscle-specific genes including MYOD, MYOG, and Desmin (Extended Data Fig. 4). Importantly, comparable numbers of genes were detected in ground state cells when compared with other cell subpopulations (Extended Data Fig. 1e, 2b-c), obviating the possibility that ground state cells clustered together because of low transcript detection. Gene expression was also analyzed in 3-dimensional space based on the combined expression of gene modules for proliferation, muscle, and mesenchymal cell states. This orthogonal approach confirmed that each cell state was molecularly distinct and comprised largely non-overlapping cell states (Extended Data Fig. 6a-c). These data show that there are four dominant, transcriptionally-defined RMS tumor cell states that comprise proliferative cells, ground state cells, mesenchymal cells, and differentiated muscle cells.
Not all RMS cells can initiate tumor growth
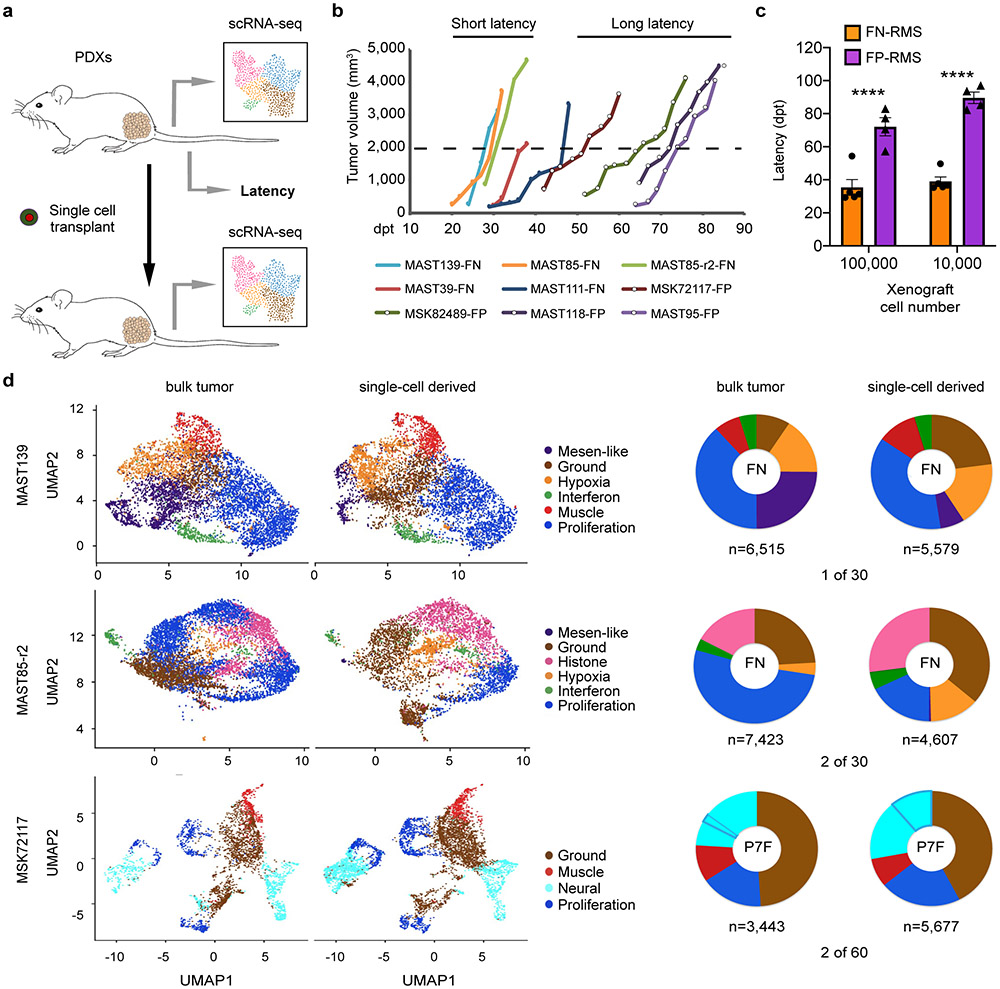
To unbiasedly determine latency of tumor growth in FN- and FP-RMS PDX models, we next transplanted RMS cells from nine PDXs into NSG mice (n=3 mice per group, 1x10⁵ and 1x10⁴ cells, Fig. 2a-c). FN-RMS re-established tumors faster when compared with FP-RMS (35.4±11.7 days and 72±6.9 days, respectively; 1x10⁵ cells/animal, p=5.5e-08, similar results were seen in animals engrafted with 1x10⁴ cells). To further investigate if a single RMS cell can remake tumor and generate all the subsequent cellular states, single tumor cells from four PDXs were engrafted into the flanks of NSG mice (n=30-60 single cells/PDX, Fig. 2a, d). In total, three of the four PDXs generated tumors following single cell xenograft engraftment, including two fusion-negative and one fusion-positive RMS. scRNA sequencing confirmed that each tumor derived from implantation of a single RMS cell had similar cell state composition (Fig. 2d) and clustered with their parental tumor following TSNE visualization performed using all tumors (Extended Fig. 6d). These results confirm that a single tumor cell can repopulate the entirety of RMS cell states, including the neural pathway enriched cell states in FP-RMS, and also suggested that some RMS contain unanticipatedly high numbers of TPCs.
Fig. 2.
Single RMS cells can remake all tumor cell heterogeneity within the cancer. a. Schematic of experimental design. b. Representative tumor growth in PDX models. Threshold cut off for assigning short verses long latency was attaining a tumor volume of 2000mm3 by 40 days post-transplant (dpt, 1x10⁵ cells engrafted per mouse). c. Quantification of latency differences between FN- and FP-RMS completed at two dilutions (1x10⁵ and 1x10⁴ cells, n=5 FN-RMS PDXs and n=4 FP-RMS PDXs). Datum points show the average latency from individual mine (n=3 mice per tumor). Mean ± SEM noted. Two-way ANOVA followed by two-sided Student’s t-test, **** p<0.0001. d. UMAP renderings of parental bulk tumor compared with tumors derived from engraftment of a single RMS cell (left panels). Quantification of cell states by tumor (right). Fusion-negative (FN) and PAX7-FOXO1 fusion-positive RMS (P7F). Number of cells sequenced are indicated below each wheel chart and number of tumors generated from single cell engraftment is noted (i.e. 1 of 30 single cells engrafted tumors by 180 days post transplantation).
FN-RMS contain a molecularly-defined TPC
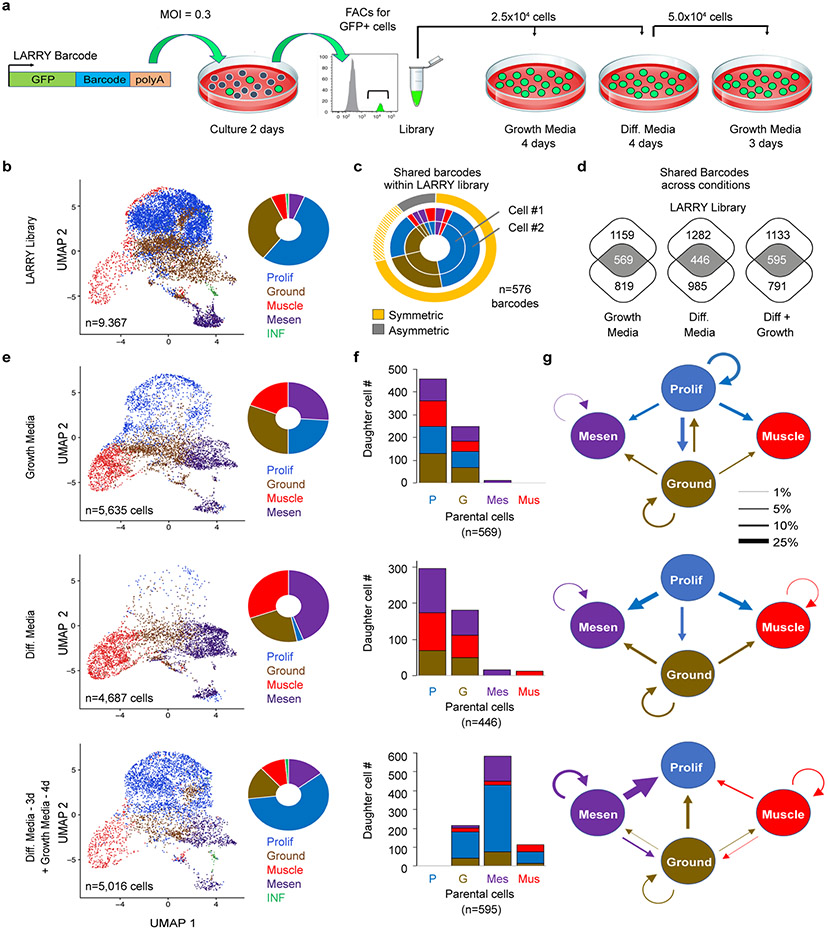
To assess cell lineage and fate decisions in FN-RMS, scRNA sequencing was next completed using Lineage And RNA RecoverY (LARRY) barcoding of human FN-RMS RD cells (Fig. 3). Importantly, RD cells contain the same four dominant tumor cell states in both 2D culture and xenografts (Fig. 3b, Extended Data Fig. 6e-f). LARRY uses a unique lentiviral barcode inserted at the 3’UTR of an expressed GFP that is integrated into parental cells. Progeny are then clonally traced to follow daughter cell fates over time32. Here, RD cells were lenti-virally infected at a MOI of 0.3, ensuring that each cell integrated one copy of the unique barcode (Fig. 3a). Cells were grown for two days to permit 1-2 cell divisions and GFP+ cells isolated by FACs. A portion of the sample was used for 10x scRNA sequencing to assess the initial cell states of parent cells and included a LARRY specific primer to amplify the barcode (~5x10⁴ reads per cell). The remaining cells were cultured in high serum or low serum/differentiation media for 4 days. Daughter cells were then harvested for scRNA sequencing and a portion of the cells grown in differentiation media were replated into high serum growth media for 3 days. In total, LARRY barcodes were detected in 26.4 to 47.8% of scRNA sequenced cells across conditions (range 2,040 to 2,470 cells/condition). Bioinformatic analysis confirmed that a large majority of cells found in the LARRY barcoded library retained their cell state following short-term culture (Fig. 3c). In total, ≥446 barcodes were shared in parental and daughter cells across experimental conditions (Fig. 3d), permitting lineage tracing and cell fate mapping over time (Fig. 3e-g).
Fig. 3.
Lineage And RNA RecoverY (LARRY) barcoding of human FN-RMS RD cells reveals that the mesenchymal-enriched cell subfraction is capable of driving tumor growth following culture in low serum, stress conditions. a. Schematic of experimental design. b. UMAP rendering and quantitation of cell states within the LARRY barcoded library (n=9,367 cells). c. Quantification of RMS cells within the library that share the same LARRY barcode and juxtaposed with cell state assigned by gene expression from scRNA sequencing. Cells that divided over the two days of culture adopted largely symmetric cell fates. Dashed yellow highlighting denotes a common and inferred oscillating cell state found in ground and proliferative RMS cells. d. Venn diagram showing shared barcodes found in the LARRY library and after growth under various conditions. e. UMAP renderings and quantitation of cell states following growth under various conditions. f. Analysis of parental cell contribution to overall tumor growth and subsequent generation of daughter cells following cell culture including high serum (top), low serum (middle), and low serum followed by replating into high serum (bottom). g. Quantification of cell lineage and fate decisions under varied growth conditions. Arrow direction and size indicates the probability of a parent cell dividing to produce a daughter cell with the specified cell fate.
As may be expected, parental cells were largely comprised of proliferative cells and drove the bulk of tumor growth under high serum conditions (Fig. 3f). Yet, ground state cells also lead to the production of large numbers of daughter cells, suggesting that ground and proliferative cell states dynamically oscillate in RMS. Importantly, both the ground and proliferative parental cells produced all cell types when grown in high serum, and only ground, muscle and mesenchymal-enriched cells when grown in low serum. By contrast, mesenchymal-enriched cells and muscle-lineage expressing cells were largely non-proliferative when grown in high serum and underwent only rare symmetric cell divisions to produce daughter cells with the same cell fate. These LARRY lineage tracing results align well with the scRNA sequencing showing that mesenchymal-enriched and muscle cell states are largely non-proliferative during tumor growth in patients and mouse xenografts (Extended Data Fig. 6a-b). Finally, serial replating from low serum into high serum revealed that mesenchymal-enriched cells could re-enter cell cycle and proliferate to remake cells from all four cell states. By contrast, differentiated muscle cells divided to a far lesser degree, and failed to make mesenchymal-enriched cells. These data show that the mesenchymal-enriched cell population contributes to tumor growth under low-nutrient, stress conditions and comprises a TPC that can reconstitute all cell states in FN-RMS.
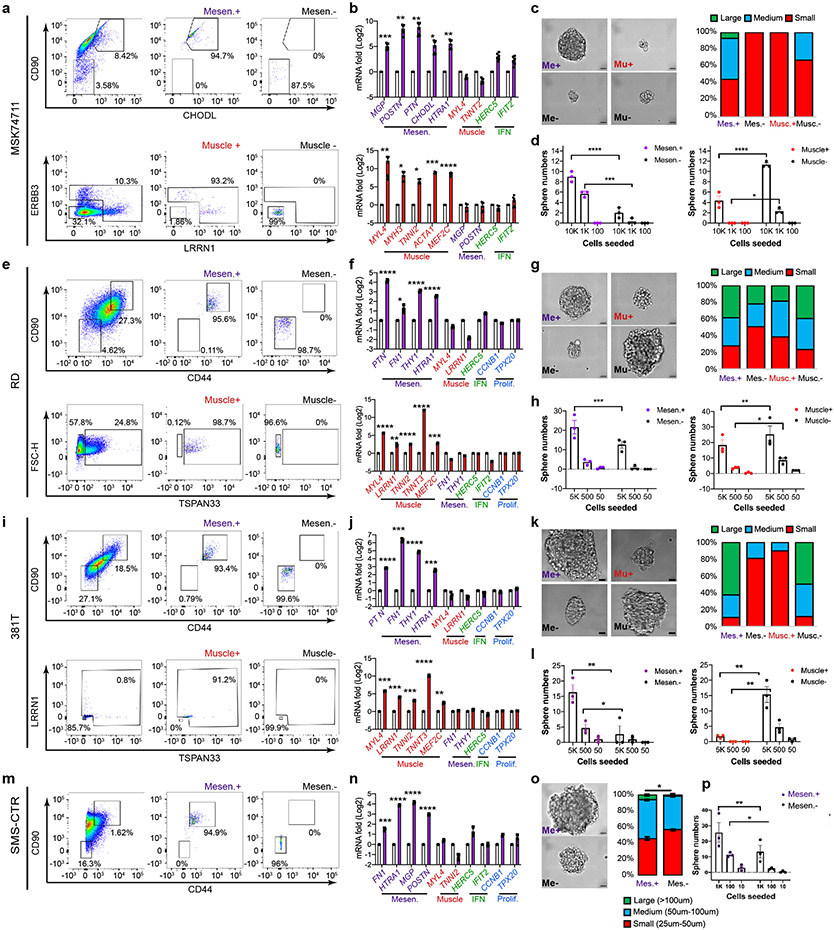
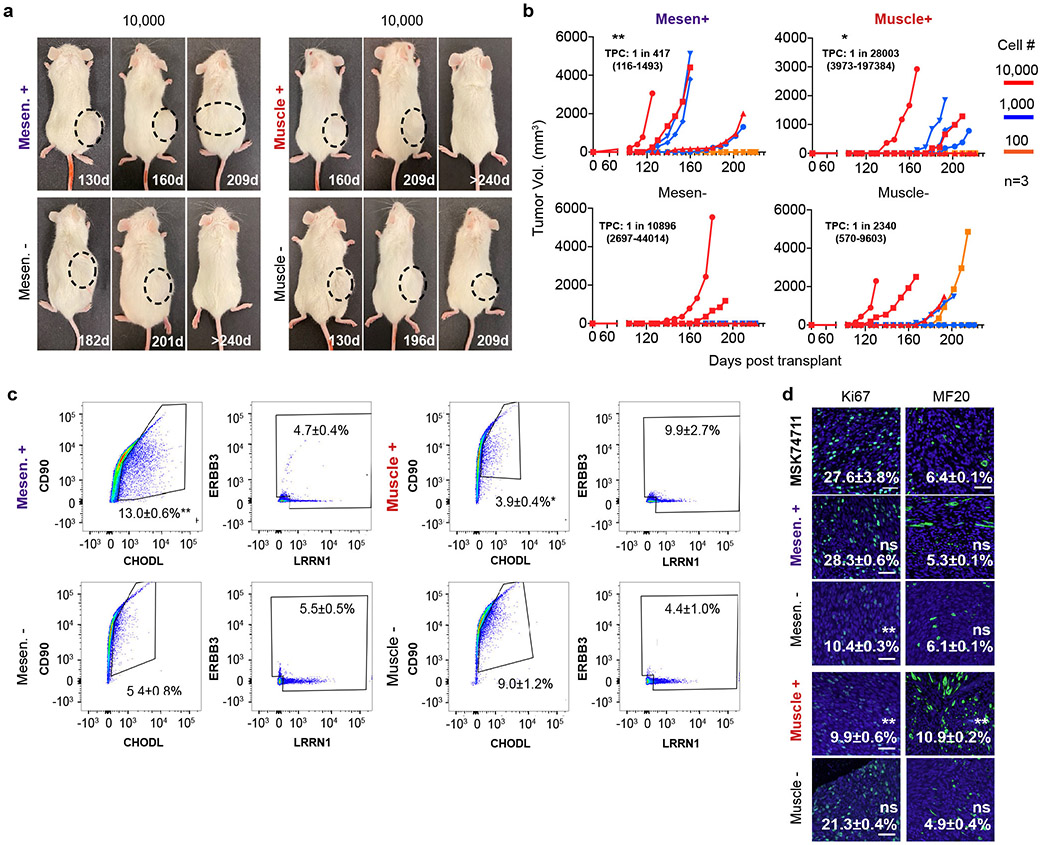
To directly investigate the mesenchymal-enriched RMS cell state in driving cancer growth, we next sought to functionally assign tumor propagating potential to discrete populations of FN-RMS cells. Cell surface markers identified from our scRNA sequencing were used to enrich for the mesenchymal-like and differentiated muscle subpopulations from FN-RMS including two PDXs (MAST139, MSK7471) and three RMS cell lines (RD, 381T and SMS-CTR; Fig. 4, Extended Data Fig. 7, Supplementary Fig. 1). As expected, FACS using either i) CD44/CD90 or CD90/CHODL combinations of antibodies allowed isolation of RMS cells that were highly enriched for the mesenchymal cell state when assessed by quantitative real time PCR (Fig. 4c, Extended Data Fig. 7b, f, j, n). Similar high-level purity for differentiated muscle cell fractions was observed following FACs using TSPAN33, LRRN1 or ERBB3 antibodies. Fusion-negative SMS-CTR contained mesenchymal cell states but lacked differentiated muscle cell populations (Extended Data Fig. 7m-p, consistent with the intertumoral heterogeneity seen in a subset of FN-RMS and previous studies showing lack of differentiation potential in this cell line33. Following 3D culturing, mesenchymal-like cells generated significantly more tumorspheres in all five FN-RMS models analyzed, especially when compared to muscle differentiation-enriched cell types (Fig. 4d, Extended Data Fig. 7d, h, l, p). Tumor spheres generated from mesenchymal-like cells were also larger in size (Fig. 4e, Extended Data Fig. 7c, g, k, o) and quantitatively enriched for TPCs when compared to counter-selected negative cell types or differentiated muscle cells (p<0.026, Fig. 4f, Supplementary Table 3).
Fig. 4.
Tumor propagating potential is found within the mesenchymal-enriched cell fraction of fusion-negative RMS. a. Schematic of experimental design. b-e. Analysis of FN-MAST139 cell subpopulations for enrichment of tumor propagating potential. b. Flow cytometry analysis of FN-MAST139 cells harvested directly from a PDX tumor grown in a NSG mouse prior to (left) and after FACS (right). Representative of n=3 mice shown with similar results. c. Quantitative real-time PCR confirming cell state enrichment following FACS (n=3 independent tumors analyzed in replicate, 6 datum points shown). *** p=0.0005, **** p<0.0001. d. Quantification of tumorsphere formation in a representative experiment from PDX MAST139 (tumor cells were directly harvested from a xenografted mouse, n=3 wells/dilution). Experiment was replicated three times from independently engrafted mice with similar results (see source data). Mesen+ vs. Mesen−, *** p=0.0001, Muscle+ vs. Muscle−, *** p=0.0005, **** p<0.0001. e. Representative images of MAST139 tumorspheres (left) and quantification of size distributions (right), scale bar = 20μm. Experiment was replicated three times from independently engrafted mice with similar results (see source data). *** p=0.0005, ** p=0.0074. f. Barbell plot showing differences in the percentage of tumor propagating cells (TPC) determined by limiting dilution tumorsphere assay for MAST139 (139), MSK74711 (74711), RD, 381T, and SMS-CTR (CTR) (* p<0.05, ** p<0.01, ***, p<0.001, ****, p<0.0001 by Extreme Limiting Dilution Analysis60, see Supplementary Table 3 for p-values). Mean ± S.E.M noted (c, d, e). Two-way ANOVA followed by two-sided Student’s t-test (c, d, e).
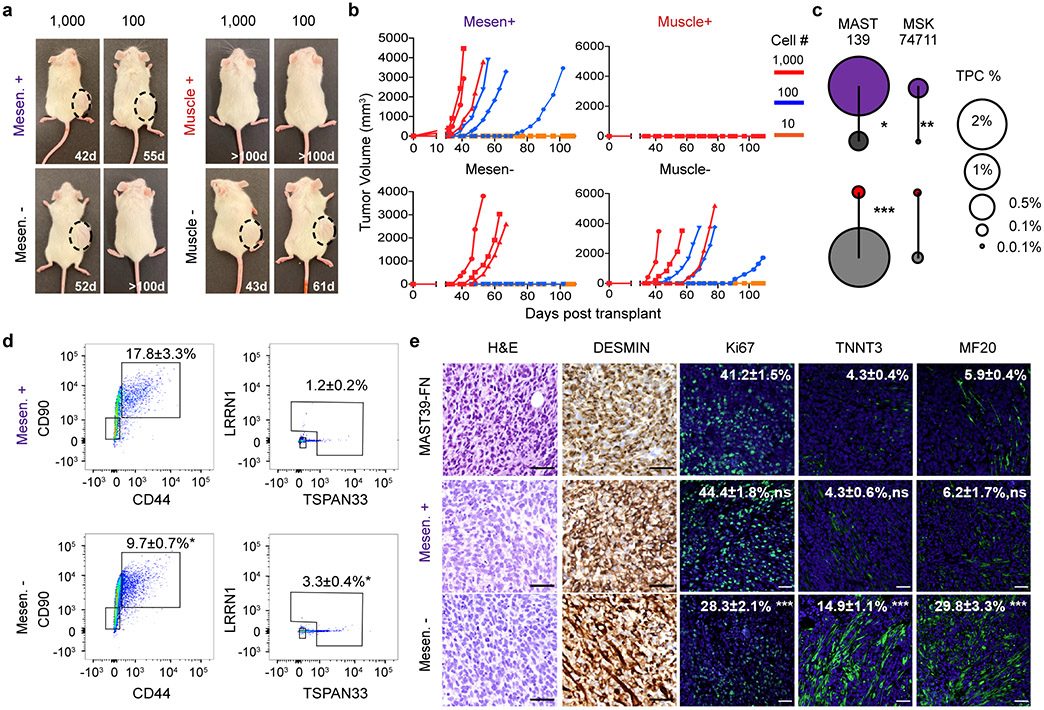
Our results were next extended to mouse xenografts. Specifically, FACS sorted cells were engrafted into NSG mice at limiting dilution. Mesenchymal-like enriched TPCs remade tumors with high efficiency in both FN-MAST139 and FN-MSK74711, especially when compared to differentiated muscle (Fig. 5a-c, p<0.026 ELDA analysis, Extended Data Fig. 8a-b, Supplementary Table 3). Mice engrafted with mesenchymal-like TPCs also exhibited faster time to tumor re-growth and had overall increased numbers of animals with disease (Fig. 5b, Extended Data Fig. 8b). ELDA confirmed TPC enrichment within the mesenchymal-enriched sorted cells when compared with engraftment of counter-selected cells or those enriched for the differentiated muscle cell state (p<0.026 ELDA, Fig. 5c, Supplementary Table 3). Tumors generated from engraftment of mesenchymal-enriched cells also had similar histology and overall numbers of heterogenous cell populations as bulk engrafted tumors (Fig. 5d-e, Extended Data Fig. 8c-d). By contrast, the few tumors that were generated from CD44−/CD90− or CD90−/CHODL− cells showed significant lower reconstitution of mesenchymal-enriched cell states and had elevated differentiated cells based on flow analysis and immunohistochemistry for Myosin Heavy Chain (MF20) and Troponin Fast Muscle Protein 3 (TNNT3, Fig. 5d-e, Extended Data Fig. 8c-d). Finally, engrafted tumors arising from mesenchymal-like cells had similar proliferation rates compared with parental tumors, whereas animals engrafted with mesenchymal-negative cells were significantly less proliferative (Fig. 5e, Extended Data Fig. 8d, p<0.001, two-sided Student’s t-test). These data show that FN-RMS contain a distinct and molecularly defined mesenchymal-pathway enriched TPC that is largely quiescent during normal growth conditions, and yet has the potential to re-enter cell cycle, divide, and create a tumor with the same underlying heterogeneity as parental tumors when grown in culture and xenografted mice.
Fig. 5.
Limiting dilution cell transplantation confirms that the FN-RMS mesenchymal-enriched subfraction has tumor propagating potential in vivo. a. Representative images of NSG mice engrafted with CD44+/CD90+ mesenchymal-enriched or CD44−/CD90− MAST139 PDX RMS cells (100 and 1,000 cells/mouse). Mice imaged at specific days post-transplantation as noted. Dashed lines delineate tumor. Representative image from n=3 independently engrafted mice shown for each dilution with similar results. b. Latency of tumor regrowth following engraftment into NSG mice. Day 0 is the day of initial engraftment. c. Barbell plot showing differences in the percentage of tumor propagating cells (TPCs) determined by limiting dilution cell transplant of FN-MAST139 and FN-MSK74711 (n=3 animals engrafted per log10 fold dilution). * p=0.02, ** p=0.007, *** p=0.0004. d. Flow analysis of tumors generated from sorted cell populations. Representative FACS plot with mean±SEM noted for analysis of three independently engrafted animals, *** p=0.0005. e. Histopathological analysis of tumors engrafted from RMS sorted cell subpopulations. Representative images of hematoxylin and eosin stain (H&E), immunohistochemistry analysis for Desmin, immunofluorescence for proliferation marker Ki67 (*** p=0.0006) and differentiated muscle markers TNNT3 (*** p=0.0005) and MF20 (*** p=0.001). Quantitation is mean±SEM from analysis of three independently engrafted animals (average obtained from four randomly imaged fields for each tumor). Statistics provided for Extreme Limiting Dilution Analysis 60 (c) and two-sided Student’s t-test (d,e). Not significant (ns). Scale bar equal 50 microns (e).
RMS shares molecular similarity with embryonic/fetal muscle
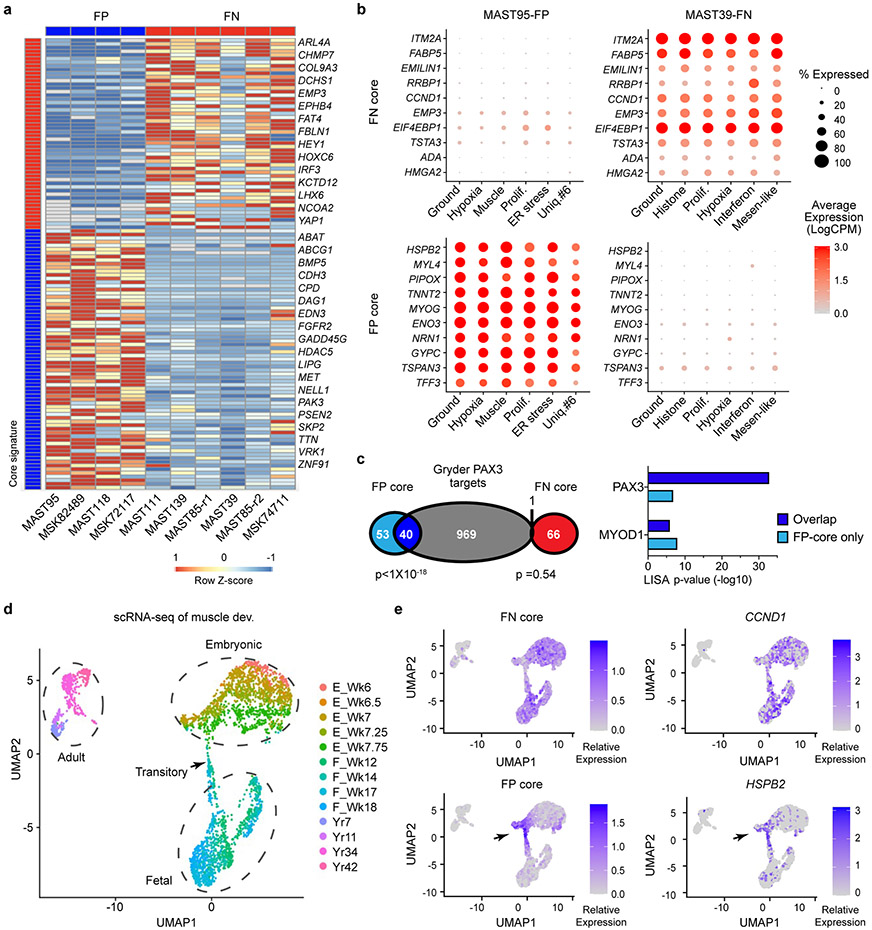
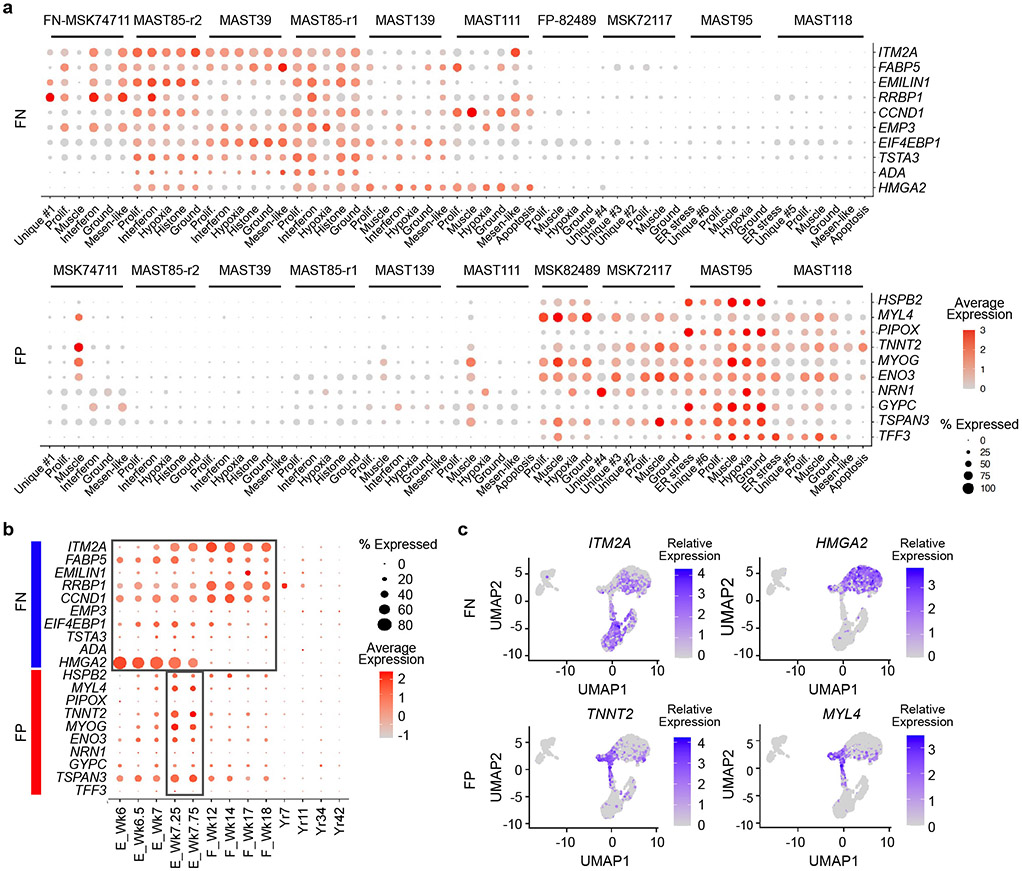
Davicioni et al. had previously identified sub-type specific transcriptional gene programs in primary human RMS34, leading us to hypothesize that subtype-specific transcriptional programs may be associated with arrest at specific stages of human muscle development. Gene expression was determined using the aggregate summation of scRNA-seq data from each tumor and then differentially regulated genes were identified by comparing gene expression between FP- and FN-PDXs (>1.5 log2 fold change, p<0.05 two-sided Student’s t-test). This gene list was then compared with the previously defined sub-type specific gene signatures identified by Davicioni et al. to generate a highly specific core-signature gene profile for either FN-RMS or FP-RMS (n=67 and 93 genes respectively, Fig. 6a, Supplementary Table 2). As may be expected, each core gene module was ubiquitously and similarly expressed across all cells and was highly specific to FN- or FP-RMS, which was easily visualized using dot plot expression renderings for the ten most representative genes in each signature (Fig. 6b, Extended Data Fig. 9a). Moreover, the FP-RMS core signature was significantly enriched for PAX3 regulated genes defined by Gryder et al.35 (n=40 of 93 genes, p=3.35x10⁻³², Fisher Exact Test), but also contained an even larger fraction of genes for which PAX3 is not known to regulate (n=53 genes, Fig. 6c). We next used the LISA algorithm to predict the transcriptional regulators of differentially expressed genes within each core signature. LISA queries a large dataset of well-annotated histone mark ChIP-seq and chromatin accessibility profiles to construct a chromatin model related to the regulation of queried gene lists36. LISA analysis again showed higher enrichment of PAX3 sites in the FP-RMS core genes (Fig. 6c, right panel). By contrast, the non-overlapping and the FN-RMS core signature did not have high enrichment of predicted PAX3 regulated genes.
Fig. 6.
Rhabdomyosarcoma subtypes share common gene expression patterns and are arrested at distinct stages of fetal and embryonic muscle development. a. Subtype-specific core signatures were generated from pseudo-bulk analysis of single-cell RNA-sequencing data (n=4 FP-RMS PDXs and n=6 FN-RMS PDXs). b. Dot plot renderings showing representative subtype-specific gene expression across cell states in representative FP (left, MAST95) and FN (right, MAST39) RMS. Dot size indicates the percentage of cells in each subpopulation that express the gene and shading denotes the average expression across cells. c. Venn diagram comparing the FP- and FN-core signatures with PAX3 binding genes identified by Berkeley et al.35, left. LISA analysis showing the top predicted transcription factor binding sites (TF) that regulate the FP- or FN- core genes (right). p-values noted using Fisher Exact Test. d. UMAP rendering of scRNA sequencing of embryonic (n=5 samples), fetal (n=4 samples), and adult skeletal muscle (n=4 samples), each denoted by dotted lines. n=3,251 total cells analyzed. Transitory cells are noted by arrow. Week or year of life is noted (Wk and Yr, respectively). e. Expression of combined subtype-specific core signatures (left) and representative genes (right) expressed in normal muscle development.
To test whether these subtype-specific core signatures were also enriched at specific stages of muscle development, we next mapped our FP- and FN- core RMS signatures to human embryonic, fetal, and adult muscle cell populations identified by scRNA sequencing (Fig. 6d-e)28. The FN-RMS core signature was expressed across muscle cells isolated from embryonic and fetal development, but not adult muscle (Fig. 6e, Extended Data Fig. 9b-c). By contrast, the FP-RMS core signature was enriched at a highly specific developmental stage at which embryonic muscle is transitioning to fetal muscle at 7-7.75 weeks of age. Dot plot expression renderings and TSNE plots showing representative core-signature genes confirmed expression of FN- and FP-core genes in these same stages of normal muscle development (Extended Data Fig. 9b). These findings support a model that both RMS subtypes express gene programs found in embryonic or fetal muscle, and uncovered that FP-RMS express transcriptional programs associated with a tightly controlled developmental stage at which myogenic cells transit from embryonic to fetal muscle development.
RMS share stem cell hierarchies with embryonic/fetal muscle
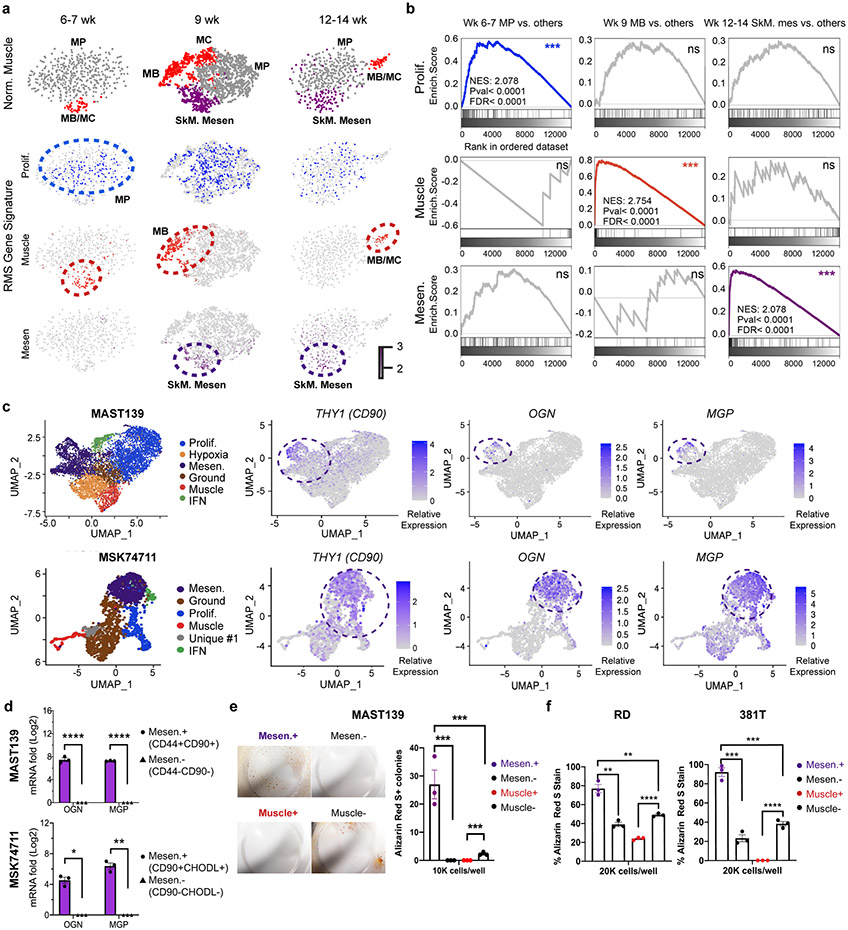
To investigate whether distinct RMS cell states mimic those found in human embryonic and fetal development, we next assessed the gene expression patterns between RMS and normal human muscle. We first quantified enrichment of our RMS transcriptional gene modules in scRNA sequencing of human muscle progenitors (MP), myocytes/myoblasts (MB/MC), and skeletal muscle mesenchymal stem/progenitor cells (SkM. Mesen) from embryonic, fetal, and adult development (Fig. 7a)28. The RMS proliferation gene module was enriched in human MP cells of 6–7-week-old-embryonic skeletal tissue (p < 0.0001, by GSEA, Fig. 7b), reflecting shared muscle-specific transcriptional programs related to cell-cycle and rapid expansion of these cells during development. By contrast, the differentiated RMS muscle transcriptional gene module was enriched within the MB/MC cells across a range of developmental time points including 6-7, 9, and 12-14 weeks of age (p < 0.0001, Fig. 7a-b).
Fig. 7.
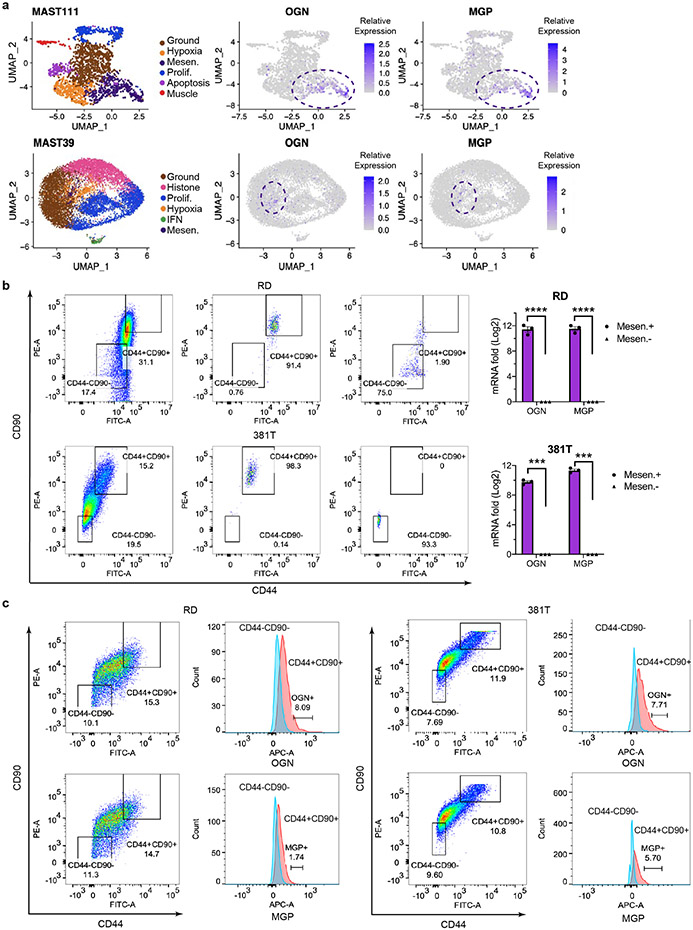
Mesenchymal-enriched FN-RMS TPCs share transcriptional and functional similarities with the bi-potent, skeletal muscle mesenchyme stem cell (SkM. Mesen). a. tSNE visualization of single cell RNA sequencing from human muscle cells (n=508 cells in 6-7 wk, n=2,345 cells in 9 wk, and n=554 cells in 12-14 wk normal muscle samples). Muscle cell states (top panels) and compared with combined gene expression for RMS cell state signatures including proliferation (Prolif.), differentiated muscle (Muscle), and Mesenchymal-like (Mes). Cells states annotated by dotted lines represent significant gene expression similarity by GSEA analysis (FDR<0.25, NES>1.5, p value<0.001). b. Representative examples of gene set enrichment analysis (GSEA) that assessed rhabdomyosarcoma cell state signature expression within the normal muscle cell subpopulations. *** denotes False discovery rate (FDR)<0.25, NES>1.5, p value<0.001. Not significant (ns). Week of life (Wk). c. UMAP visualizations showing cellular states (left) and gene expression for Osteoglycin (OGN), Matrix Gla protein (MGP), and CD90 that label mesenchymal-enriched RMS cells (right). MAST139, n=6,515 cells and MSK74711, n=2,105 cells. d. Quantitative real-time PCR validation of OGN and MGP in FACS isolated mesenchymal-enriched RMS cells from PDX MAST139 and MSK74711. Datum points show expression from three independently engrafted tumors. * p= 0.03, ** p=0.006, **** p<0.0001. e. Osteogenic differentiation assay using MAST139 cells. Representative images of MAST139 stained with Alizarin Red S after 18 days of growth in osteogenic differentiation medium (left) and quantification (right). (n=3 replicates obtained from a single tumor), *** p<0.001. f. Quantification of Alizarin Red S staining following culture of FACS isolated RD and 381T cells in osteogenic differentiation medium, n=3 replicates obtained from independent sorting of RD and 381T cells, RD Mesen+ vs. Mesen−, ** p=0.008, Mesen+ vs. Muscle−, ** p=0.008, *** p<0.001, **** p<0.0001. Mean±SEM., Statistical analysis used two-sided Student’s t-test (d,f).
GSEA analysis also showed that the mesenchymal-like RMS TPCs were highly transcriptionally similar to the recently described bi-potent Skeletal muscle mesenchymal stem/progenitor cells (SkM. Mesen cells)28. Notably, the mesenchymal-enriched TPC signature was preferentially expressed in SkM. Mesen cells at 9 and 12-14 weeks of embryonic development (p < 0.0001, FDR < 0.0001, NES: 2.078, Fig. 7a-b). Like normal SkM. Mesen cells, these mesenchymal-enriched TPCs also uniquely expressed the osteogenic genes OGN (Osteoglycin) and MGP (Matrix Gla protein, Fig. 7c, Extended Data Fig. 10a). We verified high expression of OGN and MGP in FACS isolated mesenchymal-like RMS cells using both quantitative real-time PCR and antibody co-staining following flow analysis (Fig. 7d, Extended Data Fig. 10b-c). These data verify the remarkable similarities of RMS TPCs with the SkM. Mesen cell population found in early human muscle development28. Results were further validated by performing the reciprocal gene expression analysis using gene sets enriched in developmental stages of normal muscle and querying them against our RMS cell states using GSEA (Supplementary Table 4). This analysis again showed that the early MP gene signature from 6-7 week old embryo muscle was enriched specifically in the proliferative RMS cells. By contrast, SkM. Mesenchymal cell signatures from both 9 and 12-14 week embryonic muscle were enriched only in mesenchymal-like RMS cells while myoblast/myocyte signatures from all three developmental time points were enriched only within the differentiated muscle cell states of RMS (NES>1.5, FDR<0.25, p<0.001 by GSEA, Supplementary Table 4). Thus, FN-RMS contain similar cell states as those found in early, human muscle development and contain mesenchymal-enriched RMS TPCs that are transcriptionally similar to the SkM. Mesen cells.
We next functionally assessed the ability of FN-RMS mesenchymal-enriched TPCs to generate osteogenic cell types, which would be predicted if these cells share transcriptional and function similarity with the bipotent SkM. Mesenchymal population. FACS sorted mesenchymal, differentiated muscle, or counter selected cells were isolated from FN-MAST139, RD and 381T cells and cultured in osteogenic differentiation media for 18 days (Fig. 7e-f). The mesenchymal-like cells from all three models generated significantly more Alizarin Red S+ osteogenic lineage cells, while the counter-selected and differentiated muscle cell fractions failed to efficiently generate osteogenic cells (p<0.01 by two-sided Student’s t-test for all comparisons, Fig. 7e-f). These data support a shared stem cell state and functionality between FN-RMS TPCs and the recently defined bi-potential SkM. Mesen stem cell28.
Discussion
Our work has uncovered remarkably heterogeneity in patient-derived rhabdomyosarcomas using single-cell transcriptomic profiling. Most notably, we discovered a unique mesenchymal-like cell population that expresses high transcript levels for mesenchymal genes and drives FN-RMS tumor growth. This FN-RMS TPC shares molecular, developmental, and functional similarity with the recently described human SkM. Mesen muscle stem/progenitor cell that can generate terminally-differentiated muscle and yet has bipotentiality to produce the osteogenic cells28. Indeed, our experiments showed that the mesenchymal-enriched TPCs express osteogenic lineage markers and can generate both muscle and osteogenic cells. Our results contrast with previous reports suggesting FN-RMS TPCs resemble pluripotent ES cells37 or satellite cells12,23,24, likely reflecting lack of a full molecular and transcriptional characterization of these RMS cell types or direct comparison to human muscle development at the single-cell level. Importantly, all FN-RMS studied to date contain mesenchymal-enriched tumor-propagating cells, suggesting that this cell type is found in a majority of FN-RMS and can drive tumor growth following stress.
The mesenchymal-enriched TPCs found in FN-RMS patients and PDXs do not commonly express proliferative genes such as MKI67, CCNB1, CDK1, and E2F1 (Fig. 1), indicating they are likely quiescent under normal growth conditions. This observation was supported by LARRY barcode lineage tracing where a majority of tumor growth was driven by proliferative and ground state cells. Yet, mesenchymal-enriched FN-RMS TPCs can remake tumor and produce all the cell states following growth in low-serum, stress conditions or after xenograft implantation of low numbers of cells into immune deficient mice. These largely quiescent TPCs are predicted to be more resistant to radiation and chemotherapies that kill rapidly dividing cells. Indeed, Patel et al. has identified the existence of quiescent RMS “mesodermal” cells that are therapy-resistant and marked by MEOX2 and EGFR, markers that also define the mesenchymal TPC population described here38. Discovery of this FN-RMS TPC will surely lead to new insights into therapeutic targeting of these cells and to assess their roles in driving relapse and metastasis in the future. Indeed, our work has recently shown that EGFR-targeted immunotherapies can curb RMS xenograft tumor growth in both zebrafish and mouse models39, raising the intriguing possibility that EGFR immunotherapies can specifically target and kill these FN-RMS TPCs.
We also discovered that pediatric FN- and FP-RMS express highly specific transcriptional gene programs shared with distinct stages of human muscle development. FN-RMS share transcriptional programs with both human fetal and embryonic muscle. By contrast, FP-RMS express a highly specific gene program found only in muscle cells that are transitioning from embryonic to fetal development at 7-7.75 weeks of age. Interestingly, this finding suggests that FP-RMS may develop from early muscle precursors in the first trimester and yet present clinically much later, most typically in the second decade of life 11,40. These results are also consistent with our xenograft studies showing longer latency of tumor regrowth in FP-RMS when compared with FN-RMS. Yet, given the extreme plasticity and preponderance of neural like cell states found in a majority of FP-RMS, it is also likely that a subset of FP-RMS could originate from non-muscle cell types and ultimately adopt this transitory muscle cell fate as part of the transformation process. For example, PAX3-FOXO1 and PAX7-FOXO1 elicits potent transformation of chick embryonic neural cells into alveolar rhabdomyosarcoma41 and clinical case reports have suggested a neural cell of origin in a small fraction of human FP-RMS42,43. Akin to our findings in RMS, correlative gene expression studies of normal breast epithelium and breast cancer suggests that each of the five dominant cancer subtypes segregate along the normal differentiation hierarchy and may arise from and arrest in different putative cells-of-origin44. For example, Claudin-low tumors share remarkable similarity with multipotent mammary stem cells, while other breast cancer subtypes likely arise from more differentiated luminal progenitor cells and exhibit plasticity to dedifferentiate towards a basal-like stem cell fate. These and many other studies raise the interesting possibility that a subset of human tumors arise from and arrest within tissue-restricted stem cell pools while others can adopt these cell fates as part of the transformation process.
In total, our work has uncovered a remarkable conservation of underlying cellular hierarchy between human muscle development and RMS. We have also identified a molecularly-defined and largely quiescent tumor-propagating cell in FN-RMS that shares molecular, developmental, and functional similarity to the newly described bi-potent, muscle mesenchyme stem/progenitor cell28.
Methods
Institutional approvals and sample procurement
Excess, de-identified tumor material was collected from consented patients at MGH in agreement with local institutional ethical regulations and institutional review board approval under human IRB protocol #2007P002464 (single cell RNA sequencing analysis was completed under this protocol for samples 20696, 21202, 29806, and 20082 shown in Fig. 1). Patient-derived xenografts were provided by St. Jude Children’s Research Hospital45 and Memorial-Sloan Kettering Cancer Center. These PDX models were created from tumors of consented patients under IRB approval and shared with MGH under MTA (human IRB protocol #2009P002756, PDXs used under this protocol are denoted by prefix MAST or MSK, see Supplementary Table 1). Mouse studies were approved by the MGH Institutional Animal Care and Use committee under protocol #2013N000038 (experiment #3). As outlined in animal protocol #2013N000038, mice were humanely euthanized by inhalation of CO2 or exsanguination under isoflurane anesthesia for tissue harvest if any tumor ulceration is detected, if the tumor impairs mobility, or when the tumor size reaches no greater than 4,189 mm3 ((4/3) x π x (L/2) x (W/2) x (D/2), with L≤20mm, W≤20mm) for subcutaneous xenografts. Mice on protocol would have been humanely euthanized if they exhibited clinical signs of distress including weight loss greater than 15% of body weight, lack of movement or lethargy/weakness causing inability to eat or drink water, signs of significant pain and/or distress, labored breathing. Additional criteria for euthanasia include lesions covering more than 10% of the skin, hunched posture, distended abdomen, diarrhea, coughing, central nervous system signs such as tremors, spasticity, seizures, or paralysis. In total 8 of the 229 mice followed exceeded this end points of 4,189 mm3 in Fig. 2, Fig. 5 and Extended Data Fig. 8, all of which were within the tumor volume range at the second last time point (See SourceData).
NSG mice were initially engrafted with nine frozen, independent PDXs or RD cell lines (n=3 mice/tumor, n=30 mice total). These engrafted animals were subsequently used for studies outlined in Fig. 4, 7d-e, and Extended Data Fig. 4, 5, 7, 10b-c), a subset used for bulk single cell RNA sequencing (Fig. 1, Extended Data Fig. 6f), and/or for passaging the tumors into secondary animals. Tumor growth kinetics were followed in 9 PDX models serially engrafted into NSG mice (n=54 NSG mice total, n=3 mice/dilution, two cell dilutions total, Fig. 2b). Engraftment from single cells was completed using 75 NSG mice (n=4 PDX models, each engrafted with a single tumor cell into both hind flanks, Fig. 2d). Limiting dilution cell transplantation experiments used 72 mice (n=2 PDX models, 3 cell dilutions, 3 mice/arm, 4 sorted cell populations, see Fig. 5 and Extended Data Fig. 8). In all experiments, mice were sacrificed before tumors reached 6000mm3 (See Fig. 2, Fig. 5, Fig. Extended Data Fig. 8 and corresponding Source Data files for detailed tumor volume sizes for specific experiments). Mice were housed in the MGH CCM BCL2 mouse facility within the CNY149 facility with temperature of 70°F (range of 65°-75°F), humidity at 30%-70% RH, and lighting cycle 7:00am ON-7:00pm OFF. Mice were anesthetized with 5% isoflurane for 10 minutes and then euthanized by aortic exsanguination.
Mouse xenografts
1-5 x10⁶ frozen, viable PDX cells were transplanted subcutaneously along with Matrigel into three 6-8 week-old female NOD.Cg-PrkdcscidIl2rgtm1Wjl/SzJ mice (NSG, 100 microliters). Mice were reared in a BCL2 facility as previously described46. Tumor volume was measured 2-3 times per week using caliper measure47. After developing tumors of ≤6000mm3, necropsy was performed to harvest tumor. A portion of each tumor was fixed in 4% PFA and the remaining tissue used to isolate single cells. Specifically, tumors were macerated in RPMI medium supplemented with dissociation enzymes (Miltenyi Biotec, cat No. 130-095-929) and incubated at 37°C for 20-45 minutes. Cells were then manually aspirated to disassociate clumps and filtered through 100um mesh strainer to remove tissue debris. Cell suspensions were washed once with 1xPBS at 4°C, centrifuged, and then resuspended. Dead cells were removed using a dead cell removal kit (Miltenyi Biotec, cat No. 130-090-101) and mouse cells were removed using the mouse cell depletion kit (Miltenyi Biotec, cat No. 130-104-694). Viable tumor cells were counted and resuspended to a density of 100,000 cells/mL in 1xPBS/0.04%BSA. One or two PDX engrafted tumors were analyzed by scRNA sequencing. A portion of PDX engrafted tumor cells was also transplanted again into NSG mice (1x10⁵, 1x10⁴, or single cells in matrigel). A subset of experiments also used FACS sorted cells for transplantation48. Single cell suspensions were also used for 3D sphere colony assays, q-RT-PCR experiments and/or 10X Genomics single cell sequencing. All PDX tumors were analyzed for mycoplasma contamination (MycoAlert Mycoplasma Detection Kit, Lonza); FKHR break-apart FISH to confirm fusion status49; and short-tandem repeat analysis (Human STR profiling cell authentication service, ATCC) to confirm identify of tumor samples.
Cell culture
Human fusion-negative RD (purchased from ATCC), 381T, and SMS-CTR cell lines and PDX explants were cultured in either DMEM (Gibco) supplemented with 10% FBS and 1% penicillin/streptomycin (regular growth media) or DMEM/F12 supplemented with 2% Horse Serum and 1% penicillin/streptomycin (differentiation media). Cells were dissociated by 0.05% Trypsin/0.05mM EDTA for 5 mins prior to staining, sorting, or loading into 10X Genomics for library construction. All cell line and PDX models were STR-profiled using ATCC short-tandem-repeats services and confirmed to be mycoplasma-free prior to experiments (MycoAlert Mycoplasma Detection Kit, Lonza).
Single-cell RNA sequencing
For PDX tumors, single cell suspensions were created as outlined above and then immediately processed for library preparation using 10X Genomics Chromium Chip A/B Single Cell kit and Single Cell GEM, Library & Gel Bead kit (cat No. 1000092/100075 and 1000073/1000074), according to manufacturer’s protocol. Library quantification and quality check was performed using the Agilent High Sensitivity DNA kit (Agilent # 5067-4626) and Bioanalyzer. Paired end sequencing was performed using the Illumina NextSeq 500 v2.5 High Output Kit (75 cycles), with 28 cycles for read 1, and 55 cycles for read 2, single indexed with 8 cycles, according to 10X Genomics manufactural recommendations. 45,529 cells were analyzed across the 9 PDX models with an average of 2,780 +/−1,368 genes detected per cell (<0.1% doublet rate).
Primary, snap-frozen patient samples were subjected to single-nucleus RNA-seq50. Specifically, samples were washed in 4°C 1xPBS and macerated in TST (Tween with Salts and Tris) nuclei lysis buffer50. Samples were filtered using a 40um mesh strainer to obtain single nuclei. Nuclei were immediately processed using the 10X Genomics kit for library preparation. 29,441 cells were analyzed from the four primary patient samples, with an average of 3,275 +/−1,376 genes being detected per cell (<5.23% doublet rate).
Single-cell and single-nucleus RNA-seq processing
Single cell RNA-seq raw base call (BCL) files from Illumina Basespace were demultiplexed and converted into text-based FASTQ files by using 10X Genomics Cell Ranger pipeline (v3.1.0) mkfastq command (https://support.10xgenomics.com/single-cell-gene-expression/software/downloads/3.1). Reference genome sequence and transcript annotations for sequence alignment and transcript reads were prepared. We used the human hg19 reference (STAR genome index) and transcriptome annotation from the 10x Genomics website (General Transfer Format (GTF) v3.0.0) (https://support.10xgenomics.com/single-cell-gene-expression/software/downloads/3.0) to align and quantify gene single-cell expression for the human patient derived xenograft (PDX) samples. Cells having >5% mouse reads were excluded from analysis. For the reference of single-nucleus RNA-seq, a custom ‘pre-mRNA’ human hg19 reference was built50. The Cell Ranger pipeline (v3.1.0) was then used to perform sequence alignment, basic read quality filtering, cell barcode and unique molecular identifier (UMI) counting with the corresponding species reference genomes and transcriptome annotations. Since the PDX samples might contain mouse cells, they were filtered by combing hg19 and mm10 reference from 10X genomics website (v3.0.0, https://support.10xgenomics.com/single-cell-gene-expression/software/downloads/3.0). The pipeline output for downstream analysis contains filtered cell barcodes and transcripts ids, read count per cell and gene, a web page for data quality summary including basic t-SNE for clusters and differential gene expression visualization. To detect and remove doublets we used the Single-Cell Remover of Doublets (scrublet command, v0.2.1)51. The scrublet was run as follows: expected_doublet_rate 0.06, min_counts 2, min_cells 3, min_gene_variability_pctl 85 and n_prin_comps 30.
The cells passing quality control were processed with Seurat (v3.2.2)52 under the R environment (v3.6.1). First, we removed cells with high mitochondrial ratio (>20%), low expressed gene number (<1000), high expressed gene number (>8000) and potential mouse cell (mouse reads ratio >5%). We normalized read counts using the LogNormalize function with a scaling factor 10,000, and then selected the top 2,000 variable genes across cells by using the vst method. We then regressed out unwanted covariates including nUMI, nGene, ribosome and mitochondria percentage, and optional fraction of mouse reads if PDX samples and scaled to a maximum value of 10 using ScaleData. We then performed dimensionality reduction (PCA) based on the top 1,000 variable genes. The top 20 principal components (PCs) were used for clustering. To this end we first constructed the Shared Nearest Neighbors (SNN) graph and then performed the SNN modularity optimization-based clustering with multiple resolution ranging from 0.4 to 2. Based on the same 20 PCs we generated two-dimensional embedding to visualize cells and cluster labels using the Uniform Manifold Approximation and Projection (UMAP) method30.
Cluster assignments and identifying differential expressed genes in specific cell states
Cluster assignment was assessed at 0.4, 0.6, 0.8, 1.0, 1.2, and 1.6, 1.8, 2.0 resolution to ensure accurate cluster assignment and identification meaningful cell states. The resolution of 0.8 was chosen for differential expression analysis, which maintains the resolution of clusters and avoided over-calling of cluster assignments. A custom function was implemented to calculate the log fold change and the differential proportions of cells expressing a gene and to perform Fisher’s exact test of the proportion of cells expressing or not a gene (log counts per million (CPM)) between a target cluster (foreground) and the rest of clusters (background). The p-values of the Fisher’s exact test were adjusted by the Benjamini-Hochberg (BH) to compute FDR (q-value). After iterating all clusters, the differential expressed genes were filtered genes at FDR 0.01 together with either foreground or background cells gene expression ratio more than 10%. The differentially expressed genes were analyzed using the Molecular Signatures Database v7.4 (https://www.gsea-msigdb.org/gsea/msigdb/annotate.jsp) and ClusterProfiler 53 (v3.19) 31,54,55.
To distinguish between tumor and non-tumor cells in primary tumor samples, we used Cellassign with a set of immune markers29. The final gene sets were identified from conserved clusters across tumors (>0.1 enrichment and >1.5 fold change between foreground and background cells within each tumor and >50% of cells containing the gene of interest). Seurat, ComplexHeatmap56 and SuperExactTest57 were used to visualize the normalized gene expression patterns and gene set intersection size across identified cell states. For primary patient tumor cluster annotations, we used the ClusterProfiler enrichment analysis to first assess the association of each cluster-based differentially expressed gene set with those conserved gene sets from PDX and the most significant PDX gene set (e.g., muscle) was assigned to each cluster.
Single-cell RNA sequencing data from normal muscle was also analyzed in our work and used the Drop-seq methodology28. These data were obtained from single cell sequencing of normal human muscle at 6, 6.5, 7, 7.25, 7.75, 12, 14, 17, 18 weeks, and 7, 11, 34, 42 years of age. Data was converted to a Seurat 3.0 object and processed as described above to generate an integrated UMAP embedding for the visualization of marker expression and stages. For the developmental muscle data at 6-7, 9 and 12-14 weeks, differentially expressed genes, t-SNE embedding coordinates, and normalized gene expression matrix and cell type annotations were downloaded directly from UCSC cell browser (http://cells.ucsc.edu/?ds=skeletal-muscle)28. The differentially expressed genes from different cell types and weeks were then converted to pre-ranked gene lists based on fold change and p-values. GSEA enrichment analysis was performed on these gene lists using GSEApy (https://github.com/zqfang/GSEApy) and based on our annotated RMS gene sets.
LARRY barcoding and 10X Genomics scRNA sequencing
The LARRY barcoding approach was adapted from the recently published work32 and applied to the 10X Genomics single-cell sequencing platform. An extra PCR step was used to amplify the LARRY-GFP-barcode amplicons with the Phusion TAQ polymerase enzyme. cDNA library and LARRY-GFP-barcodes were amplified using the same index. The original LARRY computational pipeline was adapted for use with the 10X Genomics single-cell sequencing platform (https://github.com/AllonKleinLab/LARRY/). The GFP UTR sequence (CGTTGCTAGGAGAGACCATATG) was used to extract the potential barcoded sequence in R2 pair-end sequences, then 29bp barcodes were identified adjacent to the 3' end of GFP UTR sequence and validated by the motif compositions (TG at 4-5bp, CA at 10-11bp, AC at 16-17bp, GA at 22-23bp, G at the last bp). Cell barcodes from R1 pair-end sequences were used to match the barcoded cells and the cells' transcriptomes. Cell states were in silico predicted using the Seurat FindClusters with resolution 0.8, and manually assigned through expert and enrichr enrichment analysis with MSigDB and internal RMS signatures. Quantitation of shared barcoded cells within the LARRY library was limited to those that contained only two cells. Significance for lineage assignment required greater than or equal to 10 daughter cells having the same barcode originating from a given parent cell state (Fig. 3E,F). Arrow direction and size indicate the percent probability of a parent cell dividing to produce a daughter cell with a specific cell fate.
Histopathology, immunofluorescence, and immunohistochemistry
PDX tumors were fixed in formalin, processed, and embedded in paraffin blocks by the Molecular Pathology Histology Core of the Massachusetts General Hospital. Serial 5um sections were prepared for H&E (hematoxylin and eosin), immunofluorescence and immunohistochemistry (IHC) staining. H&E staining was performed at the Molecular Pathology Histopathology Core at MGH, whereas IHC stain for MYOD and DESMIN were performed by Brigham and Women’s Hospital Pathology Core24,46. Histology images were taken using an Olympus BX41 microscope with CCD camera, with 20X objective. Immunofluorescence were performed in the lab with following protocol. Paraffin sections were deparaffinized in Xylene and re-hydrated using ethanol and water. Antigens were retrieved by citrate antigen retrieval buffer (pH6.0). Sections were then blocked, and incubated with primary and secondary antibodies, according to the protocol established by Isacke Lab58. A Zeiss LSM710 inverted confocal microscope was used for imaging, with 20X objective. Imaging J (v2.0.0) was used for image processing and analysis. Primary antibodies included MX1 (abcam, ab95926), TNNT3 (abcam, ab118886), NDRG1 (CST #9485T), Ki67 (CST #9449S), MF20 (R&D MAB4470) and were applied at a dilution of 1:100 in blocking buffer, PBS with 2%FCS and 1%BSA. Secondary antibodies used included Alexa Fluor 488 Goat anti-Rabbit IgG secondary antibody (Fisher Scientific A11034, 1:500 dilution in blocking buffer). or Alexa Fluor 488 Goat anti-Mouse IgG secondary antibody (Fisher Scientific A11001, 1:500 dilution in blocking buffer). IHC stained cells were quantified within the central tumor mass and invasive edge (defined by <20 cells adjacent the invasive edge) by taking images of multiple fields, performing automated cell counting using an imageJ plug in, followed by two-sided Student’s t-test comparison. Four images were analyzed per condition, ranging from 207-643 cells/field.
Fluorescence activated cell sorting (FACS)
Disassociated tumor cells from PDXs or cultured cells were stained with fluorophore-conjugated primary antibodies. Primary antibodies included PE-CD90 (BioLegend #328109), FITC-CD44 (BioLegend #338803), FITC-CHODL (abcam, ab134924), FITC-TSPAN33 (Fisher Scientific MAB8405), PE-LRRN1 (Creative Biolabs, TAB-522MZ, TB0777#281-6 (N1mAb)), PE-ERBB3 (BioLegend #324705), and FITC-LRRN1, each used at the dilution of 1:200 in sorting buffer (PBS, with 1% FBS and 1% NaN3). The antibody purification kit (ab102784) was used for antibodies that are in solution with sodium azide/glycerol which interferes with fluorophore conjugation. FITC-conjugating kit (ab102884) and PE-conjugating kit (ab102893) were used to conjugate fluorophores for some antibodies for which no commercially conjugated antibody was available. DAPI was used to counter-select dead cells.
The BD FACSAria Fusion Cell Sorter was used with nozzle size 100um. Purity check was performed after each FACS with >1x10³ cells.
Reverse Transcription and Qualitative PCR
FACS sorted cells were used in q-RT-PCR analysis (1x10⁴ cells/sample). RNA was extracted using the NEBNext Single Cell/Low Input cDNA Synthesis and Amplification Module kit (New England Biolabs # E6421S). Amplified cDNA was then used in each quantitative PCR (PowerUp SYBR Green Master Mix, Fisher Scientific A25742) reaction and run in triplicates for each primer set (Supplementary Table 5). GraphPad was used for qRT-PCR data analysis and ANOVA followed by two-sided Student’s t-test was used to compare expression levels between sorted cell populations.
Tumor sphere assays
Tumor sphere assays were performed48. Briefly, single cell suspensions obtained from FACS were immediately seeded at limiting dilution into ultra-low attachment 6-well plates. DMEM/F12 supplemented with vitamin-free B27 and bFGF (20ng/mL), EGF (10ng/mL) was used as tumorsphere medium. Tumorspheres were imaged and counted at either 10 days for cell lines or 14 days for PDXs using an inverted phase-contrast microscope. Tumorspheres with different size range were counted as small (25-50um), medium (50-100um), or large (>100um). ImageJ was used to process and analyze the images. Graphpad ANOVA and two-sided student-t-test was used for statistical analysis.
Osteogenic differentiation assay
Osteogenic differentiation was performed according to previously established protocols28,59. In our work, sorted RMS cells were seeded into collagen I coated 24-well plates, and then cultured in RPMI, supplemented with 2% FBS, beta-glycerophosphate and vitamin C for 18 days before Alizarin Red S staining. Medium were replaced every other day. Sort purity was >85% and viability >95%. Alizarin Red S was dissolved in HCl, pH4.2 and applied to 4%PFA fixed cells. Images were taken using Olympus MVX10 Microscope and Olympus DP74 Camera. Data were analyzed by Graphpad using one-way ANOVA followed by two-sided Student’s t-test calculation.
Statistics and reproducibility
Most experiments in the accompanying manuscript used a sample size of 3. This is the minimum required for running statistical analysis, is common in the field, saves on costs and animals, and does not require statistical analysis a priori to pre-determine sample size. These included in vivo transplant experiments, ex vivo tumorsphere and osteogenic differentiation assays, and qRT-PCR of sorted PDX samples. All work was replicated at least twice (in most instances three times) using biological replicates as noted in the text, with exception of mouse xenograft transplants as is customary in the field. Animals were followed for a minimum of 12 months for tumor onset and no animals were excluded from our studies.
For RMS cell line and PDX explant studies, we used G-power to calculate the sample size based on the preliminary pilot studies. Tumorsphere experiments were randomized in different wells of 6-well plates. Tumor sections of PDX samples were analyzed blinded and up to 4 images selected for imaging and downstream analysis. Quantification of all immunofluorescence images of PDX samples were performed using ImageJ and by a researcher who was blinded to patient sample and experimental information. Data distribution was assumed to be normally distributed. No data were excluded from any studies in the manuscript. In total, 1 to 2 tumors per PDX or single primary patient samples were single-cell RNA-sequenced.
Extended Data
Extended Data Fig. 1.
Frozen RMS patient samples have similar cell states as those found in PDX models and cell states contain largely similar numbers of expressed genes per cell. a-b. UMAP showing all cells sequenced from representative FN-RMS 20696. Non-tumor cells were assigned using Cellassign and clusterprofiler enricher analysis (a) and tumor cells analyzed for expression of diagnostic markers for rhabdomyosarcoma (b). c. UMAP visualization of tumor cells from primary FN-RMS 20696. d. Heatmap showing single cells (x-axis) and genes enriched for specific transcription modules (y-axis, FN-RMS 20696). Cells are arranged by UMAP clusters, combined based on expression similarity, and then assigned a specific cell state as noted. e. UMAP renderings for primary RMS samples juxtaposed with graphical analysis showing detected genes/cell when analyzed across different cell states.
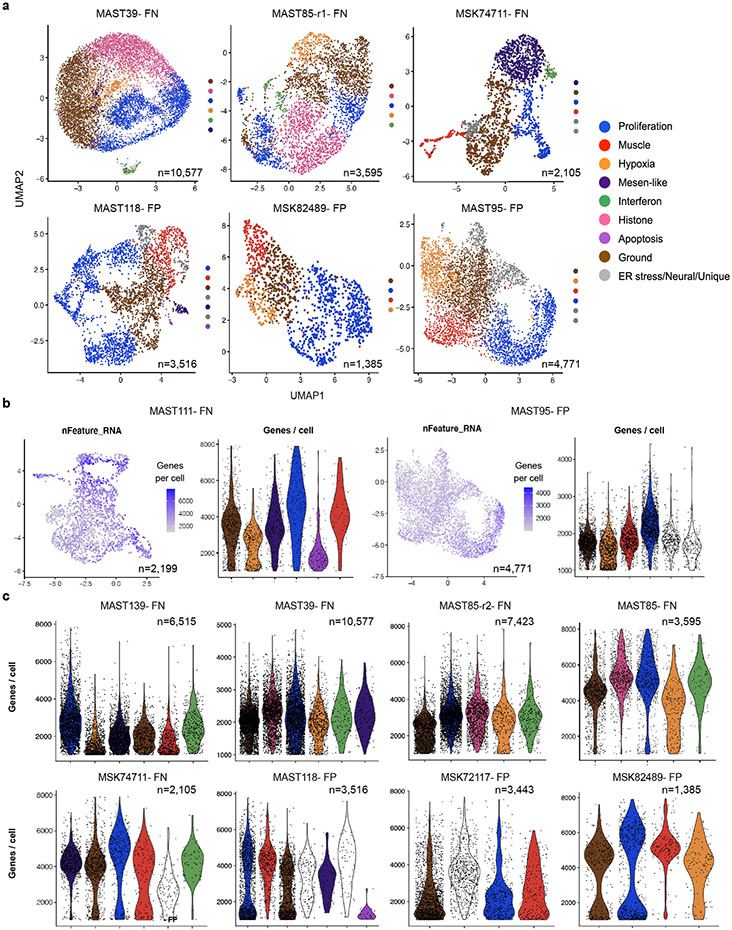
Extended Data Fig. 2.
Gene clusters identified by scRNA sequencing of RMS PDXs and expression of similar numbers of detected genes per cell across cell states. a. UMAP renderings of all PDXs, with exception of MAST111, MAST139, MAST85-r2, MSK72117, that were shown in Fig. 1a and Fig. 2d. b. Representative examples of FN-RMS (left) and FP-RMS (right). UMAP showing genes detected per cell (left). Violin plots showing genes detected within each cell for a given RMS subpopulation (right). c. All PDX models assessed by violin plots denoting the number of detected genes per cell across RMS subpopulations.
Extended Data Fig. 3.
A subset of fusion-positive RMS contain unique and tumor-specific cell clusters that express neural genes. a. Top enriched molecular signatures from MSigDB are shown for each unique cell cluster identified from individual FP-RMS PDX models. False Discovery Rate (FDR) q-values noted. Tumor and cluster number are noted (i.e., MSK74711-8). b. Venn diagram showing little overlap in gene expression across unique transcription clusters identified from different tumors. c. Upset plot quantifying the gene set enrichment of unique clusters with the GO_NEUROGENESIS gene set (p-values defined by Fisher’s Exact Test).
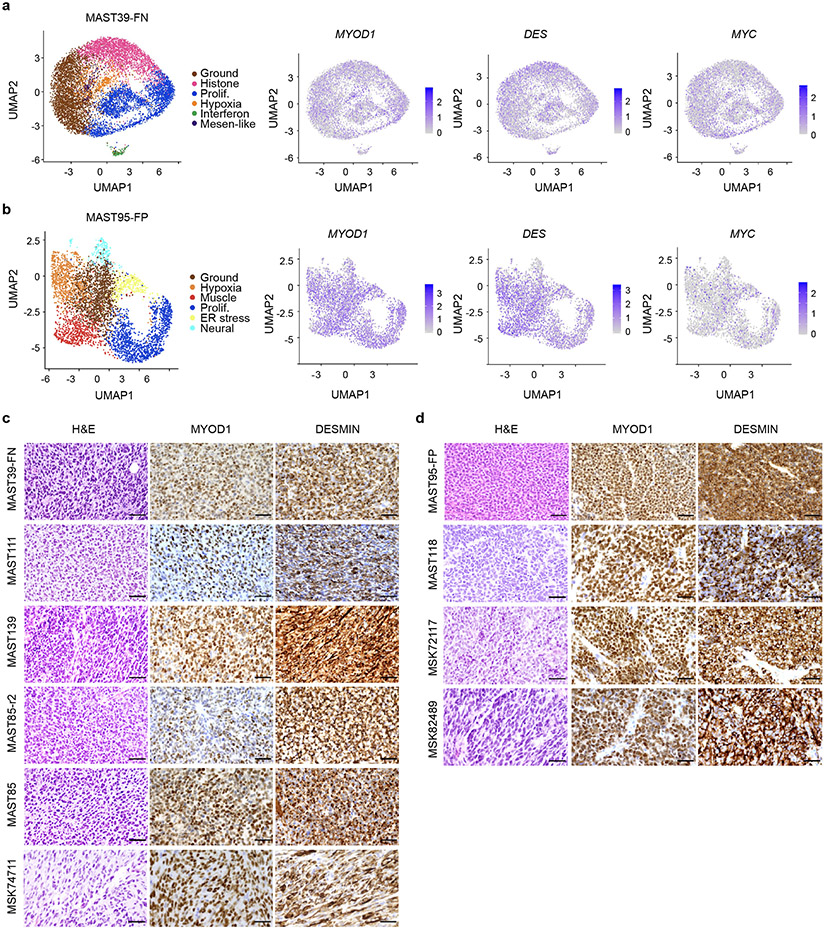
Extended Data Fig. 4.
RMS cells ubiquitously express a subset of muscle lineage and cancer-specific genes. a-b. UMAP visualizations showing cell states (left panels) and compared with gene expression for MYOD, DESMIN (DES) and MYC. Representative examples shown for fusion-negative (MAST39) and fusion-positive RMS (MAST95). c-d. Histological analysis of PDXs grown in NSG mice. Representative sections of tumors, Hematoxylin and Eosin (left) and immunohistochemistry for MYOD and DESMIN (right). Fusion-negative (FN, c) and Fusion-positive RMS (FP, d). Scale bar=50μm.
Extended Data Fig. 5.
Immunofluorescence antibody staining reveals intermingling of cell states in PDX tumors. a,c. Immunofluorescence staining within the central tumor mass (a) or at the invasive edge (c). Dashed lines indicate clustered cell populations. Arrows denote rare cells detected by IF staining. Scale bar= 50μm. b,d. Heterogeneity identified by single-cell RNA sequencing (left, b) and compared with immunofluorescence staining of the central tumor mass (b) or at the invasive edge (d, right). Color coding denotes that immunofluorescence was detected in tumor cells within the sections analyzed. Not detected (ND). Not applicable (NA). Evenly distributed through tumor (ED) or clustered (C) based on immunofluorescence staining. e-f. Quantitation of cell state percentages assessed by scRNA-sequencing or immunofluorescence. Error bar equals S.E.M. (n=4 image felids analyzed per condition, range 207-643 cells/field).
Extended Data Fig. 6.
Cell state heterogeneity in primary patient samples, PDX models, single cell engrafted tumors, and RD cells grown in mouse xenografts. a-c. 3D renderings of gene expression for muscle (x-axis), proliferation (z-axis), mesenchymal-like (y-axis) gene modules identified in RMS samples (a, FN-PDXs; b, FP-PDXs, c, primary patient samples). Individual cells are noted by dots and color coded based on cell assignments shown in Figure 1d. Not detected (ND) denotes lack of a given cell state both in the initial UMAP cell cluster annotations and in 3D gene expression space. d. Combined UMAP visualization for all parental and single cell derived PDX models. e-f. Single cell RNA sequencing of RD xenograft. Heatmap showing single cells (x-axis) and genes enriched for specific transcription modules (y-axis, e). Cells are arranged by UMAP clusters, combined based on expression similarity, and then assigned a specific cell state as noted. f. UMAP rendering of xenografted RD cells following single cell sequencing (left) and quantification of cell state composition of all 2,619 RD cells profiled (right). Similar cell states are observed in RD cells raised in 2D cell culture (See Figure 3).
Extended Data Fig. 7.
Tumor-propagating potential is enriched in the mesenchymal-enriched tumor cell fraction in FN-RMS. a, e, i ,m. Flow cytometry analysis of FN-MSK74711 cells harvested directly from PDX tumors grown in NSG mouse (a) or cell line models prior to (left) and after FACS enrichment (right two panels). b,f,j,n. Quantitative real-time PCR confirming cell state enrichment following FACS. Mean±SEM from 6 independent replicates. Two-way ANOVA followed by two-sided Student’s t-test comparison (*p<0.05, **p<0.01; ***p<0.001 and ****p<0.0001). c, g, k, o, Representative images of sphere size following FACS enrichment and plating for two weeks (scale bar=20μm). d, h, l, p, Quantification of sphere sizes. All spheres from the highest limiting dilution group were counted per condition. Shown are the average percentages by sphere size across all replicates for n=2 animals from MSK74711 (two biological replicates, 3 technical replicates per experiment). RD (two biological replicates, 3 technical replicates per experiment), 381T (two biological replicates, 3 technical replicates per experiment), and SMS-CTR cell lines (three biological replicates, 3 technical replicates per experiment). Mean±SEM noted for SMS-CTR, Two-way ANOVA followed by two-sided Student’s T test (*p<0.05, **p<0.01, ***p<0.001). Mesenchymal-enriched (Mesen, Mes, or Me), Muscle (Musc, Mu), Interferon (INF), Proliferative (Prolif).
Extended Data Fig. 8.
Limiting dilution cell transplantation confirms that mesenchymal-enriched cells from FN-RMS PDX 74711 are enriched for tumor propagating potential in vivo. a. Representative images of NSG mice engrafted with CHODL+/CD90+ mesenchymal-enriched or CHODL−/CD90− MSK74711 PDX RMS cells (all three mice from 10,000 cells/mouse group are shown). Mice were imaged at days post-transplantation as noted. Dashed lines delineate tumor. b. Latency of tumor regrowth following engraftment into NSG mice. TPC frequency+/−95% confidence interval noted per condition in parenthesis. Quantification by ELDA *, p<0.05, **, p<0.01. c. Flow analysis of tumors generated from sorted cell populations, mean±SEM noted, n=3 independent tumors, * p<0.05, ** p<0.01, *** p<0.001 by two-sided student’s t-test comparing the Mesen.+ vs. Mesen.− populations. d. Immunostaining of Ki67 proliferation and MF20 differentiation muscle markers in animals engrafted with FACs sorted cells. n= 3 independent tumors. For each tumor, four random fields were selected for quantification. mean ± SEM., * p<0.05, ** p<0.01, ***, p<0.001, by two-sided Student’s t-test.
Extended Data Fig. 9.
Subtype-specific RMS core signatures are expressed at specific muscle development stages. a,b. Dot plot renderings showing the expression of ten representative genes that comprise the fusion-negative or fusion-positive core signature across all PDXs and their identified cell states (a) and across normal muscle cells stratified by age (b). c. UMAP rendering of scRNA sequencing data from embryonic, fetal, and adult skeletal muscle showing expression of representative subtype-specific core signature genes. Week or year of life is noted (Wk and Yr, respectively).
Extended Data Fig. 10.
Osteogenic markers are expressed in the mesenchymal-enriched FN-RMS tumor propagating cells. a. TSNE renderings denoting cell state (left) and compared with OGN and MGP expression in representative FN-RMS PDXs. b. FACS sorting of RD and 381T FN-RMS cells followed by qRT-PCR validates the enrichment of osteogenic markers OGN and MGP within the mesenchymal-enriched subpopulation. qRT-PCR samples are the same as those rendered in Figure 4 and Extended Data Fig. 7, Mean±SEM across three independent biological replicates. *** p<0.001, **** p<0.0001 by ANOVA followed by two-sided Student’s T test. c. Flow cytometric analysis confirming cell surface expression of OGN and MGP in mesenchymal-enriched subfractions of RD and 381T RMS cells.
Supplementary Material
Table S1. Patient and PDX tumors.
Table S2. Genes expressed within each cell state and within the "core" signature of FN- and FP-RMS. Genes expressed in common cell states (left). Unique gene modules including neural-like states and unidentified subpopulations (middle). Fusion-Negative (FN), or Fusion-Positive (FP) gene modules shown to the right.
Supplemental Table S3. Quantification of tumor propagating cell enrichment in sorted FN-RMS cell subpopulations. Extreme limiting dilution analysis (ELDA) was used to determine the TPC frequency (TPC freq), 95% confidence interval (95% CI), and p-value (<0.05 denotes significance).
Table S4. Quantification of myogenic developmental cell signature enrichment in RMS cell subpopulations by Gene Set Enrichment Analysis (GSEA). GSEA of the top 100 genes expressed in each developmental stage and compared to the proliferation, mesen.like and muscle modules in MSK74711 and MAST139. Normalized Enrichment Scores (NES). False discovery rate (FDR). Green highlighting denotes significant enrichment (GSEA analysis, NES >+1.5, FDR<0.25, and padj<0.001). Not significant (NS).
Table S5. Quantitative real-time PCR primers.
Supplementary Fig. 1. Representative example of sorting strategy used for FACS experiments. MAST139 cells were isolated from a PDX grown in mice and live cells were gated first by size using FSC-H vs. SSC-H. Then single cells were selected based on linear relationship between SSC-H and SSC-A. Viable cells were next selected based on DAPI dye exclusion and gated based on markers of interest, in this case FITC-CD44 and PE-CD90.
Acknowledgments:
This work was supported by NIH grants R01CA154923 (D.M.L.), R01CA215118 (D.M.L.), R01CA211734 (D.M.L), U54CA231630 (D.M.L), R00HG008399 (L.P.), R35HG010717 (L.P.), and R01AR064327 (A.D.P.). Additional funding included the Liddy Shriver Sarcoma Initiative (D.M.L.), the MGH Research Scholars Program (D.M.L.), Infinite Love for Kids Fighting Cancer Grant (D.M.L., F.D.C), the Rally Foundation (D.M.L), The Truth 365 (D.M.L), the Summer’s Way/Friends of TJ Young Investigator Award (Y.W.), Tosteson & Fund for Medical Discovery Fellowship from MGH (Y.C.), the Alex’s Lemonade Stand Foundation Young Investigator Award (Y.C.) CIRM Quest DISC2-10696 (A.D.P), UCLA BSCRC (A.D.P), the Ayoub Centennial Chair (A.D.P), Paulie Strong Foundation (F.D.C), The Grayson Fund (F.D.C), Willens Family Fund (F.D.C), and Pediatric Cancer Foundation (F.D.C). We thank the MGH Department of Pathology Flow and Image Cytometry Research Core which has been supported by NIH grants 1S10OD012027-01A1, 1S10OD016372-01, 1S10RR020936-01, and 1S10RR023440-01A1. We thank Drs. Michael Dyer and Elizabeth Stewart from the Childhood Solid Tumor Network (CSTN) at St. Jude for a subset of PDX models used in this work. We thank Alison Friedmann and David Ebb from MGH Pediatric Hematology/Oncology department. We also thank Deb O’Neill and Liz Millet for helpful and stimulating discussions.
Footnotes
Competing Interests Statement: A.J.I. receives royalties from ArcherDx and consults for Paige.AI, Repare Therapeutics, Oncoclinicas Brasil, and Kinnate Biopharma. M.L.S. is an equity holder, scientific co-founder, and advisory board member of Immunitas Therapeutics. L.P. has financial interests in Edilytics and SeQure Dx, Inc. All potential competing interests are reviewed and managed by Massachusetts General Hospital and Mass General Brigham HealthCare in accordance with their conflict-of-interest policies. D.M.L receives sponsored research funds from NextCure for an unrelated project.
Data Availability
ScRNA-seq and snRNA-seq data are available at Gene Expression Omnibus (GEO) under accession #GSE195709. Source data have been provided as Source Data files. All other data supporting the findings of this study are available from the corresponding author on reasonable request.
Code Availability
All the analysis scripts have been deposited at GitHub and can be accessed using the links: https://github.com/qinqian/sc_normal_muscle, and https://github.com/qinqian/rms_analysis.
Further information on research design is available in the Nature Research Reporting Summary linked to this article.
References
- 1.Reya T, Morrison SJ, Clarke MF & Weissman IL Stem cells, cancer, and cancer stem cells. Nature 414, 105–111 (2001). [DOI] [PubMed] [Google Scholar]
- 2.Miyamoto T, Weissman IL & Akashi K AML1/ETO-expressing nonleukemic stem cells in acute myelogenous leukemia with 8;21 chromosomal translocation. Proc Natl Acad Sci U S A 97, 7521–7526, doi: 10.1073/pnas.97.13.7521 (2000). [DOI] [PMC free article] [PubMed] [Google Scholar]
- 3.Ginestier C et al. ALDH1 is a marker of normal and malignant human mammary stem cells and a predictor of poor clinical outcome. Cell Stem Cell 1, 555–567, doi: 10.1016/j.stem.2007.08.014 (2007). [DOI] [PMC free article] [PubMed] [Google Scholar]
- 4.Merlos-Suarez A et al. The intestinal stem cell signature identifies colorectal cancer stem cells and predicts disease relapse. Cell Stem Cell 8, 511–524, doi: 10.1016/j.stem.2011.02.020 (2011). [DOI] [PubMed] [Google Scholar]
- 5.Quintana E et al. Efficient tumour formation by single human melanoma cells. Nature 456, 593–598 (2008). [DOI] [PMC free article] [PubMed] [Google Scholar]
- 6.Kenney AM, Cole MD & Rowitch DH Nmyc upregulation by sonic hedgehog signaling promotes proliferation in developing cerebellar granule neuron precursors. Development 130, 15–28, doi: 10.1242/dev.00182 (2003). [DOI] [PubMed] [Google Scholar]
- 7.Gilbertson RJ & Ellison DW The origins of medulloblastoma subtypes. Annu Rev Pathol 3, 341–365, doi: 10.1146/annurev.pathmechdis.3.121806.151518 (2008). [DOI] [PubMed] [Google Scholar]
- 8.Wong DJ et al. Module map of stem cell genes guides creation of epithelial cancer stem cells. Cell Stem Cell 2, 333–344, doi: 10.1016/j.stem.2008.02.009 (2008). [DOI] [PMC free article] [PubMed] [Google Scholar]
- 9.Parham DM & Barr FG Classification of rhabdomyosarcoma and its molecular basis. Adv Anat Pathol 20, 387–397, doi: 10.1097/PAP.0b013e3182a92d0d (2013). [DOI] [PMC free article] [PubMed] [Google Scholar]
- 10.Horn RC Jr. & Enterline HT Rhabdomyosarcoma: a clinicopathological study and classification of 39 cases. Cancer 11, 181–199, doi: (1958). [DOI] [PubMed] [Google Scholar]
- 11.Yohe ME et al. Insights into pediatric rhabdomyosarcoma research: Challenges and goals. Pediatr Blood Cancer 66, e27869, doi: 10.1002/pbc.27869 (2019). [DOI] [PMC free article] [PubMed] [Google Scholar]
- 12.Langenau DM et al. Effects of RAS on the genesis of embryonal rhabdomyosarcoma. Genes Dev 21, 1382–1395 (2007). [DOI] [PMC free article] [PubMed] [Google Scholar]
- 13.Chen X et al. Targeting oxidative stress in embryonal rhabdomyosarcoma. Cancer Cell 24, 710–724, doi: 10.1016/j.ccr.2013.11.002 (2013). [DOI] [PMC free article] [PubMed] [Google Scholar]
- 14.Shern JF et al. Comprehensive genomic analysis of rhabdomyosarcoma reveals a landscape of alterations affecting a common genetic axis in fusion-positive and fusion-negative tumors. Cancer Discov 4, 216–231, doi:2159-8290.CD-13-0639 [pii] 10.1158/2159-8290.CD-13-0639 (2014). [DOI] [PMC free article] [PubMed] [Google Scholar]
- 15.Linardic CM, Downie DL, Qualman S, Bentley RC & Counter CM Genetic modeling of human rhabdomyosarcoma. Cancer Res 65, 4490–4495, doi: 10.1158/0008-5472.CAN-04-3194 (2005). [DOI] [PubMed] [Google Scholar]
- 16.Hibbitts E et al. Refinement of risk stratification for childhood rhabdomyosarcoma using FOXO1 fusion status in addition to established clinical outcome predictors: A report from the Children's Oncology Group. Cancer Med 8, 6437–6448, doi: 10.1002/cam4.2504 (2019). [DOI] [PMC free article] [PubMed] [Google Scholar]
- 17.Agaram NP et al. MYOD1-mutant spindle cell and sclerosing rhabdomyosarcoma: an aggressive subtype irrespective of age. A reappraisal for molecular classification and risk stratification. Mod Pathol 32, 27–36, doi: 10.1038/s41379-018-0120-9 (2019). [DOI] [PMC free article] [PubMed] [Google Scholar]
- 18.Sorensen PH et al. PAX3-FKHR and PAX7-FKHR gene fusions are prognostic indicators in alveolar rhabdomyosarcoma: a report from the children's oncology group. J Clin Oncol 20, 2672–2679, doi: 10.1200/JCO.2002.03.137 (2002). [DOI] [PubMed] [Google Scholar]
- 19.Heske CM et al. Survival outcomes of patients with localized FOXO1 fusion-positive rhabdomyosarcoma treated on recent clinical trials: A report from the Soft Tissue Sarcoma Committee of the Children's Oncology Group. Cancer 127, 946–956, doi: 10.1002/cncr.33334 (2021). [DOI] [PMC free article] [PubMed] [Google Scholar]
- 20.Shern JF et al. Genomic Classification and Clinical Outcome in Rhabdomyosarcoma: A Report From an International Consortium. J Clin Oncol 39, 2859–2871, doi: 10.1200/JCO.20.03060 (2021). [DOI] [PMC free article] [PubMed] [Google Scholar]
- 21.Sebire NJ & Malone M Myogenin and MyoD1 expression in paediatric rhabdomyosarcomas. J Clin Pathol 56, 412–416 (2003). [DOI] [PMC free article] [PubMed] [Google Scholar]
- 22.Tenente IM et al. Myogenic regulatory transcription factors regulate growth in rhabdomyosarcoma. Elife 6, doi: 10.7554/eLife.19214 (2017). [DOI] [PMC free article] [PubMed] [Google Scholar]
- 23.Rubin BP et al. Evidence for an unanticipated relationship between undifferentiated pleomorphic sarcoma and embryonal rhabdomyosarcoma. Cancer Cell 19, 177–191, doi: 10.1016/j.ccr.2010.12.023 (2011). [DOI] [PMC free article] [PubMed] [Google Scholar]
- 24.Ignatius MS et al. In vivo imaging of tumor-propagating cells, regional tumor heterogeneity, and dynamic cell movements in embryonal rhabdomyosarcoma. Cancer Cell 21, 680–693, doi:S1535-6108(12)00136-5 [pii] 10.1016/j.ccr.2012.03.043 (2012). [DOI] [PMC free article] [PubMed] [Google Scholar]
- 25.Hettmer S et al. Sarcomas induced in discrete subsets of prospectively isolated skeletal muscle cells. Proc Natl Acad Sci U S A 108, 20002–20007, doi:1111733108 [pii] 10.1073/pnas.1111733108 (2011). [DOI] [PMC free article] [PubMed] [Google Scholar]
- 26.Preussner J et al. Oncogenic Amplification of Zygotic Dux Factors in Regenerating p53-Deficient Muscle Stem Cells Defines a Molecular Cancer Subtype. Cell Stem Cell 23, 794–805 e794, doi: 10.1016/j.stem.2018.10.011 (2018). [DOI] [PubMed] [Google Scholar]
- 27.Drummond CJ et al. Hedgehog Pathway Drives Fusion-Negative Rhabdomyosarcoma Initiated From Non-myogenic Endothelial Progenitors. Cancer Cell 33, 108–124 e105, doi: 10.1016/j.ccell.2017.12.001 (2018). [DOI] [PMC free article] [PubMed] [Google Scholar]
- 28.Xi H et al. A Human Skeletal Muscle Atlas Identifies the Trajectories of Stem and Progenitor Cells across Development and from Human Pluripotent Stem Cells. Cell Stem Cell 27, 181–185, doi: 10.1016/j.stem.2020.06.006 (2020). [DOI] [PMC free article] [PubMed] [Google Scholar]
- 29.Zhang AW et al. Probabilistic cell-type assignment of single-cell RNA-seq for tumor microenvironment profiling. Nat Methods 16, 1007–1015, doi: 10.1038/s41592-019-0529-1 (2019). [DOI] [PMC free article] [PubMed] [Google Scholar]
- 30.Becht E et al. Dimensionality reduction for visualizing single-cell data using UMAP. Nat Biotechnol, doi: 10.1038/nbt.4314 (2018). [DOI] [PubMed] [Google Scholar]
- 31.Subramanian A et al. Gene set enrichment analysis: a knowledge-based approach for interpreting genome-wide expression profiles. Proc Natl Acad Sci U S A 102, 15545–15550 (2005). [DOI] [PMC free article] [PubMed] [Google Scholar]
- 32.Weinreb C, Rodriguez-Fraticelli A, Camargo FD & Klein AM Lineage tracing on transcriptional landscapes links state to fate during differentiation. Science 367, doi: 10.1126/science.aaw3381 (2020). [DOI] [PMC free article] [PubMed] [Google Scholar]
- 33.Chen EY et al. Glycogen synthase kinase 3 inhibitors induce the canonical WNT/β-catenin pathway to suppress growth and self-renewal in embryonal rhabdomyosarcoma. Proc Natl Acad Sci U S A 111, 5349–5354, doi: 10.1073/pnas.1317731111 (2014). [DOI] [PMC free article] [PubMed] [Google Scholar]
- 34.Davicioni E et al. Molecular classification of rhabdomyosarcoma--genotypic and phenotypic determinants of diagnosis: a report from the Children's Oncology Group. Am J Pathol 174, 550–564 (2009). [DOI] [PMC free article] [PubMed] [Google Scholar]
- 35.Gryder BE et al. PAX3-FOXO1 Establishes Myogenic Super Enhancers and Confers BET Bromodomain Vulnerability. Cancer Discov 7, 884–899, doi: 10.1158/2159-8290.CD-16-1297 (2017). [DOI] [PMC free article] [PubMed] [Google Scholar]
- 36.Qin Q et al. Lisa: inferring transcriptional regulators through integrative modeling of public chromatin accessibility and ChIP-seq data. Genome Biol 21, 32, doi: 10.1186/s13059-020-1934-6 (2020). [DOI] [PMC free article] [PubMed] [Google Scholar]
- 37.Walter D et al. CD133 positive embryonal rhabdomyosarcoma stem-like cell population is enriched in rhabdospheres. PLoS One 6, e19506, doi: 10.1371/journal.pone.0019506 (2011). [DOI] [PMC free article] [PubMed] [Google Scholar]
- 38.Patel AG et al. The Myogenesis Program Drives Clonal Selection and Drug Resistance in Rhabdomyosarcoma. bioRxiv, 2021.2006.2016.448386, doi: 10.1101/2021.06.16.448386 (2021). [DOI] [PMC free article] [PubMed] [Google Scholar]
- 39.Yan C et al. Single-cell imaging of T cell immunotherapy responses in vivo. J Exp Med 218, doi: 10.1084/jem.20210314 (2021). [DOI] [PMC free article] [PubMed] [Google Scholar]
- 40.Fletcher CDM et al. WHO classification of tumours of soft tissue and bone. (2013). [Google Scholar]
- 41.Gonzalez Curto G et al. The PAX-FOXO1s trigger fast trans-differentiation of chick embryonic neural cells into alveolar rhabdomyosarcoma with tissue invasive properties limited by S phase entry inhibition. PLoS Genet 16, e1009164, doi: 10.1371/journal.pgen.1009164 (2020). [DOI] [PMC free article] [PubMed] [Google Scholar]
- 42.Khalatbari MR, Jalaeikhoo H, Hamidi M & Moharamzad Y Primary spinal epidural rhabdomyosarcoma: a case report and review of the literature. Childs Nerv Syst 28, 1977–1980, doi: 10.1007/s00381-012-1822-9 (2012). [DOI] [PubMed] [Google Scholar]
- 43.Chikhalkar S et al. Alveolar rhabdomyosarcoma arising in a giant congenital melanocytic nevus in an adult--case report with review of literature. Int J Dermatol 52, 1372–1375, doi: 10.1111/j.1365-4632.2011.05448.x (2013). [DOI] [PubMed] [Google Scholar]
- 44.Fu NY, Nolan E, Lindeman GJ & Visvader JE Stem Cells and the Differentiation Hierarchy in Mammary Gland Development. Physiol Rev 100, 489–523, doi: 10.1152/physrev.00040.2018 (2020). [DOI] [PubMed] [Google Scholar]
- 45.Stewart E et al. Orthotopic patient-derived xenografts of paediatric solid tumours. Nature 549, 96–100, doi: 10.1038/nature23647 (2017). [DOI] [PMC free article] [PubMed] [Google Scholar]
- 46.Hayes MN et al. Vangl2/RhoA Signaling Pathway Regulates Stem Cell Self-Renewal Programs and Growth in Rhabdomyosarcoma. Cell Stem Cell 22, 414–427.e416, doi: 10.1016/j.stem.2018.02.002 (2018). [DOI] [PMC free article] [PubMed] [Google Scholar]
- 47.Tomayko MM & Reynolds CP Determination of subcutaneous tumor size in athymic (nude) mice. Cancer Chemother Pharmacol 24, 148–154, doi: 10.1007/BF00300234 (1989). [DOI] [PubMed] [Google Scholar]
- 48.Skoda J et al. Serial Xenotransplantation in NSG Mice Promotes a Hybrid Epithelial/Mesenchymal Gene Expression Signature and Stemness in Rhabdomyosarcoma Cells. Cancers (Basel) 12, doi: 10.3390/cancers12010196 (2020). [DOI] [PMC free article] [PubMed] [Google Scholar]
- 49.Mehra S et al. Detection of FOXO1 (FKHR) gene break-apart by fluorescence in situ hybridization in formalin-fixed, paraffin-embedded alveolar rhabdomyosarcomas and its clinicopathologic correlation. Diagn Mol Pathol 17, 14–20, doi: 10.1097/PDM.0b013e3181255e62 (2008). [DOI] [PubMed] [Google Scholar]
- 50.Slyper M et al. A single-cell and single-nucleus RNA-Seq toolbox for fresh and frozen human tumors. Nat Med 26, 792–802, doi: 10.1038/s41591-020-0844-1 (2020). [DOI] [PMC free article] [PubMed] [Google Scholar]
- 51.Wolock SL, Lopez R & Klein AM Scrublet: Computational Identification of Cell Doublets in Single-Cell Transcriptomic Data. Cell Syst 8, 281–291.e289, doi: 10.1016/j.cels.2018.11.005 (2019). [DOI] [PMC free article] [PubMed] [Google Scholar]
- 52.Butler A, Hoffman P, Smibert P, Papalexi E & Satija R Integrating single-cell transcriptomic data across different conditions, technologies, and species. Nat Biotechnol 36, 411–420, doi: 10.1038/nbt.4096 (2018). [DOI] [PMC free article] [PubMed] [Google Scholar]
- 53.Yu G, Wang LG, Han Y & He QY clusterProfiler: an R package for comparing biological themes among gene clusters. OMICS 16, 284–287, doi: 10.1089/omi.2011.0118 (2012). [DOI] [PMC free article] [PubMed] [Google Scholar]
- 54.Liberzon A et al. Molecular signatures database (MSigDB) 3.0. Bioinformatics 27, 1739–1740, doi: 10.1093/bioinformatics/btr260 (2011). [DOI] [PMC free article] [PubMed] [Google Scholar]
- 55.Liberzon A et al. The Molecular Signatures Database (MSigDB) hallmark gene set collection. Cell Syst 1, 417–425, doi: 10.1016/j.cels.2015.12.004 (2015). [DOI] [PMC free article] [PubMed] [Google Scholar]
- 56.Gu Z, Eils R & Schlesner M Complex heatmaps reveal patterns and correlations in multidimensional genomic data. Bioinformatics 32, 2847–2849, doi: 10.1093/bioinformatics/btw313 (2016). [DOI] [PubMed] [Google Scholar]
- 57.Wang M, Zhao Y & Zhang B Efficient Test and Visualization of Multi-Set Intersections. Sci Rep 5, 16923, doi: 10.1038/srep16923 (2015). [DOI] [PMC free article] [PubMed] [Google Scholar]
- 58.Robertson D, Savage K, Reis-Filho JS & Isacke CM Multiple immunofluorescence labelling of formalin-fixed paraffin-embedded (FFPE) tissue. BMC Cell Biol 9, 13, doi: 10.1186/1471-2121-9-13 (2008). [DOI] [PMC free article] [PubMed] [Google Scholar]
- 59.Slemmons KK et al. A method to culture human alveolar rhabdomyosarcoma cell lines as rhabdospheres demonstrates an enrichment in stemness and Notch signaling. Biol Open 10, doi: 10.1242/bio.050211 (2021). [DOI] [PMC free article] [PubMed] [Google Scholar]
- 60.Hu Y & Smyth GK ELDA: extreme limiting dilution analysis for comparing depleted and enriched populations in stem cell and other assays. J Immunol Methods 347, 70–78, doi: 10.1016/j.jim.2009.06.008 (2009). [DOI] [PubMed] [Google Scholar]
Associated Data
This section collects any data citations, data availability statements, or supplementary materials included in this article.
Supplementary Materials
Table S1. Patient and PDX tumors.
Table S2. Genes expressed within each cell state and within the "core" signature of FN- and FP-RMS. Genes expressed in common cell states (left). Unique gene modules including neural-like states and unidentified subpopulations (middle). Fusion-Negative (FN), or Fusion-Positive (FP) gene modules shown to the right.
Supplemental Table S3. Quantification of tumor propagating cell enrichment in sorted FN-RMS cell subpopulations. Extreme limiting dilution analysis (ELDA) was used to determine the TPC frequency (TPC freq), 95% confidence interval (95% CI), and p-value (<0.05 denotes significance).
Table S4. Quantification of myogenic developmental cell signature enrichment in RMS cell subpopulations by Gene Set Enrichment Analysis (GSEA). GSEA of the top 100 genes expressed in each developmental stage and compared to the proliferation, mesen.like and muscle modules in MSK74711 and MAST139. Normalized Enrichment Scores (NES). False discovery rate (FDR). Green highlighting denotes significant enrichment (GSEA analysis, NES >+1.5, FDR<0.25, and padj<0.001). Not significant (NS).
Table S5. Quantitative real-time PCR primers.
Supplementary Fig. 1. Representative example of sorting strategy used for FACS experiments. MAST139 cells were isolated from a PDX grown in mice and live cells were gated first by size using FSC-H vs. SSC-H. Then single cells were selected based on linear relationship between SSC-H and SSC-A. Viable cells were next selected based on DAPI dye exclusion and gated based on markers of interest, in this case FITC-CD44 and PE-CD90.
Data Availability Statement
ScRNA-seq and snRNA-seq data are available at Gene Expression Omnibus (GEO) under accession #GSE195709. Source data have been provided as Source Data files. All other data supporting the findings of this study are available from the corresponding author on reasonable request.
All the analysis scripts have been deposited at GitHub and can be accessed using the links: https://github.com/qinqian/sc_normal_muscle, and https://github.com/qinqian/rms_analysis.
Further information on research design is available in the Nature Research Reporting Summary linked to this article.


