

Abstract
In this study, the ethnic ratios (ERs) of oral clearance between Japanese and Western populations were subjected to model‐based meta‐analysis (MBMA) for 81 drugs evaluated in 673 clinical studies. The drugs were classified into eight groups according to the clearance mechanism, and the ER for each group was inferred together with interindividual variability (IIV), interstudy variability (ISV), and inter‐drug variability within a group (IDV) using the Markov chain Monte Carlo (MCMC) method. The ER, IIV, ISV, and IDV were dependent on the clearance mechanism, and, except for particular groups such as drugs metabolized by polymorphic enzymes or their clearance mechanism is not confirmative, the ethnic difference was found to be generally small. The IIV was well‐matched across ethnicities, and the ISV was approximately half of the IIV as the coefficient of variation. To adequately assess ethnic differences in oral clearance without false detections, phase I studies should be designed with full consideration of the mechanism of clearance. This study suggests that the methodology of classifying drugs based on the mechanism that causes ethnic differences and performing MBMA with statistical techniques such as MCMC analysis is helpful for a rational understanding of ethnic differences and for strategic drug development.
Study Highlights.
WHAT IS THE CURRENT KNOWLEDGE ON THE TOPIC?
Regarding ethnic differences in oral clearance, it is unclear what determines the difference or the extent to which it exists.
WHAT QUESTION DID THIS STUDY ADDRESS?
Although ethnic differences in apparent oral clearance (ethnic ratios [ERs] and their variability) encompass interindividual differences (IIVs), interstudy differences (ISVs), and inter‐drug differences (IDVs) in the same clearance mechanism group, modeling the hierarchical structure of the errors allowed us to separate IIVs, ISVs, and IDVs to quantitatively estimate the true ERs.
WHAT DOES THIS STUDY ADD TO OUR KNOWLEDGE?
Ethnic differences in pharmacokinetics should be examined in clinical trials with necessary statistical power considering the clearance mechanism of each drug.
HOW MIGHT THIS CHANGE DRUG DISCOVERY, DEVELOPMENT, AND/OR THERAPEUTICS?
The outcome of this study will facilitate the international development of safe and effective new drugs by enabling a rational assessment of ethnic differences in pharmacokinetics.
INTRODUCTION
Ethnic differences in the oral clearance (CLoral) of drugs are important issues for pharmaceutical industries and regulatory agencies because they may require dose adjustment for each country. The Japanese Pharmaceuticals and Medical Devices Agency (PMDA) has been requiring pharmaceutical industry phase I clinical studies to be conducted in Japanese ethnicity for decades; thus, many comparative pharmacokinetic data of Japanese and Western ethnicities are available to study the ethnic differences in the CLoral of drugs, which is currently not easy for other ethnicities. The approved dosages of some drugs differ between Japanese and Western countries 1 , 2 potentially because of ethnic differences in pharmacokinetics. 3 , 4 , 5 , 6 , 7 , 8 , 9 , 10 , 11
It is well known that the genetic polymorphism of metabolizing enzymes and transporters is ethnicity dependent and affects pharmacokinetics of various drugs. 10 , 12 Not only for these well‐known factors, nucleic receptors, 13 , 14 cytokines, 15 and microRNA, 16 which regulate the expression of metabolizing enzymes and transporters, may also cause ethnic differences in pharmacokinetics. This point is critically important for international drug development, and the reason why Japanese regulatory authorities have required studies in the Japanese population to assure the safety of drugs in their own country.
A serious concern regarding the evaluation of ethnic differences is the appropriateness of comparison between clinical studies conducted under different conditions. 17 , 18 , 19 For example, significant ethnic differences in pharmacokinetics have been previously reported for simvastatin, moxifloxacin, and meloxicam (substrates of CYP3A/OATP1B1, UGT1A1, and CYP2C9, respectively) by comparing pharmacokinetics in independent studies. Therefore, a carefully controlled study was performed to confirm ethnic differences. 20 However, unexpectedly, no noticeable ethnic difference was observed, suggesting that the previous results were likely false positives caused by interstudy variability (ISV).
A large number of clinical trials with insufficient power will probabilistically produce some false positives and negatives. However, the relationship between power and frequency of false evaluations has not been fully investigated. A basic problem is that the degree of interindividual variability (IIV) in pharmacokinetics in clinical pharmacology studies has not been systematically evaluated, and no effort has been made to distinguish between IIV and ISV.
The CLoral is theoretically total clearance divided by bioavailability, which is a product of absorption ratio (F A), intestinal availability (F G) and hepatic availability (F H). 21 Although it is not straightforward to discriminate F G and F H, their determinants are activities of various metabolism and transport. 22 Thus, the determinants of CLoral are clearances in the liver, kidneys, and small intestine, in addition to F A. Therefore, ethnic differences in CLoral should depend on the clearance mechanisms of each drug, unless F A is very small. In this study, we hypothesized that, if drugs are appropriately classified by their clearance mechanisms while excluding the low absorption drugs, the ethnic differences will be appropriately evaluated for each classification and inter‐drug differences within a group will be minimized, allowing us to evaluate interindividual and interstudy differences for each classification. For this purpose, we collected the CLoral of 81 drugs evaluated in Japanese or Western populations in this study, and assessed the degrees and variability of ethnic differences in CLoral. A structured error model was constructed, and the data were analyzed by the Gibbs sampling (GS) method, a Markov chain Monte Carlo (MCMC) method, 23 , 24 , 25 to identify interindividual, interstudy, and inter‐drug variability (IIV, ISV, and IDV, respectively) for each classification. The goal is not to precisely identify the mechanism of ethnic differences for each individual drug, but rather the question is how to evaluate the risk of ethnic differences when setting the dosage of new drugs for each country with practical resources.
METHODS
Data collection
In this study, oral drugs for which pharmacokinetic data were available for both Japanese and Western populations were collected. Japanese subjects must have been Japanese for the prior three generations by Japanese regulation, whereas ethnicity generally has not been strictly controlled in the other countries. Therefore, clinical studies conducted in Western countries were considered as conducted with Westerners. Common technical documents for new drug applications in Japan, which are available from the webpage of PMDA, were surveyed. The data were also obtained from interview forms (official explanatory documents of the drug for pharmacists in Japan) and from the literature. The “drug name pharmacokinetics” keywords were used for the PubMed literature search. Information was collected using the following inclusion criteria:
Volunteers were healthy adults and younger than 40 years old except for those taking anticancer drugs.
Studies were conducted in fasting conditions, or in fed conditions but the geometric mean ratio (GMR) of area under the curve (AUC) was within 0.8–1.25 of the AUC observed in the corresponding fasting conditions in the same ethnicity.
When AUCs of various doses were available, the data were adopted if the GMR was within 0.8–1.25 of CLoral observed in the standard dose in the same ethnicity.
Studies with immediate release formulations in which AUC included the GMR of 0.8 to 1.25 compared with the standard formulation in the same ethnicity.
The information was excluded by the following criteria.
Studies with slow‐release formulations and combination tablets.
Classification of drugs based on clearance mechanism
Drugs were classified into eight groups based on their clearance mechanism and pharmacokinetic characteristics: (A) mainly by renal excretion, (B) mixed type (by both hepatic elimination and renal excretion), (C) metabolism by CYP3A, (D) by CYP2D6, (E) by CYP2C19, (F) by other hepatic enzymes, (G) transported by OATP1B, and (H) low absorption (drugs with oral bioavailability of <1.0%). Drugs with renal excretion ratios of greater than 50% and 10%–50% were classified as (A) and (B), respectively. When only the renal excretion ratio after oral dosing was available, the value after oral dosing was divided by bioavailability to estimate the value after intravenous dosing. If bioavailability was unavailable, it was assumed to be 1.0. Drugs with a contribution ratio to CLoral 26 , 27 of more than 0.5 for each CYP isozyme or transporter were classified as (C) to (E) and (G). In other words, approximately more than two‐fold AUC increase was observed in a clinical study when a selective strong inhibitor of the corresponding clearance mechanism was administered concomitantly. 12 Other drugs eliminated via the liver are classified in (F).
Data processing
AUC of zero to infinity in single‐dose studies and AUC of dosing interval period in the steady state in repeated‐dose studies were used for CLoral calculations. When the last measured concentration was less than 1/50 of the maximum plasma concentration, an AUC of zero to the last measured time in a single‐dose study was also adopted. In this study, CLoral was not corrected by body weight because it was unavailable in many studies and the average difference in available data was only 14% lower in Japanese subjects. Regarding substrates for CYP2C19, CLoral was evaluated for each genotype in the clinical study, and CLoral was calculated as the weighted average based on the reported frequency of the genotype in each ethnicity 28 , 29 , 30 (Table 1). For substrates of CYP2D6 and OATP1B, a clinical study without genotyping was included. We assumed a logarithmic normal distribution for CLoral and, hence, the geometric mean and geometric standard deviation were collected from the reports when available (Supplementary Methods).
TABLE 1.
Frequency of alleles that affect the metabolic phenotype of CYP2C19.
| MP | GT | Frequencies | |||
|---|---|---|---|---|---|
| Western | Japanese | ||||
| GT | MP | GT | MP | ||
| EM | *1*17 | 0.3239 | 0.7319 | 0.0100 | 0.3200 |
| *17*17 | 0.0070 | – | |||
| *1*1 | 0.4010 | 0.3100 | |||
| IM | *1*2 | 0.1972 | 0.2535 | 0.3900 | 0.4900 |
| *2*17 | 0.0563 | – | |||
| *3*17 | – | – | |||
| *1*3 | – | 0.1000 | |||
| PM | *2*2 | 0.0141 | 0.0141 | 0.1300 | 0.1900 |
| *2*3 | – | 0.0400 | |||
| *3*3 | – | 0.0200 | |||
Note: CYP2C19 is well‐known for its various genotypes that affect each MP. This study concentrated on the major genotypes that are known to exist in Japanese and Whites, and their frequencies were used for calculations of oral clearance for CYP2C19, as mentioned in the Materials and Methods.
Abbreviations: EM, extensive metabolizer; GT, genotype; IM, intermediate metabolizer; MP, metabolic phenotype; PM, poor metabolizer.
The information is derived from Myrand et al. 29
Error model with multilayered structures
The structure of the error model is illustrated in Figure 1. It was assumed that logarithmic and (CLoral for study s of the d‐th drug in group g of Westerners and Japanese, respectively) follows a normal distribution, as shown in Equation 1:
| (1) |
| (2) |
FIGURE 1.

Multi‐layered error model in this study. The parameters , , , , , , and represent the unbiased estimate of inter‐individual variance, variance of mean oral clearance (CLoral), number of subjects, variance for interstudy variability, variance for inter‐drug variability, ethnic ratio of CLoral, and estimated CLoral of Western populations, respectively. The subscripts g, d, and s represent groups g, d, and s, respectively. The parameters attached to the hat represent the parameters inferred by the Markov chain Monte Carlo method.
Each symbol (letter) in the lower right corner of the formulas (g,d,s) means group ID, drug ID, and study ID, which correspond to the ID in the Supplementary File of the clinical studies, respectively. The parameters attached to the hat represent the inferred parameters. Parameters and are the variance of mean CLoral for study s of the d‐th drug in group g and variance of random effects for ISV for drugs in group g, respectively. ERg,d is a fixed effect representing the ethnic ratio (ER) of CLoral between Japanese and Western populations for the d‐th drug in group g. Parameters were calculated using the following equation:
| (3) |
where is the unbiased estimate of variance for IIV of logarithmic CLoral that was calculated for study s of the d‐th drug in group g, and is the number of subjects in the study. The interindividual variance for the d‐th drug () and that for group g () was calculated as the weighted means of for the number of subjects involved when necessary. Note that ISV is completely separated from IIV in this model. is further modeled with the mean of ER for drugs in the group (), and variance accounts for its random effect on IDV ():
| (4) |
Statistical analysis
MCMC method
In this study, GS was used to perform the MCMC method (Supplementary Methods).
Evaluation of ERs
We judged that ER was significant if its 99% credible interval (CI) did not cross 1.0 (Supplementary Methods).
Simulation analysis for method validation
The appropriateness of the application of the MCMC method to the current analysis was validated through a simulation study. A total of 100 virtual datasets were generated, in each of which the sample size was the same as (C) CYP3A, the logarithmic ER varied from −0.69 to 0.69 uniformly, and IIV, ISV, and IDV varied from 10% to 60% uniformly and independently as transformed coefficient of variation (CV). The number of drugs and studies per drug was set to 25 and six (4 Western and 2 Japanese studies), respectively. The GS model, which was the same as that used in the main analysis, was applied to each dataset, and the biases of the estimated ER, ISV, and IDV were assessed (Figure S1).
RESULTS
Information for drugs and clinical studies in the present study
Pharmacokinetic data were collected for 81 drugs from 673 studies (246 in Japanese and 427 in Western populations), enrolling 16,996 subjects (5518 Japanese and 11,478 Western; Table 2).
TABLE 2.
Number of drugs in each category classified by cleared mechanism obtained from clinical studies.
| Group | Drug | Study | Subject | ||||
|---|---|---|---|---|---|---|---|
| Japanese | Western | Total | Japanese | Western | Total | ||
| (A) CYP3A substrate | 25 | 50 | 102 | 152 | 1083 | 2227 | 3310 |
| (B) CYP2C19 substrate | 6 | 27 | 35 | 62 | 651 | 1298 | 1949 |
| (C) CYP2D6 substrate | 8 | 15 | 30 | 45 | 244 | 614 | 858 |
| (D) OATP1B substrate | 7 | 29 | 41 | 70 | 608 | 828 | 1436 |
| (E) Other hepatic clearance | 12 | 42 | 65 | 107 | 1014 | 2136 | 3150 |
| (F) Hepatic and renal mixed clearance | 11 | 39 | 96 | 135 | 910 | 2528 | 3438 |
| (G) Renal clearance | 10 | 36 | 54 | 90 | 915 | 1676 | 2591 |
| (H) Extremely low‐absorption | 2 | 8 | 4 | 12 | 93 | 171 | 264 |
| Total | 81 | 246 | 427 | 673 | 5518 | 11,478 | 16,996 |
Analysis of IDV
For the eight drug groups, the IDVs of ER and ISVs in CLoral were inferred using the MCMC method with the ERs. Based on our hypothesis, IDV should be sufficiently small when the classification is appropriate. This criterion was satisfied for the drugs eliminated by the renal route, that is (A) and (B), because the IDVs were very small, ~5% of the CV (Figure 2a). In contrast, for the drugs eliminated by the hepatic pathway, that is (C) to (G), the IDVs were larger, in the range of 10–25%. In groups metabolized by one specified metabolic enzyme, that is (C), (D), and (E), the median IDVs were less than 20%, however, in polymorphic enzymes, (D) and (E), their CIs of IDVs were larger than (C). In (F) and (G), the IDVs were the highest among the eight drug groups and varied. The IDV of the low absorption (H) group could not be calculated because only two drugs were included.
FIGURE 2.
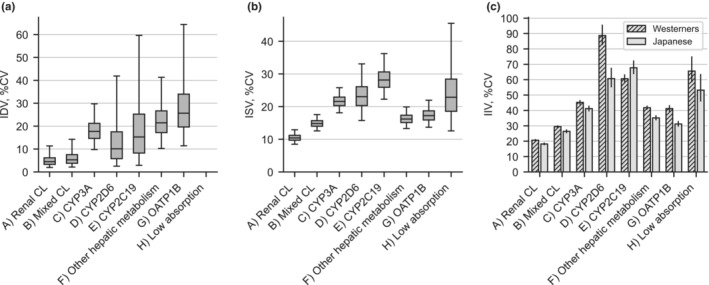
Interindividual variability (IIV), interstudy variability (ISV), and inter‐drug variability (IDV) of oral clearance in Japanese and Western populations for 81 drugs. (A) Renal clearance (CL) drugs; (B) mixed hepatic and renal CL drugs; (C) CYP3A substrates; (D) CYP2D6 substrates; (E) CYP2C19 substrates; (F) other hepatic metabolism drugs; (G) OATP1B substrates; and (H) extremely low absorption drugs. We subtracted 1.0 from exponential of the standard deviation of logarithmic CLoral and shown as a percentage. (a) IDV and (b) ISV were inferred by the Markov chain Monte Carlo (MCMC) method. The boxes and bars represent the interquartile and 2.5–97.5 percentile ranges of MCMC samples, respectively. IDV for group (H) was fixed to zero because only two drugs were included in this group. NE, not estimated. (c) IIV was calculated from the standard deviation or analogous information described in the data source. The 95% confidence interval for the variance of IIV was calculated as {(n − 1)*s 2/χ 2 (0.025), (n − 1)*s 2/χ 2 (0.975)}, where n refers to the total number of subjects included in studies, s 2 to the study‐level weighted average of the unbiased variance of lnCL, and χ 2 (0.025) and χ2 (0.975) to 2.5 and 97.5 percentiles of a chi‐square distribution with one degree of freedom, respectively. CV, coefficient of variation.
Analysis of ISV
Drugs eliminated via the renal route of (A) and (B) had small ISVs of ~15% and 10%, respectively, as CV. In contrast, the ISVs were unignorable, with ~20% of the drugs eliminated by the hepatic pathways for (C) to (G) (Figure 2b). Overall, ISVs were similar to IDVs, except for (F) and (G), in which the ISVs were smaller than the IDVs.
Analysis of IIV
The IIVs of CLoral were calculated from the results of clinical studies apart from the MCMC analysis (Figure 2c). The IIVs were small, ~20% in (A) renal excretion and 30% in (G) mixed type. The IIVs were moderate (~40%) in (C), (F), and (G), but increased to more than 60% in (D) and (E), where the frequencies of the genetic polymorphism were high. The IIV in (H) with low absorption was ~60%, and as large as (D) and (E). The trends in changes of IIV by drug groups in Japanese and Western populations were entirely the same, although they were derived from independent clinical studies, suggesting that IIV is dependent on the clearance mechanism.
Overall, the profile of group‐dependent changes in IIV was similar to that of ISV, and their values were approximately double those of the ISVs. This observation raises the concern of whether the current MCMC analysis can evaluate ISVs and IIVs separately. The simulation analysis in a later section addresses this concern.
Analysis of ER of CLoral between Western and Japanese populations
The ERs of CLoral between Western and the Japanese populations were inferred simultaneously with IDVs and ISVs using the MCMC method (Figure 3). In this study, a 99% CI was adopted considering reliability (Figure S2). The ER profile was dependent on the drug groups classified by clearance mechanism. Among the drug groups investigated in this study, ethnic group differences were evident only for (E) CYP2C19 and (H) low absorption. The median ERs were 0.58 (99% CI 0.38–0.84) for (E) and 0.26 (99% CI 0.15–0.44) for (H), respectively. In (E), the upper 99% bounds of four of the six individual drugs are less than 1.0. For the low‐absorbable bisphosphonates in (H), a remarkable ethnic difference was observed, but only two drugs were involved in this group.
FIGURE 3.

Inferred ethnic ratio of oral clearance (CL) of Japanese to Western populations for 81 drugs with the Markov chain Monte Carlo (MCMC) method. The drugs are arranged in descending order of ethnic ratio (ER) in each group. The boxes and bars represent the interquartile and 0.5–99.5 percentile (i.e., 99% credible interval) ranges of MCMC samples, respectively. The interval of 99% was adopted as a significant criterion based on a simulation study. The bar at the top of each group indicates the ER of the group representative. Boxes marked with an asterisk indicate drugs for which both Japanese and Western subjects are included in the same study. *Gefitinib is classified in the CYP3A substrate group in this study but also metabolized by CYP2D6 with almost equally contribution. 37
For the other groups, no significant ethnic differences were observed in median ERs, which were 1.01, 0.94, 0.98, 0.81, 0.89, and 0.74 for (A), (B), (C), (D), (F), and (G), respectively. Their 99% CIs as group intersected 1.0. Overall, 99% CI intersected 1.0 for 66 drugs out of the 73 drugs involved in these six groups. Exceptions were tadalafil and alprazolam in (C); eltrombopag and febuxostat in (F); and olmesartan, atorvastatin, and rosuvastatin in (G).
In Figure 3, a drug is marked if it has a study in which Japanese and Western CLs were compared using an identical protocol. The CIs of ER for these drugs were smaller than those for the other drugs, especially when the number of subjects in the study was sufficient, such as tadalafil and tolvaptan.
Simulation analysis with virtual datasets
Because ethnic differences in pharmacokinetics have not been analyzed using the MCMC method, its appropriateness was checked by a simulation study. The analysis showed that 99.2% of the ER fell within two‐fold of the true values (Figure 4a). The overall variability of residual errors for ER was 23.2% CV, suggesting that the method appropriately estimated ERs without bias. Most of the ISVs were estimated within absolute errors of ±10% CV (Figure 4b) and were not affected by IIV in either Western or Japanese subjects (Figure 4c,d). The CVs of residual errors for ISV were 4.3% and 6.4% for Western and Japanese studies, respectively (4 and 2 studies, respectively, were generated for one drug). Overall, the simulation results support the accuracy and robustness of the MCMC method applied in the current analysis.
FIGURE 4.
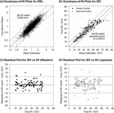
Simulation analysis for validation of the Markov chain Monte Carlo (MCMC) method. (a) Comparison of true and estimated ethnic ratios for every 25 virtual drugs in the 100 datasets. (b) Comparison of true and estimated ISV in Western (red diamond) and Japanese (blue circle) studies. (c) Dependency of the estimation of ISV on IIV in the Western study and (d) that in the Japanese study. Note that the numbers of virtual studies in a dataset were four and two for Western and Japanese studies, respectively; thus, the variability was larger in the Japanese study. CV, coefficient of variation; ER, ethnic ratio; IIV, interindividual variability; ISV, interstudy variability.
DISCUSSION
The ethnic differences between natives and foreign people have recently arisen not only in Japan, but also in other non‐Western countries. 31 On the other hand, in multi‐ethnic countries, dose adjustments among ethnic groups are a complex and difficult issue, and the need for such adjustments is rarely discussed. Nevertheless, there are cases where the Western regulatory authority required clinical trials conducted in Asia to be validated in the West. 32 Thus, a rational assessment of the significance of ethnic differences is now a critical issue for any country. Dosage should basically be determined by drug efficacy and safety, and pharmacokinetics is used as an indicator of this. In phase I studies conducted in Japan in the past, if a significant ethnic difference in CLoral is detected, subsequent clinical studies were often conducted with the adjusted dose to confirm the efficacy and safety. For this strategy to be relevant, ethnic differences should be reliably evaluated. However, the detection power of ethnic differences has not been seriously discussed under the limitations of resources allowed for phase I studies.
This study was based on the assumption that, when the activities of drug‐metabolizing enzymes and transporters depend on ethnicity because of genetics and habitual/environmental factors, their substrate drugs should share the same trend for the ER of CLoral. Accordingly, the ER, IDV, and ISV of an appropriately classified group should be useful for examining the reliability of ethnic differences evaluated in phase I studies. As expected, the analysis suggested that the profiles of IDV, ISV, and ER were noticeably dependent on the clearance mechanism of the drugs. In groups (A) and (B), IDVs were very small and ER was almost 1.0, suggesting that the classification was appropriate and the ethnic differences were small. In groups (C) to (E), the median IDVs were less than 20%, suggesting that the classification was reasonable. However, for drugs in groups (D) and (E), the estimated variances in IDV were large, likely owing to large IIVs, which inevitably resulted from a genetically polymorphic clearance mechanism. For these drugs, dose adjustments, if necessary, would be more appropriately achieved based on IIV rather than ER. However, for drugs in (G) and potentially some drugs in (F), the analysis suggested that IDV was more important than IIV. Therefore, the identification of the clearance mechanism and appropriate classification may still be an issue for drugs in these groups.
By using the information obtained in this study, ethnic differences in pharmacokinetics could be detected properly with appropriate power. For example, if a 1.5‐fold increase in ER is detected in a phase I clinical trial with a size of 10 patients per panel for a drug in the CYP3A substrate group (C), the likelihood that this is a type 1 error (false positive, α error) is only 3% when there is no ISV but is estimated to be 22% when the ISV detected is assumed (Figure S3). In addition, if 80% power (1 − β) is necessary, we can detect ERs of 1.7 or more without ISV in clinical trials of the same size, but with ISV, this number increases by as much as 2.5 (Figure S4). The maximum ER observed in (C) was 1.80‐fold (Figure 3), even considering the 99% CI; therefore, in this case, the significance of conducting the trial is questionable. In other words, when conducting local phase I studies, it is very important to minimize ISV by using the same formulation and design. For a more precise evaluation of ER, studies that enrolled both ethnicities in the same study or were conducted with the same protocol are preferable, and the CIs of ER were actually narrower when such a study was included in the evaluation (Figure 3).
Ethnic differences for the drugs in (D) and (E) were expected because CYP2D6 and CYP2C19 are ethnic‐dependent polymorphic enzymes. 6 , 10 , 33 , 34 Although the frequency of being a poor metabolizer (PM) for CYP2D6 is lower in East Asian than in Western populations, 10 , 23 the allele frequency of *10, which is responsible for an intermediate metabolizer, is abundant (38.6%) in the Japanese. 35 The clearance of CYP2D6 is decreased to one‐fourth of what or more in homozygotes of *10. 36 The median ER in (D) was 0.81, which was not significantly different from 1.0. In contrast, the PM frequency for CYP2C19 is larger in the Japanese (19%) than in Western (2%) subjects (Table 1), 10 , 28 , 29 , 30 which is consistent with the observed ER. Groups (D) and (E) were characterized by higher IIV than the other groups (Figure 2c). The IIV was smaller in Japanese than Western populations for (D), whereas the IIV was larger in Japanese than in Western populations for (E) (Figure 2c). Overall, the ER and IIV in (D) and (E) are consistent with the current knowledge of genetic polymorphisms. For drugs eliminated by polymorphic enzymes, such as (D) and (E), it seems unreasonable to adjust the doses for ethnicity based on the average difference. These drugs should be considered for the target of precision medicine with personalization of dosages based on genetic testing when necessary. The difference between the CLoral of extensive metabolizers and PMs can be predicted also from in vitro experiments 34 and simulations. 37 In the case of precision medicine, various covariates of patients, such as sex, age, and pathology, would need to be considered simultaneously.
With regard to group (G), a systematic review to address ethnic differences in the pharmacokinetic parameters of statins suggested that the hepatic clearance of statins mediated by OATP1B are ethnic dependent. 38 Although the median ER did not deviate from 1.0 for (G), the upper bound of CI less than or equal to 1.0 in three out of seven (Figure 3) resulted in the largest IDV among the drug groups investigated (Figure 2b), suggesting heterogeneous characteristics of this group. Genetic variants of OATP1B1, such as C521T (p. Val174Ala), are known to significantly influence systemic exposure to OATP1B1 substrates. 10 , 39 However, because the IIV of (G) was relatively small compared with IIV of (D) and (E), and similar to (C) and (F) both in Japanese and Western subjects (Figure 2c), it is unlikely that there are highly frequent genetic variations that impact the IIV of clearance in this group. There may be unknown variable factors of CLoral that might be related to the ethnic pharmacokinetic differences in this group. Unlike CYP substrate drugs, the CLoral of drugs in this group is not determined solely by OATP1B activity. For instance, rosuvastatin is not only a typical substrate of OATP1B and also a good substrate of BCRP. 40 Whether ethnic differences in CLoral of rosuvastatin could be attributed to the genetic polymorphisms of BCRP (C421A and Gln141Lys) 10 is still debatable. 39
The ER of CLoral was remarkably lower than 1.0 in (H), the low absorption group, in which only two bisphosphonates, alendronate and zoledronate, were included (Figure 3). Thus, the dose was 35 mg weekly in the Japanese population (half the dose compared to that in most Western countries). Because the ER of these drugs was 0.8 for systemic clearance after intravenous injection (data not shown), the ethnic differences are attributable to their absorption process from the gut. The oral availability of bisphosphonates is strongly affected by various intestinal conditions, such as meals, beverages, metal ions, gastrointestinal, and pH. 41 There are no trials comparing ethnic differences in bisphosphonates in the same trial; thus, it is possible that such factors affect the absorption between trials, resulting in ethnic differences.
The reason for the larger variability in (C) and (F) than in (A) and (B) is currently unknown. Drugs in (C) undergo intestinal metabolism because CYP3A is expressed in the intestines. In addition, efflux transporters, such as P‐gp, works by collaborating with CYP3A in the intestines. These factors may contribute to the larger variability in CLoral. The trend of a larger IDV in (F) potentially results from the clearance mechanisms being heterogeneous. Because montelukast, eltrombopag, and febuxostat in (F) are subjected to glucuronidation, a possible contributing factor may be the involvement of polymorphic glucuronosyltransferases in clearance mechanisms, such as UGT1A1*6 (211G>A), a frequent genetic variant in the Asian population. 42
Based on the results of this study, drugs in (A), (B), (C), and, with some limitations, in (F), are likely to have small ethnic differences in pharmacokinetics. Nevertheless, if the safety margin is considerably small, and ethnic differences need to be examined very precisely for drugs in these groups, sufficient statistical power should be used to avoid false evaluations. On the other hand, for drugs whose clearance is determined by transporters or unknown mechanisms, such as (G), and drugs with special pharmacokinetics, such as (H) bisphosphonates, ethnic differences in pharmacokinetics may need to be examined in local phase I studies.
This study suggests that the methodology of classifying drugs based on the mechanism that regulates pharmacokinetics and performing model‐based meta‐analysis with statistical techniques, such as MCMC analysis, is helpful for a rational understanding of ethnic differences in pharmacokinetics and for strategic drug development. We hope that this information provides a basis for global development of new drugs by selectively focusing on the resources of early clinical trials on necessary issues. In the future, when additional new information becomes available for a sufficient number of drugs and also with other ethnicities, the results of this study would be validated to further confirm that the ethnicity‐specific trends in various clearance pathways and improve the classification proposed here.
AUTHOR CONTRIBUTIONS
H. Sato, H.Y., R.T., R.M., K.M., H.K., H. Suzuki, and A.H. wrote the manuscript. R.M., H. Suzuki, and A.H. designed the research. H. Sato, R.M., and A.H. performed the research. H. Sato, R.M., H.Y., D.M.‐F., X.W., K.M., and H.K. analyzed the data.
FUNDING INFORMATION
This study was partly supported by a research grant from Japanese Research Foundation for Clinical Pharmacology, 2016.
CONFLICT OF INTEREST STATEMENT
The authors declared no competing interests for this work.
Supporting information
Appendix S1
Data S1
Sato H, Marutani R, Takaoka R, et al. Model‐based meta‐analysis of ethnic differences and their variabilities in clearance of oral drugs classified by clearance mechanism. CPT Pharmacometrics Syst Pharmacol. 2023;12:1132‐1142. doi: 10.1002/psp4.12980
REFERENCES
- 1. Arnold FL, Kusama M, Ono S. Exploring differences in drug doses between Japan and Western countries. Clin Pharmacol Ther. 2010;87:714‐720. [DOI] [PubMed] [Google Scholar]
- 2. Malinowski HJ, Westelinck A, Sato J, Ong T. Same drug, different dosing: differences in dosing for drugs approved in the United States, Europe, and Japan. J Clin Pharmacol. 2008;48:900‐908. [DOI] [PubMed] [Google Scholar]
- 3. Ahsan CH, Renwick AG, Macklin B, Challenor VF, Waller DG, George CF. Ethnic differences in the pharmacokinetics of oral nifedipine. Br J Clin Pharmacol. 1991;31:399‐403. [DOI] [PMC free article] [PubMed] [Google Scholar]
- 4. Ahsan CH, Renwick AG, Waller DG, Challenor VF, George CF, Amanullah M. The influence of dose and ethnic origins on the pharmacokinetics of nifedipine. Clin Pharmacol Ther. 1993;54:329‐338. [DOI] [PubMed] [Google Scholar]
- 5. Caraco Y, Lagerstrom PO, Wood AJ. Ethnic and genetic determinants of omeprazole disposition and effect. Clin Pharmacol Ther. 1996;60:157‐167. [DOI] [PubMed] [Google Scholar]
- 6. Andersson T, Regårdh CG, Lou YC, Zhang Y, Dahl ML, Bertilsson L. Polymorphic hydroxylation of S‐mephenytoin and omeprazole metabolism in Caucasian and Chinese subjects. Pharmacogenetics. 1992;2:25‐31. [DOI] [PubMed] [Google Scholar]
- 7. Ishizaki T, Sohn DR, Kobayashi K, et al. Interethnic differences in omeprazole metabolism in the two S‐mephenytoin hydroxylation phenotypes studied in Caucasians and Orientals. Ther Drug Monit. 1994;16:214‐215. [DOI] [PubMed] [Google Scholar]
- 8. Caraco Y, Sheller J, Wood AJ. Impact of ethnic origin and quinidine coadministration on codeine's disposition and pharmacodynamic effects. J Pharmacol Exp Ther. 1999;290:413‐422. [PubMed] [Google Scholar]
- 9. Yue QY, Svensson JO, Sjoqvist F, Sawe J. A comparison of the pharmacokinetics of codeine and its metabolites in healthy Chinese and Caucasian extensive hydroxylators of debrisoquine. Br J Clin Pharmacol. 1991;31:643‐647. [DOI] [PMC free article] [PubMed] [Google Scholar]
- 10. Kurose K, Sugiyama E, Saito Y. Population differences in major functional polymorphisms of pharmacokinetics/pharmacodynamics‐related genes in eastern Asians and Europeans: implications in the clinical trials for novel drug development. Drug Metab Pharmacokinet. 2012;27:9‐54. [DOI] [PubMed] [Google Scholar]
- 11. Fukunaga S, Kusama M, Arnold FL, Ono S. Ethnic differences in pharmacokinetics in new drug applications and approved doses in Japan. J Clin Pharmacol. 2011;51:1237‐1240. [DOI] [PubMed] [Google Scholar]
- 12. Maeda K, Sugiyama Y. Impact of genetic polymorphisms of transporters on the pharmacokinetic, pharmacodynamic and toxicological properties of anionic drugs. Drug Metab Pharmacokinet. 2008;23:223‐235. [DOI] [PubMed] [Google Scholar]
- 13. Kliewer SA, Goodwin B, Willson TM. The nuclear pregnane X receptor: a key regulator of xenobiotic metabolism. Endocr Rev. 2002;23:687‐702. [DOI] [PubMed] [Google Scholar]
- 14. Quattrochi LC, Guzelian PS. Cyp3A regulation: from pharmacology to nuclear receptors. Drug Metab Dispos. 2001;29:615‐622. [PubMed] [Google Scholar]
- 15. Fujino C, Sanoh S, Katsura T. Variation in expression of cytochrome P450 3A isoforms and toxicological effects: endo‐ and exogenous substances as regulatory factors and substrates. Biol Pharm Bull. 2021;44:1617‐1634. [DOI] [PubMed] [Google Scholar]
- 16. Takagi S, Nakajima M, Mohri T, Yokoi T. Post‐transcriptional regulation of human pregnane X receptor by micro‐RNA affects the expression of cytochrome P450 3A4. J Biol Chem. 2008;283:9674‐9680. [DOI] [PubMed] [Google Scholar]
- 17. Tabuchi H, Shiba S, Yasuda S, Ohnishi A, Shin JG. Pharmacokinetics of Perampanel in healthy Korean, White, and Japanese adult subjects. Clin Pharmacol Drug Dev. 2018;7:613‐620. [DOI] [PubMed] [Google Scholar]
- 18. Thyssen A, Sharma O, Tianmei S, et al. Pharmacokinetics of dapoxetine hydrochloride in healthy Chinese, Japanese, and Caucasian men. J Clin Pharmacol. 2010;50:1450‐1460. [DOI] [PubMed] [Google Scholar]
- 19. Devineni D, Polidori D, Curtin C, Stieltjes H, Tian H, Wajs E. Single‐dose pharmacokinetics and pharmacodynamics of canagliflozin, a selective inhibitor of sodium glucose cotransporter 2, in healthy Indian participants. Clin Ther. 2016;38:89‐98.e81. [DOI] [PubMed] [Google Scholar]
- 20. Hasunuma T, Tohkin M, Kaniwa N, et al. Absence of ethnic differences in the pharmacokinetics of moxifloxacin, simvastatin, and meloxicam among three east Asian populations and Caucasians. Br J Clin Pharmacol. 2016;81:1078‐1090. [DOI] [PMC free article] [PubMed] [Google Scholar]
- 21. Nakanishi T, Tamai I. Interaction of drug or food with drug transporters in intestine and liver. Curr Drug Metab. 2015;16:753‐764. [DOI] [PubMed] [Google Scholar]
- 22. Hisaka A, Nakamura M, Tsukihashi A, Koh S, Suzuki H. Assessment of intestinal availability (FG) of substrate drugs of cytochrome p450s by analyzing changes in pharmacokinetic properties caused by drug–drug interactions. Drug Metab Dispos. 2014;42:1640‐1645. [DOI] [PubMed] [Google Scholar]
- 23. Gelman A, Rubin DB. Markov chain Monte Carlo methods in biostatistics. Stat Methods Med Res. 1996;5:339‐355. [DOI] [PubMed] [Google Scholar]
- 24. Bolker BM, Brooks ME, Clark CJ, et al. Generalized linear mixed models: a practical guide for ecology and evolution. Trends Ecol Evol. 2009;24:127‐135. [DOI] [PubMed] [Google Scholar]
- 25. Annis J, Miller BJ, Palmeri TJ. Bayesian inference with Stan: a tutorial on adding custom distributions. Behav Res Methods. 2017;49:863‐886. [DOI] [PMC free article] [PubMed] [Google Scholar]
- 26. Hisaka A, Kusama M, Ohno Y, Sugiyama Y, Suzuki H. A proposal for a pharmacokinetic interaction significance classification system (PISCS) based on predicted drug exposure changes and its potential application to alert classifications in product labelling. Clin Pharmacokinet. 2009;48:653‐666. [DOI] [PubMed] [Google Scholar]
- 27. Ohno Y, Hisaka A, Suzuki H. General framework for the quantitative prediction of CYP3A4‐mediated oral drug interactions based on the AUC increase by coadministration of standard drugs. Clin Pharmacokinet. 2007;46:681‐696. [DOI] [PubMed] [Google Scholar]
- 28. Mizutani T. PM frequencies of major CYPs in Asians and Caucasians. Drug Metab Rev. 2003;35:99‐106. [DOI] [PubMed] [Google Scholar]
- 29. Myrand SP, Sekiguchi K, Man MZ, et al. Pharmacokinetics/genotype associations for major cytochrome P450 enzymes in native and first‐ and third‐generation Japanese populations: comparison with Korean, Chinese, and Caucasian populations. Clin Pharmacol Ther. 2008;84:347‐361. [DOI] [PubMed] [Google Scholar]
- 30. Man M, Farmen M, Dumaual C, et al. Genetic variation in metabolizing enzyme and transporter genes: comprehensive assessment in 3 major east Asian subpopulations with comparison to Caucasians and Africans. J Clin Pharmacol. 2010;50:929‐940. [DOI] [PubMed] [Google Scholar]
- 31. Rajman I, Hirano M, Honma W, Zhao S. New paradigm for expediting drug development in Asia. Drug Discov Today. 2020;25:491‐496. [DOI] [PubMed] [Google Scholar]
- 32. Ramamoorthy A, Pacanowski MA, Bull J, Zhang L. Racial/ethnic differences in drug disposition and response: review of recently approved drugs. Clin Pharmacol Ther. 2015;97:263‐273. [DOI] [PubMed] [Google Scholar]
- 33. Rendic S. Summary of information on human CYP enzymes: human P450 metabolism data. Drug Metab Rev. 2002;34:83‐448. [DOI] [PubMed] [Google Scholar]
- 34. Lee IS, Kim D. Polymorphic metabolism by functional alterations of human cytochrome P450 enzymes. Arch Pharm Res. 2011;34:1799‐1816. [DOI] [PubMed] [Google Scholar]
- 35. Kubota T, Yamaura Y, Ohkawa N, Hara H, Chiba K. Frequencies of CYP2D6 mutant alleles in a normal Japanese population and metabolic activity of dextromethorphan O‐demethylation in different CYP2D6 genotypes. Br J Clin Pharmacol. 2000;50:31‐34. [DOI] [PMC free article] [PubMed] [Google Scholar]
- 36. Tseng CY, Wang SL, Lai MD, Lai ML, Huang JD. Formation of morphine from codeine in Chinese subjects of different CYP2D6 genotypes. Clin Pharmacol Ther. 1996;60:177‐182. [DOI] [PubMed] [Google Scholar]
- 37. Chen Y, Zhou D, Tang W, Zhou W, al‐Huniti N, Masson E. Physiologically based pharmacokinetic modeling to evaluate the systemic exposure of gefitinib in CYP2D6 Ultrarapid metabolizers and extensive metabolizers. J Clin Pharmacol. 2018;58:485‐493. [DOI] [PubMed] [Google Scholar]
- 38. Tomita Y, Maeda K, Sugiyama Y. Ethnic variability in the plasma exposures of OATP1B1 substrates such as HMG‐CoA reductase inhibitors: a kinetic consideration of its mechanism. Clin Pharmacol Ther. 2013;94:37‐51. [DOI] [PubMed] [Google Scholar]
- 39. Romaine SP, Bailey KM, Hall AS, Balmforth AJ. The influence of SLCO1B1 (OATP1B1) gene polymorphisms on response to statin therapy. Pharmacogenomics J. 2010;10:1‐11. [DOI] [PubMed] [Google Scholar]
- 40. Lee E, Ryan S, Birmingham B, et al. Rosuvastatin pharmacokinetics and pharmacogenetics in white and Asian subjects residing in the same environment. Clin Pharmacol Ther. 2005;78:330‐341. [DOI] [PubMed] [Google Scholar]
- 41. Ezra A, Golomb G. Administration routes and delivery systems of bisphosphonates for the treatment of bone resorption. Adv Drug Deliv Rev. 2000;42:175‐195. [DOI] [PubMed] [Google Scholar]
- 42. Miners JO, Mackenzie PI. Drug glucuronidation in humans. Pharmacol Ther. 1991;51:347‐369. [DOI] [PubMed] [Google Scholar]
Associated Data
This section collects any data citations, data availability statements, or supplementary materials included in this article.
Supplementary Materials
Appendix S1
Data S1