

Abstract
Wearable non-invasive biosensors for the continuous monitoring of metabolites in sweat can detect a few analytes at sufficiently high concentrations, typically during vigorous exercise so as to generate sufficient quantity of the biofluid. Here, we report the design and performance of a wearable electrochemical biosensor for the continuous analysis, in sweat during physical exercise and at rest, of trace levels of multiple metabolites and nutrients, including all essential amino acids and vitamins. The biosensor consists of graphene electrodes that can be repeatedly regenerated in situ, functionalized with metabolite-specific antibody-like molecularly imprinted polymers and redox-active reporter nanoparticles, and integrated with modules for iontophoresis-based sweat induction, microfluidic sweat sampling, signal processing and calibration, and wireless communication. In volunteers, the biosensor enabled the real-time monitoring of the intake of amino acids and their levels during physical exercise, as well as the assessment of the risk of metabolic syndrome (by correlating amino acid levels in serum and sweat). The monitoring of metabolites for the early identification of abnormal health conditions could facilitate applications in precision nutrition.
Circulating nutrients are essential indicators for overall health and body function1. Amino acids (AAs), sourced from dietary intake, gut microbiota synthesis, and influenced by personal lifestyles, are important biomarkers for a number of health conditions (Fig. 1a)2. Elevated branched-chain amino acids (BCAAs) including leucine (Leu), isoleucine (Ile), and valine (Val), are associated with obesity, insulin resistance, and the future risk of type 2 diabetes mellitus (T2DM), cardiovascular diseases (CVDs), and pancreatic cancer3–5. Deficiencies in AAs (e.g., arginine and cysteine) could hamper the immune system by reducing immune-cell activation6. Tryptophan (Trp), tyrosine (Tyr) and phenylalanine (Phe) are precursors of serotonin and catecholamine neurotransmitters (dopamine, norepinephrine, and epinephrine), respectively, and play an important role in the function of complex neural systems and mental health7,8. A number of metabolic fingerprints (including Leu, Phe, and vitamin D) are linked to COVID-19 severity9,10; health disparities in nutrition also correlate well with the alarming racial and ethnic disparities that are worsened by COVID-19 vulnerability and mortality11; moreover, organ and tissue dysfunction induced by SARS-CoV-2 could result in an increased incidence of cardiometabolic diseases12.
Fig. 1 |. Schematics and images of the wearable biosensor ‘NutriTrek’.
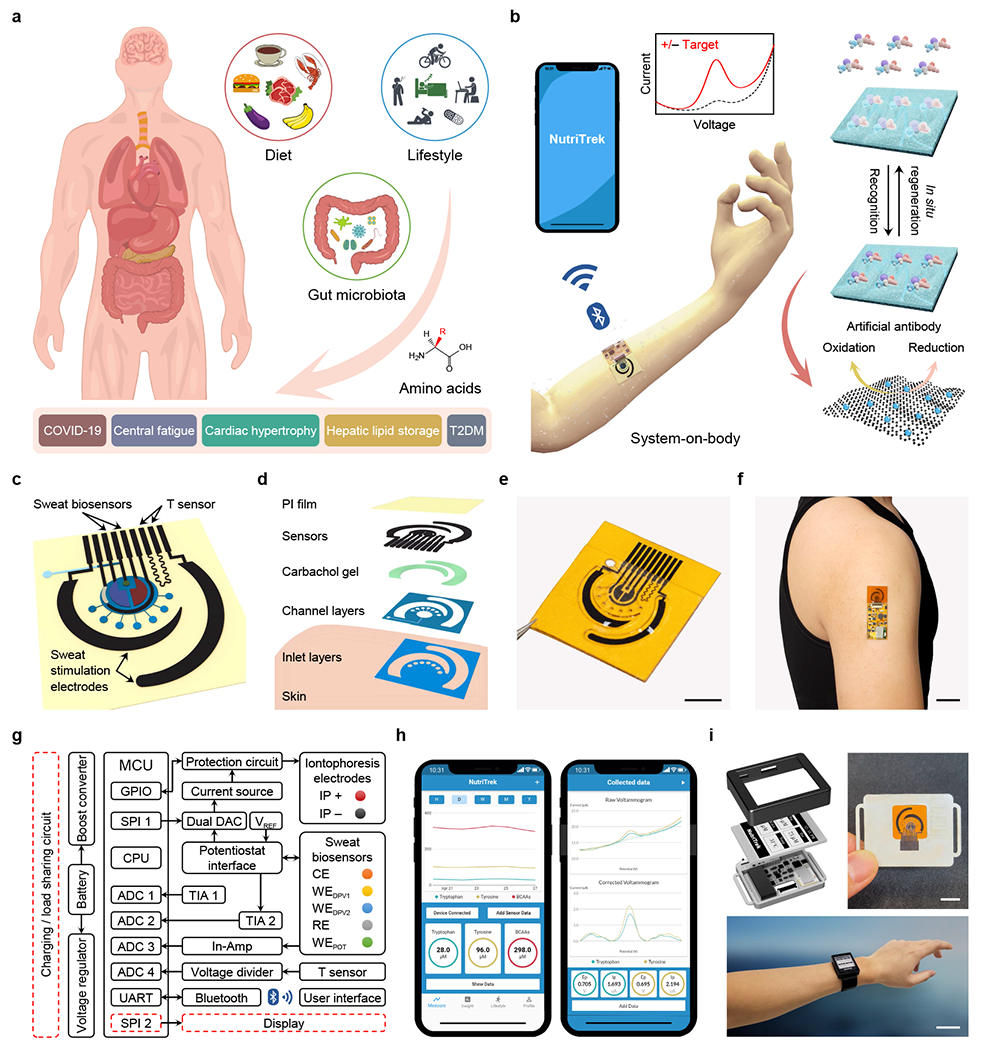
a, Circulating nutrients such as amino acids are associated with various physiological and metabolic conditions. b, Schematic of the wearable ‘NutriTrek’ that enables metabolic monitoring through a synergistic fusion of laser-engraved graphene, redox-active nanoreporters, and artificial. c,d, Schematic (c) and layer assembly (d) of the microfluidic ‘NutriTrek’ patch for sweat induction, sampling, and biosensing. T, temperature; PI, polyimide. e,f, Images of a flexible sensor patch (e) and a skin-interfaced wearable system (f). Scale bars, 5 mm (e) and 2 cm (f). g, Block diagram of electronic system of ‘NutriTrek’. The modules outlined in red dashes are included in the smartwatch version. ADC, analog-to-digital converter; DAC, digital-to-analog converter; CPU, central processing unit; GPIO, general-purpose input/output; POT, potentiometry; In-Amp, instrumentation amplifier; MCU, microcontroller; SPI, serial peripheral interface; TIA, transimpedance amplifier; UART, universal asynchronous receiver-transmitter; IP, iontophoresis; CE, counter electrode; RE, reference electrode; WE, working electrode; DPV, differential pulse voltammetry. h, Custom mobile application for real-time metabolic and nutritional tracking. i, ‘NutriTrek’ smartwatch with a disposable sensor patch and an electrophoretic display. Scale bars, 1 cm (top) and 5 cm (bottom).
Metabolic profiling and monitoring are a key approach to enabling precision nutrition and precision medicine13. Current gold standards in medical evaluation and metabolic testing heavily rely on blood analyses that are invasive and episodic, often requiring physical visits to medical facilities, labor-intensive sample processing and storage, and delicate instrumentation (e.g., gas chromatography-mass spectrometry (GC-MS))14. As the current COVID-19 pandemic remains uncontrolled around the world, there is a pressing need for developing wearable and telemedicine sensors to monitor an individual’s health state and to enable timely intervention under home- and community-based settings15–23; it is also increasingly important to monitor a person’s long-term cardiometabolic and nutritional health status after recovery from severe COVID-19 infection using wearables to capture early signs of potential endocrinological complications such as T2DM12.
Sweat is an important body fluid containing a wealth of chemicals reflective of nutritional and metabolic conditions24–27. The progression from blood analyses to wearable sweat analyses could provide great potential for non-invasive, continuous monitoring of physiological biomarkers critical to human health28–38. However, currently reported wearable electrochemical sensors primarily focus on a limited number of analytes including electrolytes, glucose, and lactate, due to the lack of a suitable continuous monitoring strategy beyond ion-selective and enzymatic electrodes or direct oxidation of electroactive molecules25–27,34–40 . Thus, most clinically relevant nutrients and metabolites in sweat are rarely explored and undetectable by existing wearable sensing technologies. Moreover, current wearable biosensors usually require vigorous exercise to access sweat; although a few recent reports use pilocarpine gel-based iontophoresis for sedentary sweat sampling22,30,36, this approach suffers from short sweat periods and low sensing accuracy due to the mixing of sweat and gel fluid and the lack of dynamic sweat sampling.
Here we present a universal wearable biosensing strategy based on a judicious combination of the mass-producible laser-engraved graphene (LEG), electrochemically synthesized redox-active nanoreporters (RARs), molecularly imprinted polymer (MIP)-based ‘artificial antibodies’, as well as unique in situ regeneration and calibration technologies (Fig. 1b). Unlike bioaffinity sensors based on antibodies or classic MIPs which are generally one-time use and require multiple washing steps in order to transduce the bioaffinity interactions in standard ionic solutions41,42, this approach enables the demonstration of sensitive, selective, and continuous monitoring of a wide range of trace-level biomarkers in biofluids including all nine essential AAs as well as vitamins, metabolites, and lipids commonly found in human sweat (Supplementary Table 1). Seamless integration of this unique approach with in situ signal processing and wireless communication leads to a powerful wearable sweat sensing technology ‘NutriTrek’ that is able to perform personalized and non-invasive metabolic and nutritional monitoring toward timely intervention (Fig. 1b). The incorporation of the carbachol iontophoresis-based sweat induction and efficient microfluidic-based surrounding sweat sampling enables prolonged autonomous and continuous molecular analysis with high temporal resolution and accuracy across activities, during physical exercise and at rest. Using five essential or conditionally essential AAs (i.e., Trp, Try, and three BCAAs (Leu, Ile, Val)) as exemplar nutrients, we corroborated the system in several human trials by enrolling both healthy subjects and patients toward personalized monitoring of central fatigue, standard dietary intakes, nutrition status, metabolic syndrome risks, and COVID-19 severity.
Results
Design and overview of the autonomous wearable biosensor technology
The flexible and disposable sensor patch consists of two carbachol-loaded iontophoresis electrodes, a multi-inlet microfluidic module, a multiplexed MIP nutrient sensor array, a temperature sensor, and an electrolyte sensor (Fig. 1c–f and Supplementary Fig. 1). All flexible electrode and sensor designs are based on the LEG which has large surface area, excellent electrochemical properties, and can be produced at a large scale directly on a polyimide substrate via CO2 laser engraving (Supplementary Fig. 2). The sensor patch can be easily attached to skin with conformal contact and interfaces with a miniaturized electronic module for on-demand iontophoresis control, in situ signal processing and wireless communication with the user interfaces through Bluetooth (Fig. 1g and Supplementary Figs. 3 and 4). A custom mobile app ‘NutriTrek’ was developed to process, display, and store the dynamic metabolic information monitored by the wearable sensors (Fig. 1h and Supplementary Video S1). The wearable system was also integrated into a smartwatch with an electronic paper display (Fig. 1i and Supplementary Fig. 5).
Biosensor design and evaluation for universal metabolic and nutritional analysis
Universal detection of AAs and other metabolites/nutrients with high sensitivity and selectivity was achieved through careful design of the selective binding MIP layer on the LEG. MIPs are chemically synthesized receptors formed by polymerizing functional monomer(s) with template molecules. Although MIP technology has been proposed for sensing, separation and diagnosis42,43, it has not yet been demonstrated for continuous wearable sensing as classic MIP sensors require washing steps for sensor regeneration and the detection is generally performed in standard buffer or redox solutions. In our case, the functional monomer (e.g., pyrrole) and crosslinker (e.g., 3-Aminophenylboronic acid) initially form a complex with the target molecule; following polymerization, their functional groups are embedded in the polymeric structure on the LEG; subsequent extraction of the target molecules reveals binding sites on the LEG-MIP electrode that are complementary in size, shape, and charge to the target analyte (Supplementary Fig. 6). Two detection strategies – direct and indirect – are designed based on the electrochemical properties of the target molecules (Fig. 2). Optimizations and characterizations of the LEG-MIP sensors are detailed in Supplementary Note 1 and Supplementary Figs. 7–13.
Fig. 2 |. Schematics and characterizations of the LEG-MIP sensors.

a, Direct detection of electroactive molecules using LEG-MIP sensors. b,c, DPV voltammograms of the LEG-MIP sensors for direct Tyr (b) and Trp (c) detection. Insets, the calibration plots with a linear fit. ∆J, peak height current density. d, In situ continuous sensing and regeneration of an LEG-MIP Trp sensor in 50 μM Trp. e, Indirect molecular detection using LEG-RAR-MIP sensors. f, LSV voltammograms of indirect Leu detection with LEG-PBNP-MIP sensors. Inset, the calibration plot with a linear fit. g,h, Indirect detection of all essential AAs (g) and multiple vitamins, lipids, and metabolites (h) using LEG-PBNP-MIP sensors. Dashed lines represent linear fit trendlines. i, Schematic of multi-MIP AA sensors. j, LSV voltammograms of a LEG multi-MIP sensor for BCAA quantification. Inset, the calibration plot with a linear fit. k, In situ continuous sensing and regeneration of an LEG-PBNP-MIP Leu sensor in 50 μM Leu. l, Repetitive CV scans of an LEG-PBNP electrode in 0.1 M KCl. m, DPV voltammograms of indirect Leu detection with LEG-AQCA-MIP sensors. Inset, the calibration plot. n, In situ regeneration of an LEG-AQCA-MIP Leu sensor in a raw sweat sample. o, Selectivity of the Trp, Tyr, Leu, Ile, Val, and BCAA sensors against other AAs. p, Validation of Tyr, Trp, and Leu sensors for analyzing raw exercise sweat samples (n=20) against GC-MS. All error bars represent the s.d. from 3 sensors.
For electroactive molecules in sweat, the oxidation of bound target molecules in the MIP template can be directly measured by differential pulse voltammetry (DPV) in which the peak current height correlates to analyte concentration (Fig. 2a). Considering that multiple electroactive molecules can be oxidized at similar potentials, this LEG-MIP approach addresses both sensitivity and selectivity issues. For example, Tyr and Trp, two AAs with close redox potentials (~0.7 V), could be detected selectively with this strategy (Fig. 2b,c and Supplementary Fig. 14). Linear relationships between peak height current densities and target concentrations with sensitivities of 0.63 μA μM−1 cm−2 and 0.71 μA μM−1 cm−2 respectively for the LEG-MIP Tyr and Trp sensors were observed (Supplementary Fig. 15). It is worth noting that choices of monomer/crosslinker/template ratios and incubation periods have substantial influences on sensor response while sample volume does not (Supplementary Fig. 10). The Tyr and Trp sensors can be readily and repeatably regenerated in situ without any washing step with a high-voltage amperometry (IT) that oxidizes the bound targets at their redox potentials (Fig. 2d).
As the majority of metabolites and nutrients (e.g., BCAAs) are non-electroactive and cannot easily be oxidized under operational conditions, we herein utilize an indirect detection approach involving an RAR layer sandwiched between the LEG and MIP layers to enable rapid quantitation (Fig. 2e). The selective adsorption of the target molecules onto the imprinted polymeric layer decreases the exposure of the RAR to the sample matrix. Controlled-potential voltammetric techniques such as DPV or linear sweeping voltammetry (LSV) can be applied to measure the RAR’s oxidization or reduction peak, where the decrease in peak height current density corresponds to an increase in analyte levels. For example, using Prussian Blue nanoparticles (PBNPs) as the RAR (Supplementary Fig. 11), we developed a MIP-LEG Leu sensor with a log-linear relationship between the peak height decrease and Leu concentration and a sensitivity of 702 nA mm−2 per decade of concentration (Fig. 2f). We established this approach to quantify the physiologically relevant range of all nine essential AAs (i.e., Leu, Ile, Val, Trp, Phe, histidine (His), lysine (Lys), methionine (Met), and threonine (Thr)) (Fig. 2g and Supplementary Fig. 16) as well as a number of vitamins, metabolites, and lipids (vitamins B6, C, D3, and E, glucose, uric acid, creatine, creatinine, and cholesterol) (Fig. 2h and Supplementary Fig. 17). In addition to these nutrients and metabolites, this approach can be easily reconfigured to enable the monitoring of a broad spectrum of biomarkers ranging from hormones (e.g., cortisol) to drugs (e.g., immunosuppressive drug mycophenolic acid) (Supplementary Fig. 18 and Supplementary Tables 2 and 3). Most of these targets are undetectable continuously by any existing wearable technology. Considering that a total level of multiple nutrients (e.g., total BCAAs) is often an important health indicator, a multi-template MIP approach can be used to enable accurate and sensitive detection of the total concentration of multiple targets with a single sensor (Fig. 2i,j). These indirect LEG-RAR-MIP sensors can be regenerated in situ upon constant potential applied to the working electrode repels the bound target molecules from the MIP layer with prolonged re-usability (Fig. 2k).
The LEG-MIP sensors show stable responses during repeatable use: The PBNPs-based RAR showed stable redox signals throughout 60 repetitive cyclic voltammetry (CV) scans (Fig. 2l and Supplementary Fig. 11); minimal output changes were observed throughout a 42-day storage period (Supplementary Fig. 19a,b); the sensors also showed no substantial relative signal shift when used continuously over 5 days (Supplementary Fig. 19c). Compared to traditional MIP preparation processes, the electrodeposited MIP layer on the mass-producible LEG leads to high reproducibility in both selectivity, sensitivity, and device to device consistency (Supplementary Figs. 20 and 21). The choice of LEG as the MIP deposition substrate also showed advantages in sensor sensitivity as compared to classic electrodes such as glassy carbon electrode, printed carbon electrode, and Au electrode (Supplementary Fig. 22). Other RARs such as the anthraquinone-2-carboxylic acid (AQCA) can also be used for indirect AA sensing with stable performance (negatively scanned DPV was used here to monitor AQCA reduction) (Fig. 2m and Supplementary Fig. 23). As illustrated in Fig. 2n, the LEG-AQCA-MIP sensors could be directly regenerated in a raw human sweat sample, resolving a main bottleneck of wearable biosensing. The MIP-LEG AA sensors have excellent selectivity for other analytes in sweat (including AAs with similar structures) at physiologically relevant concentrations (Fig. 2o, Supplementary Fig. 24, and Supplementary Table 3). The LEG-MIP technology showed a comparable sensitivity with the current gold standard laboratory-based GC-MS44 (Supplementary Fig. 25); the sensor measurements in raw human sweat samples have been validated against GC-MS (Fig. 2p, Supplementary Figs. 26 and 27).
Wearable system design for autonomous sweat induction, sampling, analysis, and calibration
To enable on-body continuous metabolic and nutritional monitoring, the flexible sensor patch was designed to comprise of an iontophoresis module for localized on-demand sweat induction, a multi-inlet microfluidic module for efficient sweat sampling, a multiplex LEG-MIP sweat nutrient sensor array for continuous AA analysis, and LEG-based temperature and electrolyte sensors for real-time AA sensor calibration (Fig. 3a). Unlike classic bioaffinity sensor’s detection in buffer or redox solutions, in situ sweat analysis poses more challenges due to complex and interpersonally varied sweat composition and demands technological innovations for accurate on-body sensing. For example, for direct LEG-MIP Trp sensing, a DPV scan in sweat even before target/MIP recognition could lead to an oxidation peak as a small amount of electroactive molecules (e.g., Trp and Tyr) can be oxidized on the surface of MIP layer; after recognition and binding of Trp into the MIP cavities, a substantially higher current peak height can be obtained; measuring difference of the two peak heights allows more accurate bound Trp measurement directly in sweat with high selectivity (Fig. 3b–d). The influence of temperature and ionic strength on the AA sensors can be calibrated in real time based on the readings from an LEG-based strain-resistive temperature sensor and an ion-selective Na+ sensor (Fig. 3e, Supplementary Fig. 28). Considering that sweat rate during exercise was reported to have influence on certain biomarker levels; we could use sweat Na+ level (which showed a linear correlation with sweat rate) to further calibrate the nutrient levels for personalized analysis. This unique transduction strategy involving both the two-step DPV scans and the temperature/electrolyte calibrations allows us to obtain accurate reading continuously in sweat during on-body use (Supplementary Fig. 29).
Fig. 3 |. Wearable system design for autonomous sweat induction, sampling, analysis, and calibration.

a, Illustration of a multifunctional wearable sensor patch. b–d, The two-scan sensor calibration strategy enabling selective Trp sensing in situ in the presence of Tyr. ∆I, peak height current; ∆I’, peak height difference caused by target recognition. Solid and dashed curves in c,d represent linear fit trendlines. e, Electrolyte calibration of the AA sensor reading, with a linear fit. f, Schematic of localized sweat sampling based on iontophoretic sweat extraction with muscarinic agents: pilocarpine and carbachol. g,h, Localized sweat rates measured from the stimulated (g) and surrounding (h) skin areas after a 5-min iontophoresis with pilocarpine and carbachol. Solid and dashed curves represent quadratic fit trendlines. S, subject. i, Numerically simulated [Trp] distributions in the microfluidic reservoir at 120 s after the inlet fluid changed from 20 to 80 μM Trp (flow rate, 1.5 μL min−1) (with varied designs in inlet number, angle span, inlet and outlet orientation). j, On-body evaluation of the optimized flexible microfluidic patch for efficient carbachol-based iontophoretic sweat induction and surrounding sampling at rest. Timestamps represent the period (min) after a 5-min iontophoresis session. Black dye was used in the reservoir to facilitate the direct visualization of sweat flow in the microfluidics. Scale bar, 3 mm.
In order to make this wearable technology broadly applicable, particularly for sedentary individuals, we utilize here a custom-designed iontophoresis module consisting of the LEG anode and cathode coupled with hydrogels containing muscarinic agent carbachol (carbagel) for sustainable sweat extraction. Carbachol was selected from various muscarinic agents as it allows the most efficient, repeatable, and long-lasting sweat secretion from the surrounding sweat gland thanks to its additional nicotinic effects45 (Fig. 3f–h, Supplementary Fig. 30, and Supplementary Note 2). In contrast, the classic sweat inducing agent – pilocarpine – used by the standard sweat test and previously reported wearable systems22,30,36 offers only a short period of sweat and very limited sweat rate from the neighboring sweat glands (Fig. 3f–h). Furthermore, sampling the mixture of the leaked sweat underneath the pilocarpine gel and the gel fluid could result in substantial wearable sensor errors and fail to provide real-time information due to the absence of efficient sweat refreshing. A very small current (50–100 μA) is used for our iontophoresis module, as compared to commonly used 1–1.5 mA22,30,36, greatly reducing the risks of skin irritation. To maximize the efficiency of low-volume sweat sampling and improve the temporal resolution of wearable sensing, a compact and flexible microfluidic module was carefully designed to isolate sweat sampling areas from iontophoresis gels. Numerical simulations were performed to optimize the geometric design of the microfluidic module, including inlet numbers, angle span, orientation, and flow direction with respect to the reservoir geometry (Fig. 3i, Supplementary Note 3, Supplementary Figs. 31 and 32, Supplementary Video 2, and Supplementary Table 4). With the optimized design for sweat induction and sampling, sweat can be conveniently induced locally and readily sampled with the multi-inlet microfluidics over a prolonged period (Fig. 3g,j, Supplementary Fig. 33, and Supplementary Video 3). At the physiological sweat rates ranging from 0.15 μL min−1 to 3 μL min−1, our wearable sensor patch could provide reliable and accurate analysis of the dynamic changes of the AA levels (Supplementary Figs. 34 and 35).
Evaluation of the wearable system for dynamic physiological and nutritional monitoring
Evaluation of the wearable system was conducted first via sensing of sweat Trp and Tyr in human subjects during a constant-load cycling exercise trial (Fig. 4a–d and Supplementary Fig. 36). The DPV data from the sensors were wirelessly transmitted along with temperature and Na+ sensor readings to the mobile app that automatically extracted the oxidation peaks using a custom developed iterative baseline correction algorithm (Fig. 4e and Supplementary Fig. 37) and performed calibration for the accurate quantification of sweat Tyr and Trp. Considering that AAs (e.g., Try and BCAAs) play a crucial role in central fatigue during physical exercise46, a flexible Trp and BCAA sensor array was used to monitor the AA dynamics during vigorous exercise (Fig. 4f–j and Supplementary Fig. 38). Both Trp and BCAA levels decreased during the exercise due to the serotonin synthesis and BCAA ingestion, respectively. The increased sweat Trp/BCAA ratio was observed which could potentially serve as an indicator for central fatigue, in agreement with a previous report on its plasma counterpart46.
Fig. 4 |. Wearable system evaluation across activities toward prolonged physiological and nutritional monitoring.
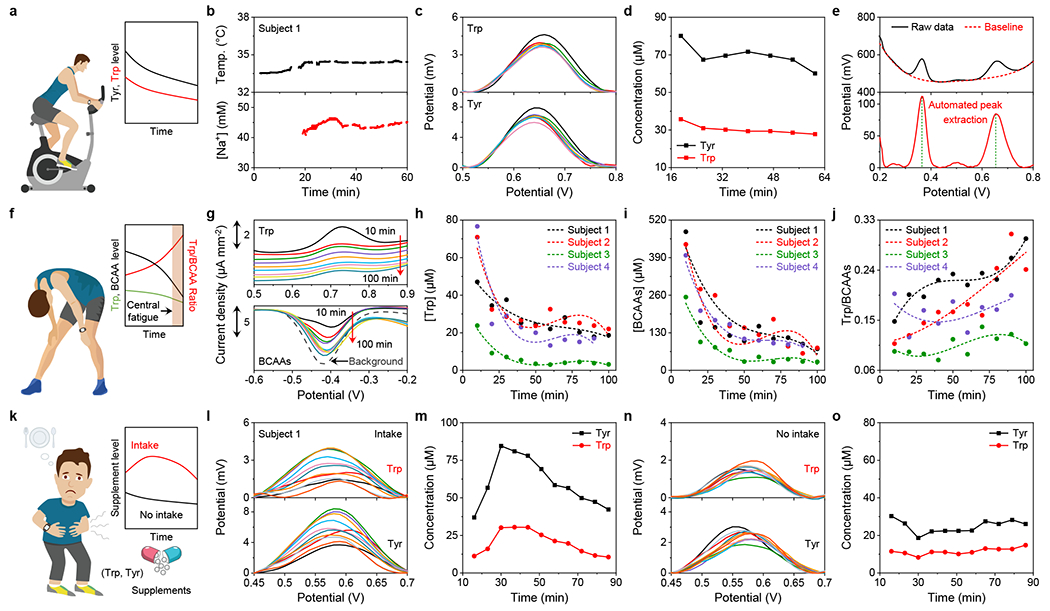
a–d, Continuous on-body Trp and Tyr analysis using a wearable sensor array with real-time sensor calibrations during cycling exercise. e, Custom voltammogram analysis with an automatic peak extraction strategy based on a polynomial fitting and cut-off procedure. f–j, Dynamic sweat Trp and BCAA analysis during physical exercise toward central fatigue monitoring. Dashed lines in h–j represent quadratic fit trendlines. k–o, Dynamic analysis of sweat AA levels with and without Trp and Tyr supplement intake at rest toward personalized nutritional monitoring.
The wearable iontophoresis-integrated patch enables daily continuous AA monitoring at rest beyond the physical exercise. As illustrated in Fig. 4k–o and Supplementary Figs. 39–42, rising Trp and Tyr levels in sweat were observed from all four subjects after Trp and Tyr supplement intake while the readings from the sensors remained stable during the studies without intake. Such capability opens the door for personalized nutritional monitoring and management through personalized sensor-guided dietary intervention. It should be noted that our pilot study showed that sweat nutrient and electrolyte levels were independent of sweat rate changes during the carbachol-based iontophoresis-induced sweat (Supplementary Fig. 43).
Personalized monitoring of metabolic syndrome risk factors using the wireless biosensors
Metabolic syndrome, characterized by abdominal obesity and insulin resistance, is now on the rise as the leading cause of morbidity and mortality, affecting more than a third of all U.S. adults47. Elevated circulating BCAAs levels are predictive of insulin-resistant obesity, metabolic syndrome, and linked to CVDs and T2DM (Fig. 5a and Supplementary Note 4)3,4, which could lead to potential complications of severe COVID-1912. Recent studies have shown the potential use of BCAAs supplementation as dietary intervention to ameliorate insulin resistance48. Monitoring changes in essential nutrient levels provides a highly sensitive early detection of metabolic syndrome risks, enabling effective personalized dietary intervention (Fig. 5b). To explore the use of sweat BCAAs as a non-invasive risk factor of metabolic syndrome, we performed a pilot study to investigate the correlations between serum and sweat BCAAs involving three groups of subjects: normal weight (I, n=10), overweight/obesity (II, n=7), and obesity with T2DM (III, n=3) (Fig. 5c,d). Positive Pearson correlation coefficients of 0.66 (n=65) and 0.69 (n=65) were observed between sweat and serum levels (all analyzed by the sensors) of Leu and total BCAA, respectively (Fig. 5c). Compared to healthy participants in Group I, substantially elevated sweat and serum Leu levels (analyzed by the sensors) were observed in Group II and III (Fig. 5d), consistent with previous reports that higher circulating BCAA levels were identified in individuals with obesity and T2DM3. Considering the well-established role of BCAAs on insulin production and inhibition of glycogenolysis, we also investigated the postprandial response of sweat Leu/BCAAs and blood glucose/insulin after BCAA supplement and dietary intake on healthy subjects (Fig. 5e,f). All biomarkers remained stable during fasting period; protein diet intake resulted in the increase of both blood glucose and insulin while BCAA intake only led to a rapid insulin increase. In both studies, sweat Leu and BCAAs increased first in the 30–60 min and then decreased. For subjects with different metabolic conditions, Leu levels in iontophoretic sweat after BCAA vary differently: although substantial increase in sweat Leu levels were observed in all cases, healthy subjects showed a drastic percentage fluctuation and individuals with obesity/T2DM showed blunted fluctuation that may indicate the different metabolic stage of BCAA in those individuals (Fig. 5g).
Fig. 5 |. Personalized monitoring of metabolic syndrome risk factors using the LEG-MIP BCAA sensors.

a, Elevated BCAA levels identified in individuals with obesity and/or T2DM. b, The close associations between BCAA metabolism and insulin response in healthy and obesity/T2DM groups. c, Correlation of serum and sweat total BCAA and Leu levels obtained with the LEG-MIP sensors (n=65). Dashed lines represent linear fit trendlines. d, Box-and-whisker plot of measured Leu levels in iontophoresis-extracted sweat and serum in three groups of participants: normal weight (Group I, n=10), overweight or obesity (Group II, n=7), and obesity with T2DM (Group III, n=3), The bottom whisker represents the minima; the top whisker represents the maxima; and the square in the box represents the mean. e,f, Dynamic changes of sweat Leu and total BCAAs, serum insulin (Ins), and blood glucose (BG) levels from two healthy subjects with 5 g BCAAs (e) and a standard protein diet (f) intakes. g, Sweat Leu dynamics collected from Groups I–III after the 5 g BCAAs intake. Inset, the ratio of the Leu level at 50-min after BCAA intake and the level before intake. h, Evaluation of Leu as a metabolic fingerprint for COVID-19 severity in serum samples from COVID-19 negative subjects (n=8) and COVID-19 positive patients (n=8). Error bars represent the s.d. from 3 measurements.
Considering that circulating elevated Leu has been reported as a key metabolic fingerprint for the COVID-19 severity, we also evaluated our biosensors for analyzing the samples from patients with COVID-19 and healthy individuals; substantially elevated Leu levels were identified in from COVID-19 positive samples as compared to the negative ones (415.6 ± 133.7 μM vs. 151.5 ± 36.0 μM), indicating the great potential of our biosensors for at-home COVID-19 monitoring and management (Fig. 5h).
Discussion
Circulating metabolic biomarkers, such as amino acids and vitamins, have been associated with various health conditions, such as diabetes and cardiovascular diseases. Metabolic profiling using wearable sensors has become increasingly crucial in precision nutrition and precision medicine, especially in the era of COVID-19 pandemic, as it provides not only insights into COVID-19 severity but also guidance to stay metabolically healthy to minimize the risk of potential COVID-19 infections. As the pandemic remains rampant in the world and the regular medical services could be in shortage, it is of urgent need to develop and apply wearable sensors that can monitor health conditions via metabolic profiling so that at-home diagnosis and timely intervention via telemedicine could be achieved. However, current wearable electrochemical sensors are limited to a narrow range of detection targets due to lack of continuous sensing strategies beyond ion-selective and enzymatic electrodes. Though various bio-affinity based sensors have been developed to detect a broader spectrum of targets using antibodies or MIPs, they generally require multiple washing steps or provide only one-time use; these limitations have hampered their useability in wearable devices. Moreover, the majority of wearable biosensors rely on vigorous exercise to access sweat and are not suitable for daily continuous use.
By integrating the mass-producible LEG, electrochemically synthesized RARs, and ‘artificial antibodies’, we have demonstrated a powerful universal wearable biosensing strategy that can achieve selective detection of a broad range of biomarkers (including all essential AAs, vitamins, metabolites, lipids, hormones and drugs) and reliable in situ regeneration. Furthermore, to enable continuous and on-demand metabolic and nutritional monitoring across the activities, we have integrated the LEG-MIP sensor array and iontophoresis-based sweat induction into a wireless wearable technology, with optimized multi-inlet microfluidic sudomotor axon reflex sweat sampling, in situ signal processing, calibration, and wireless communication. Using this telemedicine technology, we have demonstrated the wearable and continuous monitoring of postprandial AA responses to identify risks for metabolic syndrome. The high correlation between sweat and serum BCAAs shows great promise of this technology towards metabolic syndrome risk monitoring. The substantial difference in Leu between COVID-19 positive and negative blood samples indicates the potential of using this technology for at-home COVID-19 management. We envision that this wearable technology could play a crucial role in the realization of precision nutrition through continuous monitoring of circulating biomarkers and enabling personalized nutritional intervention. This technology could also be reconfigured to continuously monitor a variety of other biomarkers toward a wide range of personalized preventive, diagnostic, and therapeutic applications.
Methods
Materials and reagents.
Uric acid, L-tyrosine, silver nitrate, iron chloride (III), dopamine hydrochloride, choline chloride, creatinine, pantothenic acid calcium salt, citrulline, pyridoxine, and lactic acid were purchased from Alfa Aesar. Sodium thiosulfate pentahydrate, sodium bisulfite, tryptophan, leucine, alanine, isoleucine, methionine, valine, lysine, thiamine hydrochloride, serine, sulfuric acid, hydrochloric acid, anthraquinone-2-carboxylic acid (AQCA), 3-Aminophenylboronic acid (APBA), aniline, o-phenylenediamine (o-PD), methylene blue (MB), thionine, 2-(N-morpholino)ethanesulfonic acid hydrate (MES), ethanolamine, N-(3-dimethyl-aminopropyl)-N’-ethylcarbodiimide (EDC), N-hydroxysulfosuccinimide sodium salt (sulfo-NHS), bovine serum albumin (BSA), tris(hydroxymethyl)aminomethane hydrochloride (Tris-HCl), streptavidin-peroxidase conjugate (strep-POD, Roche), and hydroquinone (HQ) were purchased from Sigma Aldrich. Carboxylic acid-modified-magnetic beads (Dynabeads®, M-270) were obtained from Invitrogen. Potassium ferricyanide (III), and potassium ferrocyanide (IV) was purchased from Acros Organics. Acetic acid, methanol, sodium acetate, sodium chloride, sodium dihydrogen phosphate, potassium chloride, potassium hydrogen phosphate, urea, L-ascorbic acid and dextrose (D-glucose) anhydrous, glycine, arginine, inositol, ornithine, aspartic acid, threonine, histidine, riboflavin, creatine, phenylalanine, nicotinic acid, folic acid, glutamic acid, and hydrogen peroxide (30% (w/v)) were purchased from Thermo Fisher Scientific. Insulin capture antibody and biotinylated detector antibody were purchased from R&D systems (Human/Canine/Porcine Insulin DuoSet ELISA). Screen printed carbon electrodes (SPCE) and magnetic holder were purchased from Metrohm DropSens. Medical adhesives were purchased from 3M and Adhesives Research. Polyimide (PI) films (75 μm thick) were purchased from DuPont. PET films (12 μm thick) were purchased from McMaster-Carr.
Fabrication and preparation of the LEG sensors.
The LEG electrodes were fabricated on a polyimide film with a thickness of 75 μm (DuPont) with a 50 W CO2 laser cutter (Universal Laser System). When engraving the PI with a CO2 laser cutter, the absorbed laser energy is converted to local heat and thus leads to a high localized temperature (>2500 °C), chemical bonds in the PI network are broken and thermal reorganization of the carbon atoms occurs, resulting in sheets of graphene structures. The optimized parameters for the graphene electrodes and electronic connections were power 8%, speed 15%, points per inch (PPI) 1000 in raster mode with 3-time scan. For the active sensing area of the temperature sensor, the optimized parameters were power 3%, speed 18%, PPI 1000 in vector mode with 1-time scan. To prepare the reference electrode, Ag was first modified on the corresponding graphene electrode by multi-current electrodeposition with electrochemical workstation (CHI 832D) at −0.01 mA for 150 s, −0.02 mA for 50 s, −0.05 mA for 50 s, −0.08mA for 50 s, and −0.1 mA for 350 s using a plating solution containing 0.25 M silver nitrate, 0.75 M sodium thiosulfate and 0.5 M sodium bisulfite. 0.1 M FeCl3 solution was further dropped on the Ag surface for 30 s to obtain the Ag/AgCl electrode, and then 3 μL PVB reference cocktail prepared by dissolving 79.1 mg of PVB, 50 mg of NaCl in 1 mL of methanol was dropped on the Ag/AgCl electrode and dried overnight. The Na+ selective electrode was prepared as follows: 0.6 μL of Na+ selective membrane cocktail prepared by dissolving 1 mg of Na ionophore X, 0.55 mg Na-TFPB, 33 mg PVC and 65.45 mg DOS into 660 μL of THF was drop-casted onto the graphene electrode and dried overnight. To obtain the desired stable Na+ sensing performance for long-term continuous measurements, the obtained Na+ sensor was conditioned overnight in 100 mM NaCl.
The fabrication process of the LEG-MIPs sensor array is illustrated in Supplementary Fig. 6. All the MIP layers are synthesized by electro-polymerization. The polymerization solution was prepared by dissolving 5 mM template (e.g., target amino acid), 12.5 mM aminophenylboronic acid (APBA) and 37.5 mM pyrrole into 0.01 M phosphate buffer saline (PBS) (pH=6.5). For multi-MIP BCAA sensor, 5 mM of each target (i.e., Leu, Ile, and Val) was used. Prior to MIP deposition, the LEG was activated in 0.5 M H2SO4 with CV scans for 60 segments (−1.2–1 V with a scan rate of 500 mV s−1). For the direct-detection LEG-MIP sensors, the target imprinted polymer was electrochemically synthesized on the LEG electrode with CV deposition (0–1 V for 10 cycles, 50 mV s−1) using the prepared polymerization solution. The target molecules were extracted by soaking the electrode into an acetic acid/methanol mixture (7:3 v/v) for 1 hour. Subsequently, the resulting electrode was immersed into 0.01 M phosphate buffer saline (pH=6.5) for repetitive CV scans (0.4–1 V with a scan rate of 50 mV s−1) until a stable response was obtained. For LEG-non-imprinted polymer (NIP), the electrode was prepared following the same procedure as LEG-MIP except that there was no template added in the polymerization solution.
For the indirect-detection MIP sensors, electrochemically synthesized redox-active nanoreporters (RARs) (e.g., Prussian Blue nanoparticles (PBNPs) or anthraquinone-2-carboxylic acid (AQCA)) was first modified on the LEG electrode. The PBNPs RAR on the LEG was prepared with cyclic voltammetry (20 cycles) (−0.2 to 0.6 V with a scan rate of 50 mV s−1) in an aqueous solution containing 3 mM FeCl3, 3 mM K3Fe(CN)6, 0.1 M HCl and 0.1 M KCl. A PBNP layer with appropriate redox signal is necessary to produce a good sensitivity for the final MIP sensors; to achieve this stable and suitable redox signal, the LEG-electrode was rinsed with distilled water after the initial PB deposition and the PB electrodeposition step was repeated for two more times until a stable 70 μA LSV peak in 0.1 M KCl solution was achieved. Subsequently, the LEG-PB was rinsed with distilled water and immersed into a solution containing 0.1 M HCl and 0.1 M KCl for repetitive CV scans (−0.2–0.6 V with a scan rate of 50 mV s−1) until a stable response was obtained. To prepare the AQCA RAR on the LEG, the LEG electrode was first incubated in 50 μL PBS (pH=6.5) with 5 mM AQCA at 4 ºC overnight. Subsequently, the LEG-AQCA was rinsed with distilled water and immersed into a phosphate buffer solution for repetitive CV scans (−0.8–0 V with a scan rate of 50 mV s−1) until a stable response was obtained. For the indirect-detection LEG-PB-MIP sensors, an additional PB activation process was conducted right after the template extraction (IT scan at 1 V in 0.5 M HCl for 600 s), followed by an LEG-PB-MIP sensor stabilization process in 0.1 M KCl (CV scans at −0.2–0.6 V with a scan rate of 50 mV s−1). It should be noted that for the LEG-AQCA-MIP sensor, only 3 CV cycles polymerization was used to prepare the MIP layer, and the sensor was stabilized in 0.01 M phosphate buffer saline (PBS) (pH=6.5) (CV scans at −0.8–0 V with a scan rate of 50 mV s−1).
The morphology of materials was characterized by scanning electron microscopy (SEM, Nova Nano SEM 450) and transmission electron microscope (TEM, Talos S-FEG FEI, USA). The Raman spectrum of the electrodes with different modification were recorded using a 532.8 nm laser with an inVia Reflex (Renishaw). Fourier transform infrared (FT-IR) spectra were measured using IR spectrometer (Nicolet 6700).
Characterization of the LEG sensor performance.
A set of electrochemical sensors were characterized in solutions of target analytes. All the in vitro sensor characterizations were performed through CHI 832D. The response of the Na+ sensor was characterized with open circuit potential measurements in the solutions containing varied Na+ levels. DPV analysis was performed for all the direct-detection LEG-MIP sensor characterizations in 0.01 M PBS (pH 6.5) or in raw sweat. DPV conditions: range, 0.4–1 V; incremental potential, 0.01 V; pulse amplitude, 0.05 V; pulse width, 0.05 s; pulse period, 0.5 s; and sensitivity, 1 × 10⁻⁵ A V−1. For in vitro indirect-detection of the target molecules based on the LEG-PB-MIP sensors, LSV analysis (0.4–0 V) was performed in 0.1 M KCl. The LSV conditions: range, 0.4–0 V; scan rate, 0.005 V s−1; sample interval, 0.001 V; quiet time, 2 s, and sensitivity, 1 × 10⁻⁴ A V−1. For in vitro indirect-detection of the target molecules based on the LEG-AQCA-MIP sensors, negative DPV analysis (0–−0.8 V) was performed in 0.01 M PBS. The negative DPV conditions: 0–−0.8 V; incremental potential, 0.01 V; pulse amplitude, 0.05 V; pulse width, 0.05 s; pulse period, 0.5 s; and sensitivity, 1 × 10⁻⁵ A V−1. For in situ sweat analyte measurement, background and signal curves were recorded before and after incubation; the signal current was obtained as the difference of the peak amplitudes between the post-incubation signal and the background current curves (Fig. 3b–d and Supplementary Fig. 29). The temperature sensor characterization was carried out on a ceramic hot plate (Thermo Fisher Scientific) (Supplementary Fig. 28). The sensor response was recorded using a parameter analyzer (Keithley 4200A-SCS) and compared with the readings from an infrared thermometer (LASERGRIP 800; Etekcity).
To evaluate the performance of the various electrode substrates for MIP-based AA sensing, LEG, printed carbon electrode (PCE), Au electrode (AuE), and glassy carbon electrode (GCE) were chosen. The GCEs were purchased from CH Instruments. The PCEs were printed on the PI substrate using a Dimatix Materials Printer DMP-2850 (Fujifilm, Minato, Japan) with a commercial carbon ink from NovaCentrix. The AuEs were fabricated via E-beam evaporation: 20 nm of Cr and 100 nm of Au were deposited onto an O2-plasma pretreated PET substrate. MIP films were prepared with CV deposition (0–1 V for 10 cycles, 50 mV s−1).
Fabrication and characterization of microfluidic channels.
The microfluidic module was fabricated using a 50 W CO2 laser cutter (Universal Laser System) (Supplementary Fig. 1). Briefly, layers of double-sided and single-sided medical adhesives (3M) were patterned with channels, inlets, the iontophoresis gel outlines and reservoirs. For all microfluidic layers, the iontophoresis gel outlines were patterned to enable the current flow from the top polyimide electrode layer. The bottom layer, which is the double-sided adhesive layer in contact with the skin (accumulation layer), was patterned with a sweat accumulation well (3M 468MP, laser parameter: power 60%, speed 90%, PPI 1000). The second layer (the inlets layer), in contact with the accumulation layer, was patterned with the multiple inlets (12 μm thick PET, laser parameter: power 20%, speed 100%, PPI 1000). The third layer (channel layer), in contact with the inlets layer, was patterned with microfluidic channels (Adhesives Research 93049, laser parameter: power 45%, speed 100%, PPI 1000). The fourth layer (reservoir layer), sandwiched between the channel layer and the electrode polyimide layer, was patterned with the reservoir and the outlet (3M 468MP, laser parameter: power 60%, speed 90%, PPI 1000). The reservoir is an ellipse with a 5.442 mm major axis and a 4.253 mm minor axis to fully enclose the active sensing area. The thickness of the channel layer is ~0.1 mm (Adhesives Research 93049) and the thickness of the reservoir layer is 0.13 mm (3M 468MP). The reservoir area is 18.17 mm2, and thus the reservoir volume can be calculated as the area multiplied by the thickness of the reservoir layer (0.13 mm) which totals 2.36 μL.
Fabrication of agonist agent hydrogels.
Hydrogels containing muscarinic agent carbachol was prepared as follows: Briefly, for anode gel, agarose (3% w/w) was added into deionized water and then heated to 250 °C under constant stirring. After the mixture was fully boiled and became homogenous without agarose grains, the mixture was cooled down to 165 °C and 1% carbachol was added to the above mixture. Subsequently, the cooled mixture was slowly poured into pre-made cylindrical molds or into assembled microfluidic patch and solidified for 10 min at 4 °C. The cathode gel was prepared similarly except that NaCl (1% w/w) was used instead of carbachol.
Signal conditioning, processing and wireless transmission for the wearable sensor.
The block diagram of the electronic system (Fig. 1g and Supplementary Fig. 4) represents both the wearable electronic patch and the smart watch that can (i) induce sweat via iontophoresis and (ii) monitor sweat via electrochemical methods. The sweat induction and the sweat sensing procedures are initiated and controlled by the microcontroller (STM32L432KC, STMicroelectronics) when it receives a user command from the Bluetooth module over Universal Asynchronous Receiver/Transmitter (UART) communication.
Sweat induction:
Programmable iontophoretic current is generated by a voltage controlled current source that consists of a unity-gain difference amplifier (AD8276, Analog Devices) and a boost transistor (BC846, ON Semiconductor). The circuit is supplied by the output of a boost converter (LMR64010) that boosts the 3.7 V battery voltage to 36 V. The microcontroller controls the digital to analog converter (DAC) (DAC8552, Texas Instruments) over serial peripheral interface (SPI) to set the control voltage of the current source. The current source output is checked by a comparator (TS391, STMicroelectronics) and the microcontroller is interrupted through its general-purpose input/output (GPIO) pin at output failure. The protection circuit consists of a current limiter (MMBF5457, ON Semiconductor) and analog switches (MAX4715, Maxim Integrated; ADG5401, Analog Devices). The microcontroller’s GPIO is also used to enable or disable the iontophoresis circuit. For the optimized design, a 100-μA current (~2.6 μA mm−2) was applied for on-body iontophoresis sweat induction using the flexible microfluidic patch.
Power analysis:
When powered at 3.3 V, the electronic system consumes ~28 mA during an active electrochemical measurement and ~61 mA during iontophoresis. The microcontroller and Bluetooth module each consume ~12 mA; the sensor interface consumes ~4 mA; the boost converter and iontophoresis module consumes ~33 mA, and the display module consumes an additional ~8 mA when refreshing its screen.
Sweat sensing:
The sweat sensing circuitry can perform two channel simultaneous DPV, as well as potentiometric and temperature measurements. A bipotentiostat circuit is constructed by a control amplifier (AD8605) and two transimpedance amplifiers (AD8606). A series voltage reference (ISL60002, Renesas Electronics) and a DAC (DAC8552, Texas Instruments) is used to generate a dynamic potential bias across the reference and working electrodes. In instrumentation amplifier (INA333, Texas Instruments) is used for potentiometric measurements; and a voltage divider is used for the resistive temperature sensor. All analog voltage signals are acquired by the microcontroller’s built-in analog-to-digital converter (ADC) channels, processed, then transmitted over Bluetooth to a user device.
Custom mobile application design.
The custom mobile application was developed with the cross-platform Flutter framework. The mobile application can wirelessly communicate with the wearable devices via Bluetooth to send commands, and to acquire, process, and visualize the sweat biomarker levels. The application establishes a secure Bluetooth connection to the wearable sensor. The home page plots the user’s historical biomarker levels, and highlights the most recently measured analyte concentrations. When a sweat biomarker measurement is prompted, the user can switch over to the measurement page that plots the sweat sensors’ voltammograms in real time. Following the voltammetric measurement, the app extracts the voltammograms’ peak currents using a custom baseline correction algorithm, then converts the peak currents to corresponding biomarker concentrations. This measurement data is added to the list of historic analyte levels in the home page.
Refreshing time analysis and simulations.
The refreshing time analyses were performed using numerical simulations (COMSOL). Three-dimensional models of different microfluidic designs with same dimensions of the actual device were created in Rhinoceros and imported into COMSOL Multiphysics. The mass transport process was simulated by numerically solving the Stokes equation for an incompressible flow coupled with convection-diffusion equation (see Supplementary Note 3).
Human subject recruitment.
The validation and evaluation of the sweat sensor were performed using human subjects in compliance with all the ethical regulations under protocols (ID 19-0892 and 21-1079) that were approved by the Institutional Review Board (IRB) at California Institute of Technology. The participating subjects (age over 18 years) were recruited from the California Institute of Technology campus and the neighboring communities through advertisement. All subjects gave written informed consent before study participation. For wearable sensor evaluation, healthy subjects with a BMI of 18.5 to 24.9 kg m−2 with fasting serum glucose <100 mg dL−1 were recruited. For the BCAA study, inclusion criteria include: Group I, normal weight individuals with a body mass index (BMI) of 18.5 to 24.9 kg m−2 with fasting serum glucose <100 mg dL−1 (Healthy); Group II, overweight/obese individuals with a BMI of 25 to 35 kg m−2 and fasting serum glucose <6 mg dL−1 (Overweight/Obesity); Group III, obese individuals with a BMI of 25 to 35 kg m−2 and fasting serum glucose >= 126 mg dL−1 (Obesity & T2DM). COVID-19 positive and COVID-19 negative serum samples were purchased from RayBiotech, Inc.
Gas chromatography–mass spectrometry (GC-MS) analysis for sensor validation.
GC-MS analysis of the amino acids in sweat and serum samples were performed using EZ:Faast kit from Phenomenex which provides sample preparation, derivatization and GC-MS analysis of free amino acids. A Varian Saturn 2000 was used for the GC-MS runs. 1 μL of prepared sample solution was injected for GC in Helium carrier gas at 1.0 mL min−1 constant flow with a pulse pressure of 20 pounds per square inch (psi) for 0.2 min, with the oven programmed from 110 °C to 320 °C at 32 °C min−1. The mass chromatography was set with source at 240 °C, quad at 180 °C, and auxiliary at 310 °C with a scan range from 45–450 m z−1 at a sampling rate of 3.5 scans s−1. Selected ion monitoring was used, which records the ion current at selected masses that are characteristic of the certain amino acid in an expected retention time49. For example, after the derivatization of the EZ:Faast kit, Trp has a characteristic mass at 130 with a retention time at around 5.1 min, and peak height is recorded for Trp measurements at ion number 130 and at 5.1 min from the raw data spectrum. The internal standard (norvaline) was added during the sample derivatization process to account for potential evaporation-induced increase in peak detection; the internal standard (IS) norvaline peak height is recorded at its ion number 158 at 1.65 min (Supplementary Fig. 26). The Trp peak height recorded from raw data spectrum was calibrated with respect to the internal standard in the same run: normalized Trp peak height = Trp peak height/IS peak height. With normalized peak heights of different levels of Trp standards, calibration plots were constructed. For other samples, the normalized peak height of Trp was used to calculate the concentration.
Integrated system validation in human subjects.
System evaluation during exercise:
To validate the wearable sensor system, we conducted constant-load cycling exercise on healthy subjects. The subjects reported to the lab after fasting overnight and were given a standardized protein drink (Fairlife, Core Power Elite). The subjects’ foreheads and necks were cleaned with alcohol swabs and gauze before the sensor patches were placed on the body. A stationary exercise bike (Kettler Axos Cycle M-LA) was used for cycling trials. The subjects cycled at 60 rpm for 60 min or until fatigue. During the on-body trial, the data from the sensor patches were wirelessly sent to the user interface via Bluetooth. When the subjects started biking, the sensor system continuously acquired and transmitted temperature and sodium sensor data. Every minute, the electronic system initiated a transient voltage bias between the reference and working electrodes. When the bias triggered a current above an experimentally determined threshold, the system would start a CV cleaning cycle and then the first DPV scan as the initial background without target incubation. The DPV scan was repeated 7 min later as the post-incubation curve. Between the two scans, sodium and temperature sensor data were continuously recorded. Right after the post-incubation DPV, another cycle started with an IT cleaning/regeneration step, followed by an initial background DPV scan. The collected temperature, sodium, and DPV data were wirelessly transmitted to a user device via Bluetooth in real-time, where the molecular data was extracted, calibrated, and converted to concentration levels. Sweat samples were collected periodically from the subjects during the studies using centrifuge tubes. The sweat samples were then frozen at −20 °C for further testing and validation via electrochemical test with the biosensors and GC-MS analysis.
System evaluation with Tyr/Trp supplement intake:
The subjects reported to the lab after fasting overnight. The subjects’ arms were cleaned with alcohol swabs and gauze before the sensor patches were placed on the body. The subjects were provided Tyr and Trp supplement (1 g each) for the intake study. In contrast, the control study was performed on the subjects without any supplementary intake. A 5-min iontophoresis was applied on the subjects. The sensor data recording process was the same as exercise-based human trials.
Sensor evaluation with BCAA diet challenge:
For the BCAA studies, the subjects were asked to consume 5 g BCAAs (2:1:1=Leu:Ile:Val) or a standardized snack including a protein drink (Fairlife, Core Power Elite) and a CLIF energy bar. An iontophoresis session was implemented with carbachol gels for sweat induction. Over entire study period, the subject’s sweat was sampled periodically and analyzed by the sensor patch. Blood glucose level was recorded every 15 min with a commercial Care Touch Blood Glucose Meter. Fresh capillary blood samples were collected using a finger-prick approach during the human studies. After cleaning the fingertip with alcohol wipe and allowing it to air dry, the skin was punctured with a CareTouch lancing device. Samples were collected with centrifuge tubes after wiping off the first drop of blood with gauze. After the 90-min standardized clotting procedure finished, serum was separated by centrifuging at 6,000 rpm for 15 min, and instantly stored at −20 °C for analysis with GC-MS, the LEG-MIP sensors, and the custom insulin assay.
Blood insulin analysis:
For the BCAA diet challenge study, the collected serum samples were analyzed using a custom insulin sandwich immunoassay. The magnetic beads (MB) were modified based on a previous publication50. Briefly, 3 μL MBs were activated with 50 mg mL−1 EDC/sulfo-NHS in MES buffer (25 mM, pH 5) for 35 minutes followed by capture antibody immobilization (25 μg mL−1 in MES buffer) for 15 minutes. After deactivation with 1 M ethanolamine in phosphate buffer (0.1 M, pH 8), MBs were incubated in 25 μL standards prepared in 1% BSA or serum samples diluted 5 times in 1% BSA for 15 min. From here, the beads were rinsed with 1% BSA twice after each binding step. Next, the MBs were incubated in 25 μL of biotin-detector Ab (1.0 μg mL−1) in 1% BSA for 30 min followed by 15 min in Strep-POD (2500X) prepared in 1% BSA. The amperometric detection was carried out by applying a constant potential of −0.2 V to MBs resuspended in 45 μL 1 mM HQ, 5 μL 5 mM H2O2 was pipetted onto the SPCE when background current stabilized.
Supplementary Material
Acknowledgements
This project was supported by the National Institutes of Health grant R01HL155815, Office of Naval Research grants N00014-21-1-2483 and N00014-21-1-2845, the Translational Research Institute for Space Health through NASA NNX16AO69A, NASA Cooperative Agreement 80NSSC20M0167, High Impact Pilot Research Award T31IP1666 and grant R01RG3746 from the Tobacco-Related Disease Research Program, Caltech-City of Hope Biomedical Initiative Pilot Grant, and the Rothenberg Innovation Initiative Program at California Institute of Technology. J.T. was supported by the National Science Scholarship (NSS) from the Agency of Science Technology and Research (A*STAR) Singapore. We gratefully acknowledge critical support and infrastructure provided for this work by the Kavli Nanoscience Institute at Caltech. This project benefited from the use of instrumentation made available by the Caltech Environmental Analysis Center and we gratefully acknowledge support on GC-MS from Dr. Nathan Dalleska. We also gratefully acknowledge Zi Wang for the contribution on mobile app development, Dr. Rebeca M. Torrente-Rodríguez for the insulin assay optimization, and Dr. Shujuan Bao for the valuable inputs.
Footnotes
Competing interests
The authors declare no competing interests.
Supplementary information The online version contains supplementary material available at https://doi.org/10.1038/s41551-01X-XXXX-X.
Peer review information Nature Biomedical Engineering thanks Reviewer and the other, anonymous, reviewer(s) for their contribution to the peer review of this work.
Data availability
The data that support the plots within this paper and other findings of this study are available from the corresponding author upon request.
References
- 1.Trumbo P, Schlicker S, Yates AA & Poos M Dietary reference intakes for energy, carbohydrate, fiber, fat, fatty acids, cholesterol, protein and amino acids. J. Am. Diet. Assoc 102, 1621–1630 (2002). [DOI] [PubMed] [Google Scholar]
- 2.Wu G Amino acids: metabolism, functions, and nutrition. Amino Acids 37, 1–17 (2009). [DOI] [PubMed] [Google Scholar]
- 3.Lynch CJ & Adams SH Branched-chain amino acids in metabolic signalling and insulin resistance. Nat. Rev. Endocrinol 10, 723–736 (2014). [DOI] [PMC free article] [PubMed] [Google Scholar]
- 4.Wang TJ et al. Metabolite profiles and the risk of developing diabetes. Nat. Med 17, 448–453 (2011). [DOI] [PMC free article] [PubMed] [Google Scholar]
- 5.Mayers JR et al. Elevation of circulating branched-chain amino acids is an early event in human pancreatic adenocarcinoma development. Nat. Med 20, 1193–1198 (2014). [DOI] [PMC free article] [PubMed] [Google Scholar]
- 6.Kau AL, Ahern PP, Griffin NW, Goodman AL & Gordon JI Human nutrition, the gut microbiome and the immune system. Nature 474, 327–336 (2011). [DOI] [PMC free article] [PubMed] [Google Scholar]
- 7.Fernstrom JD & Wurtman RJ Brain Serotonin Content: Physiological Dependence on Plasma Tryptophan Levels. Science 173, 149–152 (1971). [DOI] [PubMed] [Google Scholar]
- 8.Fernstrom JD & Fernstrom MH Tyrosine, Phenylalanine, and Catecholamine Synthesis and Function in the Brain. J. Nutr 137, 1539S–1547S (2007). [DOI] [PubMed] [Google Scholar]
- 9.Dierckx T et al. The metabolic fingerprint of COVID-19 severity. medRxiv 10.1101/2020.11.09.20228221. [DOI] [Google Scholar]
- 10.Grant WB et al. Evidence that vitamin D supplementation could reduce risk of influenza and COVID-19 infections and deaths. Nutrients 12, 988 (2020). [DOI] [PMC free article] [PubMed] [Google Scholar]
- 11.Belanger MJ et al. COVID-19 and disparities in nutrition and obesity. N. Engl. J. Med 383, e69 (2020). [DOI] [PubMed] [Google Scholar]
- 12.Stefan N, Birkenfeld AL & Schulze MB Global pandemics interconnected — obesity, impaired metabolic health and COVID-19. Nat. Rev. Endocrinol 17, 135–149 (2021). [DOI] [PubMed] [Google Scholar]
- 13.Wishart DS Emerging applications of metabolomics in drug discovery and precision medicine. Nat. Rev. Drug Discov 15, 473–484 (2016). [DOI] [PubMed] [Google Scholar]
- 14.Dettmer K, Aronov PA & Hammock BD Mass spectrometry-based metabolomics. Mass Spectrom. Rev 26, 51–78 (2007). [DOI] [PMC free article] [PubMed] [Google Scholar]
- 15.Ray TR et al. Bio-integrated wearable systems: A comprehensive review. Chem. Rev 119, 5461–5533 (2019). [DOI] [PubMed] [Google Scholar]
- 16.Hollander JE & Carr BG Virtually perfect? Telemedicine for COVID-19. N. Engl. J. Med 382, 1679–1681 (2020). [DOI] [PubMed] [Google Scholar]
- 17.Niu S et al. A wireless body area sensor network based on stretchable passive tags. Nat. Electron 2, 361–368 (2019). [Google Scholar]
- 18.Meng K et al. A wireless textile-based sensor system for self-powered personalized health care. Matter 2, 896–907 (2020). [Google Scholar]
- 19.Wang C et al. Monitoring of the central blood pressure waveform via a conformal ultrasonic device. Nat. Biomed. Eng 2, 687–695 (2018). [DOI] [PMC free article] [PubMed] [Google Scholar]
- 20.Ni X et al. Automated, multiparametric monitoring of respiratory biomarkers and vital signs in clinical and home settings for COVID-19 patients. Proc. Natl. Acad. Sci. U.S.A 118, e2026610118 (2021). [DOI] [PMC free article] [PubMed] [Google Scholar]
- 21.Jeong H et al. Differential cardiopulmonary monitoring system for artifact-canceled physiological tracking of athletes, workers, and COVID-19 patients. Sci. Adv 7, eabg3092 (2021). [DOI] [PMC free article] [PubMed] [Google Scholar]
- 22.Sempionatto JR et al. An epidermal patch for the simultaneous monitoring of haemodynamic and metabolic biomarkers. Nat. Biomed. Eng 10.1038/s41551-021-00685-1 (2021). [DOI] [PubMed] [Google Scholar]
- 23.Xu C, Yang Y & Gao W Skin-interfaced sensors in digital medicine: from materials to applications. Matter 2, 1414–1445 (2020). [DOI] [PMC free article] [PubMed] [Google Scholar]
- 24.Heikenfeld J et al. Accessing analytes in biofluids for peripheral biochemical monitoring. Nat. Biotechnol 37, 407–419 (2019). [DOI] [PubMed] [Google Scholar]
- 25.Bariya M, Nyein HYY & Javey A Wearable sweat sensors. Nat. Electron 1, 160–171 (2018). [Google Scholar]
- 26.Yang Y & Gao W Wearable and flexible electronics for continuous molecular monitoring. Chem. Soc. Rev 48, 1465–1491 (2019). [DOI] [PubMed] [Google Scholar]
- 27.Kim J, Campbell AS, de Ávila BE-F & Wang J Wearable biosensors for healthcare monitoring. Nat. Biotechnol 37, 389–406 (2019). [DOI] [PMC free article] [PubMed] [Google Scholar]
- 28.Gao W et al. Fully integrated wearable sensor arrays for multiplexed in situ perspiration analysis. Nature 529, 509–514 (2016). [DOI] [PMC free article] [PubMed] [Google Scholar]
- 29.Bandodkar AJ et al. Battery-free, skin-interfaced microfluidic/electronic systems for simultaneous electrochemical, colorimetric, and volumetric analysis of sweat. Sci. Adv 5, eaav3294 (2019). [DOI] [PMC free article] [PubMed] [Google Scholar]
- 30.Emaminejad S et al. Autonomous sweat extraction and analysis applied to cystic fibrosis and glucose monitoring using a fully integrated wearable platform. Proc. Natl. Acad. Sci. U.S.A 114, 4625–4630 (2017). [DOI] [PMC free article] [PubMed] [Google Scholar]
- 31.Torrente-Rodríguez RM et al. Investigation of cortisol dynamics in human sweat using a graphene-based wireless mHealth System. Matter 2, 921–937 (2020). [DOI] [PMC free article] [PubMed] [Google Scholar]
- 32.Koh A et al. A soft, wearable microfluidic device for the capture, storage, and colorimetric sensing of sweat. Sci. Transl. Med 8, 366ra165 (2016). [DOI] [PMC free article] [PubMed] [Google Scholar]
- 33.Ray TR et al. Soft, skin-interfaced sweat stickers for cystic fibrosis diagnosis and management. Sci. Transl. Med 13, eabd8109 (2021). [DOI] [PMC free article] [PubMed] [Google Scholar]
- 34.Lee H et al. A graphene-based electrochemical device with thermoresponsive microneedles for diabetes monitoring and therapy. Nat. Nanotech 11, 566–572 (2016). [DOI] [PubMed] [Google Scholar]
- 35.Lee H et al. Wearable/disposable sweat-based glucose monitoring device with multistage transdermal drug delivery module. Sci. Adv 3, e1601314 (2017). [DOI] [PMC free article] [PubMed] [Google Scholar]
- 36.Kim J et al. Noninvasive alcohol monitoring using a wearable tattoo-based iontophoretic-biosensing system. ACS Sens. 1, 1011–1019 (2016). [Google Scholar]
- 37.Kim J et al. A Skin - Interfaced, Miniaturized Microfluidic Analysis and Delivery System for Colorimetric Measurements of Nutrients in Sweat and Supply of Vitamins Through the Skin. Adv. Sci 9, 2103331 (2022). [DOI] [PMC free article] [PubMed] [Google Scholar]
- 38.Sempionatto JR et al. Wearable and mobile sensors for personalized nutrition. ACS Sens, 6, 1745–1760 (2021). [DOI] [PubMed] [Google Scholar]
- 39.Yang Y et al. A laser-engraved wearable sensor for sensitive detection of uric acid and tyrosine in sweat. Nat. Biotechnol 38, 217–224 (2020). [DOI] [PubMed] [Google Scholar]
- 40.Yu Y et al. Biofuel-powered soft electronic skin with multiplexed and wireless sensing for human-machine interfaces. Sci. Robot 5, eaaz7946 (2020). [DOI] [PMC free article] [PubMed] [Google Scholar]
- 41.Wang J Electrochemical biosensors: towards point-of-care cancer diagnostics. Biosens. Bioelectron 21, 1887–92 (2006). [DOI] [PubMed] [Google Scholar]
- 42.Uzun L & Turner AP Molecularly-imprinted polymer sensors: realising their potential. Biosens. Bioelectron 76, 131–44 (2016). [DOI] [PubMed] [Google Scholar]
- 43.Parlak O, Keene ST, Marais A, Curto VF & Salleo A Molecularly selective nanoporous membrane-based wearable organic electrochemical device for noninvasive cortisol sensing. Sci. Adv 4, eaar2904 (2018). [DOI] [PMC free article] [PubMed] [Google Scholar]
- 44.Kaspar H, Dettmer K, Gronwald W & Oefner PJ Automated GC–MS analysis of free amino acids in biological fluids. Journal of Chromatography B 870, 222–232 (2008). [DOI] [PubMed] [Google Scholar]
- 45.Riedl B, Nischik M, Birklein F, Neundörfer B & Handwerker HO Spatial extension of sudomotor axon reflex sweating in human skin. J. Autonom. Nerv. Syst 69, 83–88 (1998). [DOI] [PubMed] [Google Scholar]
- 46.Newsholme EA & Blomstrand E Branched-chain amino acids and central fatigue. J. Nutr 136, 274S–276S (2006). [DOI] [PubMed] [Google Scholar]
- 47.Ahlqvist E et al. Novel subgroups of adult-onset diabetes and their association with outcomes: a data-driven cluster analysis of six variables. Lancet Diabetes Endo. 6, 361–369 (2018). [DOI] [PubMed] [Google Scholar]
- 48.Layman DK & Walker DA Potential importance of leucine in treatment of obesity and the metabolic syndrome. J. Nutr 136, 319S–323S (2006). [DOI] [PubMed] [Google Scholar]
- 49.Kitson FG, Larsen BS & McEwen CN Mass Spectrometry: A Practical Guide (Academic Press, San Diego, 1996), pp. 3–23. [Google Scholar]
- 50.Torrente-Rodríguez RM et al. Rapid endoglin determination in serum samples using an amperometric magneto-actuated disposable immunosensing platform. J. Pharmaceut. Biomed 129, 288–293 (2016). [DOI] [PubMed] [Google Scholar]
Associated Data
This section collects any data citations, data availability statements, or supplementary materials included in this article.
Supplementary Materials
Data Availability Statement
The data that support the plots within this paper and other findings of this study are available from the corresponding author upon request.