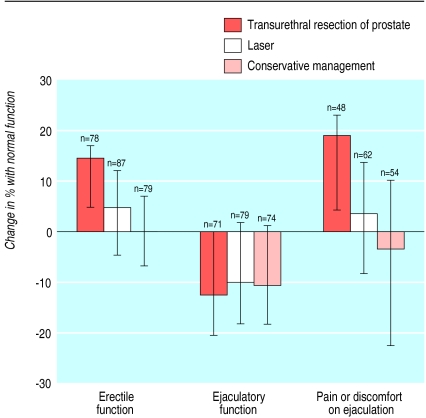
Figure 3.
Change in percentage (95% confidence intervals) of men who responded to item at baseline and follow up with normal function after treatment (positive change indicates an improvement). Confidence intervals, provided for descriptive purposes only and based on exact methods with data dichotomised within each group, do not yield identical findings to either Wilcoxon P values quoted in text or primary (between group) comparisons from proportional odds models that use ordinal response data

