

Abstract

New lyotropic, fragranced, viscoelastic fluid with a complex structure is obtained from fragranced microemulsions by the addition of a fatty acid. Nonhomogeneous mixing of an appropriate nonionic surfactant, a fatty acid, and a fragrance oil led to the formation of anisotropically shaped and highly oriented micelles in aqueous solution. The nano- and microstructures, and consequently the viscosity, are controlled by the balance of fatty acids used as a cosurfactant and fragrance molecules, which partly behave as a cosurfactant and partly segregate in the micelles of the hydrophilic nonionic surfactant. The transition from isotropic microemulsion to a more structured viscoelastic solution is characterized by X-ray scattering and rheological methods. Considering our X-ray scattering results, we propose a structure composed of planar sheets of ellipsoidal micelles arranged in a lamellar type of stacking. The complex structured, low viscous, transparent fluid is capable of solubilizing a fragrance inside the ellipsoidal micelles, as well as retaining microparticles containing fragrance, without the addition of a polymeric thickener or another gelator. These features allow the creation of a 2-in-1 fragrance-solubilizing liquid product compatible with all types of home and body care consumer products.
1. Introduction
Fragrances play an important role in the perception of a product’s performance and thus they often determine the consumer’s choice of a given product. They are incorporated as a “free” (nonencapsulated or solubilized) oil or encapsulated in core–shell capsules or other types of micro- and nanoparticles to deliver a pleasant odor to skin, fabric, or surfaces.
When fragrances are presented as a solubilized oil, the main challenges are to enhance the fragrance performance such as the long-lastingness of the olfactive perception. When they are inserted in the form of microparticles, the stable dispersion of the particles is one of the key parameters of product quality. The combination of a free fragrance oil with fragrance-containing microparticles in the same consumer product could deliver benefits such as solubilization of higher fragrance quantities, highly enhanced fragrance performance, or controlled release of the fragrance under external stimuli such as temperature, friction, oxidation, and others. However, the difficulties related to the successful homogeneous solubilization of the oil and the formation of a stable dispersion of the microparticles are compounded.
To obtain a stable dispersion of microparticles incorporated in liquid formulations (such as emulsions or microemulsions), thickening with an external polymeric thickener1 or an organo-2,3 or hydrogelator4 is often necessary. Most of the polymers (bio- or synthetic) are highly charged, and the mixing of the liquid dispersion with another liquid formulation could induce precipitation. Another way to solubilize a fragrance oil and suspend microcapsules successfully is by using formulations that are mainly composed of lyotropic liquid-crystalline phases. The disadvantage of the classic lyotropic liquid-crystalline phases (lamellar, hexagonal, cubic) is their high viscosity, requiring relatively high-cost shearing, and difficulty in pouring the consumer product.
In the present paper, we report complex fluid compositions with surprisingly low viscosity but viscoelastic properties allowing to retain microcapsules in a stable suspension without a polymeric thickener or a salt. The formulations revealed strong anisotropy of the refractive index expressed as a birefringence visualized by cross polarizers. The birefringence, observed as a variety of macroscopic domains with interference colors, persists for months in samples at rest.
The lyotropic phases known with their specific birefringence, expressed as interference-colored domains, are the sheared sponge phases (L3) and the nematic phases.
The sponge phase (L3) is an optically isotropic phase built of three-dimensional (3D) randomly connected bilayers of surfactant molecules, which divides the space into two coexisting volumes.5 One of the most interesting properties of the bicontinuous phase is the transient flow birefringence. Diat and Roux investigated a lyotropic system composed of SDS, pentanol, dodecane, and water.6 They found that above a critical shear rate, the value of which depends on the membrane volume fraction, the isotropically distributed in the space bilayer membrane orients along the flow direction and a flow birefringence occurs. The anisotropy was detected with a neutron scattering as an elongation and orientation of the scattering intensity in a preferred direction. Similar flow birefringence of the L3 phase composed of different surfactants and cosurfactant systems was reported by Mahjub et al.7 The authors studied the shear-induced sponge to lamellar phase transition and confirmed (by X-rays scattering and rheology) the birefringence and the phase transition provoked by the shear at critical values of the shear rate. However, what it was established as a specific feature for the sheared sponge phase is that, once the shear is stopped and the phase is left at rest, the isotropic distribution of the surfactant bilayer is restored8 and the birefringence disappeared. According to Diat et al.,6 the process of relaxation can take different times (from a few seconds to a few hours) depending on the dilution level. Phase transitions from sponge to lamellar or to multilamellar vesicle (MLV) were reported by different scientific groups.9−11 Higher organizational order is presented in the lamellar phase. In the classical lamellar phase, the molecules are oriented in a preferred direction and arranged in layers having a normal parallel to the orientation director. Lamellar phases are characterized by pseudo-Bragg peaks. The peak shape depends on the fluctuations of the lamellae itself and their elasticity. Detailed modeling analysis of scattering data from lamellar structures provides useful information on the lamellae inner structure and overall arrangements.12−14
Nematic lyotropic liquid-crystalline phases are mesophases, which appear in a limited region on the phase diagram between the isotropic micellar phases and the highly ordered lamellar or hexagonal phases.15,16 They are one of the most interesting industrial mesophases because they flow like a liquid, owing to their internal structuration, and are sensitive to external fields (electric, magnetic) and shear flow. They are usually observed in aqueous systems that contain a charged surfactant in combination with an appropriate cosurfactant (e.g., sodium dodecyl sulfate–dodecanol–water, potassium laurate–decanol–water)17,18 in the absence of oils. Their structural units are anisotropically shaped micelles, and they have an orientational order along a preferred direction. Because of the phase anisotropy, nematics are characterized by a birefringence expressed as interference colors visible through crossed-polarized filters.19,20 The birefringence of the nematic phases persists when the solutions are kept at rest. Three different lyotropic nematic phases can be distinguished, two uniaxial and one biaxial:21−26 discotic nematic (ND), calamitic nematic (Nc), and biaxial (NB) nematic phase.27,28 It was established that a mixture of more than one amphiphilic compound, as is the case in our study, can form the three nematic phases,8 and the so-called “intrinsically biaxial micelle” model was proposed to describe the different mesophases. In this generalized model, the three nematic phases are regarded as a consequence of orientational fluctuations of anisotropically shaped micelles. Small-angle scattering of nematic phases presents peaks associated with the mean distance between micelles.29 Despite a wide number of studies on lyotropic nematic phases in aqueous surfactant systems, a small number of studies on complex oil-containing compositions exist.30−32
In the present paper, we report hierarchically structured (at a micro- and nanolevel) delivery systems built of a 3D network of planar sheets, containing ellipsoidal micelles, which solubilize fragrance oils. These planar sheets are stacked in a lamellar-like structure. Ultra-small/small/wide-angle X-ray scattering (USAXS/SAXS/WAXS) techniques and rheology are used to identify the phases and to correlate the internal structure to the macroscopic solution properties.
2. Materials and Methods
2.1. Materials
The studies were performed by using the nonionic surfactants: Neodol 91-8 (C9–11E8, product of Shell Chemicals) and decyl octaethylene glycol ether (C10E8) (product of Nikko Chemicals, Japan) and the fatty acid lauric acid (provided by Impaq AG, Switzerland). The fragrance ingredients dihydromyrcenol (Figure 1A) and exaltolide (Figure 1B), provided by Firmenich SA, Switzerland, were used as oil compounds. The water-soluble solvent 1,2-propylene glycol (provided by Carlo Erba) was used in the aqueous phase in a mixture with deionized water in a constant weight ratio of 1:3.5 = propylene glycol/water.
Figure 1.

Chemical structure of the fragrance oils used for sample preparation: (A) dihydromyrcenol and (B) exaltolide.
2.2. Sample Preparation and Compositions
The protocol for preparing the studied samples consisted of the following steps: (a) water, propylene glycol, surfactant, and fragrance were mixed under gentle stirring until the formation of a microemulsion; (b) the microemulsion from step (a) was heated to 45 °C, and lauric acid was added progressively. After the complete solubilization of lauric acid, the samples were stirred at room temperature for 30 min to obtain a homogeneous solution. The full list of formulations used for the scattering experiments is shown in Tables 1–3. “Active matter” means the combination of surfactant, fragrance, and lauric acid. Abbreviations “LA” for lauric acid, “PG” for propylene glycol, and “DHM” for dihydromyrcenol will be used.
Table 1. Formulations for the Series of LA Concentration Increase.
| LA concentration
increase-fixed: DHM = 1.9%, C9–11E8 = 6% | |||||||
|---|---|---|---|---|---|---|---|
| mol fractions | |||||||
| LA% | LA | C9–11E8 | DHM | W | PG | active matter | |
| L0 | 1.0 | 0.0012 | 0.0027 | 0.0029 | 0.9303 | 0.0629 | 0.0068 |
| L1 | 1.4 | 0.0017 | 0.0027 | 0.0029 | 0.9298 | 0.0628 | 0.0073 |
| L2 | 1.6 | 0.0019 | 0.0027 | 0.0029 | 0.9296 | 0.0628 | 0.0076 |
| L3 | 1.9 | 0.0023 | 0.0027 | 0.0029 | 0.9293 | 0.0628 | 0.0079 |
| L4 | 2.5 | 0.0030 | 0.0027 | 0.0030 | 0.9285 | 0.0627 | 0.0087 |
Table 3. Formulations for the Dilution Linea.
| Dilution
line | |||||||
|---|---|---|---|---|---|---|---|
| mol fractions | |||||||
| active matter % | water | PG | C9–11E8 | LA | DHM | active matter | |
| Q0 | 60 | 0.8408 | 0.0569 | 0.0332 | 0.019 | 0.0498 | 0.0883 |
| Q1 | 33 | 0.9022 | 0.0610 | 0.0119 | 0.0069 | 0.0179 | 0.0367 |
| Q2 | 25 | 0.9134 | 0.0618 | 0.0081 | 0.0046 | 0.0120 | 0.0248 |
| Q3 | 18.8 | 0.9204 | 0.0623 | 0.0056 | 0.0032 | 0.0084 | 0.0173 |
| Q4 | 12.5 | 0.9265 | 0.0627 | 0.0035 | 0.0020 | 0.0052 | 0.0110 |
| Q5 | 9.1 | 0.9295 | 0.0629 | 0.0025 | 0.0014 | 0.0036 | 0.0076 |
| Q6 | 5.6 | 0.9324 | 0.0631 | 0.0014 | 0.0008 | 0.0022 | 0.0045 |
Active matter includes C9–11E8 + DHM + LA; dilution was performed with (water + PG) at a ratio of 3.5.
Table 2. Formulations for the Series of DHM Concentration Increase.
| DHM concentration
increase-fixed: LA = 1.6%, C9–11E8 = 6% | |||||||
|---|---|---|---|---|---|---|---|
| mol fractions | |||||||
| DHM% | LA | C9–11E8 | DHM | water | PG | active matter | |
| S0 | 0 | 0.0019 | 0.0027 | 0.0000 | 0.9324 | 0.0630 | 0.0045 |
| S1 | 0.5 | 0.0019 | 0.0027 | 0.0008 | 0.9317 | 0.0630 | 0.0053 |
| S2 | 1 | 0.0019 | 0.0027 | 0.0015 | 0.9310 | 0.0630 | 0.0061 |
| S3 | 1.5 | 0.0019 | 0.0027 | 0.0023 | 0.9302 | 0.0630 | 0.0069 |
| S4 | 1.9 | 0.0019 | 0.0027 | 0.0029 | 0.9296 | 0.0630 | 0.0075 |
| S5 | 2.5 | 0.0019 | 0.0027 | 0.0039 | 0.9286 | 0.0630 | 0.0085 |
2.3. SAXS/WAXS Studies
Ultra-small/small/wide-angle X-ray scattering studies were performed at the European Synchrotron Radiation Facility in Grenoble, France. The samples were measured at 8.0, 0.8, and 0.13 m sample-to-detector distances at the ID02 beamline.33 The detector was a Rayonix MX-170HS and Rayonix LX-170HS CCD camera (for USAXS/SAXS and WAXS, respectively), the X-ray energy was 12.46 keV, and the beam size was about 0.1 mm × 0.1 mm. Samples were filled in 2 mm horizontal capillaries, and 10 images were recorded over a length of 4 mm along the capillary. Recorded data were corrected for detector artifacts (flat field, distortion, dark images), azimuthally averaged, and normalized to absolute scattering intensity [mm–1]. Independent measurements were averaged, and data recorded at different sample-to-detector distances were merged in a single file after subtraction of the instrumental background. As a result, absolute scaled data in a large q window extending from qmin = 0.009 nm–1 to qmax = 40 nm–1 were obtained for all samples described. The X-ray beam (Z-direction) was perpendicular to the horizontal capillary (X–Y cross section), and therefore, only the X–Y plane structure was deduced from the scattering sample. Axis X is oriented parallel to the capillary axis. As will be shown later in the text, some samples presented an orientational order, leading to anisotropic two-dimensional (2D) scattering. Radial integrations allowed the investigation of the order parameter of the oriented samples. Since the investigated system is highly hierarchical, it is not possible to describe the full combined scattering curves. For WAXS, we may have information on short-range correlations, and for USAXS, we, usually, find an upturn on the scattering curve, which is an indication of larger distances and sizes inside of the system. Therefore, for the investigation of the main structural features in the scattering intensity, we focused on the SAXS region (sample-to-detector distance of 0.8 m).
Several analyses were performed of the scattering data to retrieve structural information. In all cases, a homemade software was used, written on Fortran90. For the radial integrations, a model proposed by Deutsch34 allowed the calculation of the order parameter ⟨P2⟩ of the samples as well as the orientation angles. Having these angles, sectorial integrations were performed along the Y-axis direction (called the horizontal cut) and along the X-axis (called the vertical cut). The obtained one-dimensional (1D) curves were subjected to advanced modeling, combining the form factor of the micelles, and a structure factor of the system.35 The micelles were described as uniaxial ellipsoids, and for the structure factor, a lamellar system was used. Therefore, the analysis was made for 1D curves obtained from angular sectors and not on the entire 2D image.
2.3.1. Azimuthal and Radial Integrations
As will be shown later, the 2D SAXS patterns were anisotropic, which indicates that samples present a flow-induced orientation. For the proper data analysis, we made sector integrations to obtain the 1D curves. The overall strategy, presented in Figure 2, was:
-
(1)
Identify peaks or oriented features in the 2D pattern.
-
(2)
Perform radial integrations (full circle over the detector surface) around the identified regions and perform azimuthal plots.
-
(3)
Determine the orientation order parameters using an appropriate model.
-
(4)
The peak width of the azimuthal plots will be the angular interval for the sector analysis.
-
(5)
Perform azimuthal integrations (sector analysis) in the two main directions of the orientation patterns: along the X-axis direction (horizontal (H)) and perpendicular to it (vertical (V)).
-
(6)
Analyze the obtained 1D curves with the proposed models.
Figure 2.

Graphical representation of the integration process.
2.3.2. Order Parameter from SAXS Curves
The orientation order parameter ⟨Pn⟩ is quantified by the orientation distribution function f(β) of the micellar axis relative to the director (angle β) and is defined as36
| 1 |
where Pn(x) is the nth Legendre polynomial. Although the order parameters ⟨P2⟩ and ⟨P4⟩ can be determined by various experimental methods, the angular function f(β) cannot be directly measured. An analytical solution for this integral was proposed by Deutsch34 and allows the calculation of the order parameters from the SAXS data.35 To obtain these values, one can perform a fitting of the peaks using a theoretical model, as shown by eq 2
| 2 |
In this equation, Lpeak is a peak function very useful since it allows a continuous change of the peak shape from a Lorentzian (ν → 0) to a Gaussian (ν → ∞).34,35Sc1 and Sc2 are the scale factors for the two peak positions, ϕ1 is the angular peak position, w is the peak width, ν is the shape factor for the peak, x1 is the correction for the position of the second peak, and “back” is a constant background. Since we have two peaks on the plot (due to the intrinsic symmetry on SAXS images), we can take advantage of having two peaks for the modeling. Therefore, a second peak is added in a 180° direction with a correction factor, x1, for the case in which small corrections on the second peak position is needed (usually this correction is lower than 0.1°). The factors Sc1 and Sc2, ideally, should be equal, but in some cases, the samples have internal inhomogeneities that can lead to small variations in the peak heights, as seen in the plots shown along the text. The parameters ϕ1 and w are later used for the azimuthal integrations since they define the direction and interval for the sector analysis (see section A).
Besides the sample orientation parameters, the use of eq 2 allows the determination of an analytical representation for the intensity dependence. This is very important for the numerical integrations, which are needed for the determination of the order parameters according to Deutsch’s model. Also, it is necessary to point out an important remark: Deutsch’s formalism assumes that the system is composed of a single domain, which is far from the reality in our case since we may have several domains contributing to the scattering intensity. Therefore, the obtained order parameter is a kind of average over all of those domains and is a lower estimate of the “real” order parameter from the system.
2.3.3. Structure Factor and Form Factor Combination
In the Supporting Information (SI), we present a stepwise analysis of the proposed theoretical model. A simpler description considering simple bilayers was not capable of fitting the experimental data, and therefore a more elaborate model was used. Model-free analysis using indirect Fourier transformation (IFT)37−39 suggested the presence of anisotropic micelles grouped in clusters. Further analysis demonstrated that the micelles can be described as uniaxial ellipsoids grouped in planar-like structures with semi-axes A, B, and C. Since we observed Bragg-like peaks in the SAXS data, it was necessary to introduce the structure factor related to the ordered structures in the system. In some scattering patterns, we clearly had indications for the formation of lamellar-like arrangements. The combination of form factors and structure factors for modeling lamellar arrangements can be found in the literature for several applications, principally for lipid bilayers.29,30 Therefore, we can use this structure factor for the ordered contribution in the scattering intensity. A recently published model36 was used for the modeling of the experimental data from lyotropic nematic and cholesteric liquid crystals
| 3 |
Some mathematical details of the above equation are shown in the Supporting Information and can be seen elsewhere.36 The form factor used is that from a uniaxial ellipsoidal micelle Pell(q), described by a radius R, anisotropy ε, and “clusters of micelles”, described by the factor SAGG(q), with semi-axes A, B, and C. The lamellar structure factor SLam(q) is described by the periodicity d, the positional correlation distance D, weight of the ordered part in the system c, and the Debye–Waller disorder factor σdis. The disorder factor accounts for thermal fluctuations or disorder among parallel planes and avoids high-order peaks. It is possible to correlate this thermal disorder parameter with the Caillè parameter η.36,40 With only a single peak, it was impossible to uniquely demonstrate the existence of a lamellar micellar arrangement. However, the proposed model allowed the determination of the periodicity and correlation distance. The modeling is not performed on an absolute scale since it would demand a much higher level of detail on the system at molecular level.
2.4. Fourier Transform Infrared Spectroscopy (FTIR-UATR)
IR spectra were recorded using a Frontier FTIR spectrometer equipped with a Universal Diamond attenuated total reflectance (ATR) horizontal accessory of PerkinElmer. Blank spectra of the air were recorded as a reference and subtracted from the spectra of the analyzed sample. A small amount of product to analyze was deposited on the sampling crystal, and an average of eight spectra was performed in the range of wavenumbers from 4000 to 650 cm–1. Spectra were measured at an ambient temperature with a 4 cm–1 resolution. The resulting spectra are presented as absorbance as a function of wavenumbers.
2.5. Rheology
Flow and oscillatory rheology were used to study the viscoelastic behavior of the samples. Rheological experiments were performed with a TA Instruments AR 1500 and were carried out at 25 °C. The experimental parameters were fixed with the software AR Instrument Control.
The flow experiments were performed with an aluminum cone device with a 40 mm diameter and an angle of 4°. This geometry was chosen to ensure uniform stress all along the sheared surface independent of the diametric position. The gap between the cone geometry and the deposition surface was fixed instrumentally at a value of 100 μm. The flow experiment was a shear ramp test with a controlled rate. The shear rate was varied from 0.01 to 1000 s–1 in log scale with 10 points/decade. Shear stress as a function of the shear rate reveals the flow behavior of the studied samples.
For the oscillatory rheology, a 40 mm diameter steel plate geometry was used with a gap of 500 μm. The first step was to perform a stress sweep in the range of 10–4–105 Pa at different frequencies (ω = 1, 10, 100 rad/s) to find the linear part of each dependence of elastic modulus, G′, on the applied stress. The second step was to perform a frequency sweep at a fixed stress (0.1 Pa) chosen from the linear part of the stress sweep in the frequency range ω ∈ (0.1–500) rad/s with 10 points/decade in log scale. The viscoelastic behavior of the samples was studied by applying sinusoidal deformations (strain) at different angular frequencies, ω. The sinusoidal shear stress developed by the system in response to the deformations was out of phase with the strain. The complex shear modulus was given by G* = G′ + iG″, where G′ and G″ are defined as the storage and the loss moduli, respectively. The elasticity (G′) and viscosity (G″) of the material were expressed by these two moduli. The oscillatory curves allowed us to determine different structural parameters such as the relaxation time and mesh size of the network.41
In general, two crossing points between G′ and G″ could be observed. The first crossing point corresponds to the longest relaxation time (τ1) of the internal structure and indicates the so-called transition to flow. The second crossing point corresponds to the shortest relaxation time (τ2) and indicates the so-called leathery (or rubbery) transition of the material.42
3. Results and Discussion
3.1. Determination of Structures by SAXS/WAXS
Transparent or slightly opalescent solutions were obtained by a progressive addition of fatty acid to fragranced nonionic microemulsions. The samples were stirred gently and observed continuously across polarizing filters during the fatty acid insertion. Birefringence was observed as the appearance of large domains with different sizes and colors, oriented in the direction of the flow. The birefringence was kept intact for a long period (more than 3 months) without any additional shear. The birefringence in lyotropic systems is already well known, and it is observed in two different types of phases: sponge43 and nematic phases10 as already discussed in Section 1. The question here is what kind of phases is formed in the studied solutions? The non-Newtonian flow behavior and the viscoelasticity of the samples, reported in Section 3.2, as well as the persistence of the birefringence of the samples at rest, are an indication that the structures are not a sponge L3 phase, the latter known to have a Newtonian flow behavior43 and to regain its isotropy at rest. The persistence of the anisotropy of the refractive index drew attention to the formation of a structure with anisotropic, elongated aggregates capable of orienting similarly to the aggregates in the nematic phase. In spite of the relatively low viscosity, the viscoelastic solutions of the present study can retain microparticles in a stable suspension without the addition of a polymeric thickener. This is a sign of the presence of microscopic structures.
To determine the internal structure of our samples, we performed USAXS/SAXS/WAXS studies. Scattering curve analysis allowed us to extract structural information about the shape of the scattering objects and their spatial arrangement.
3.1.1. Lauric Acid Effect
The progressive addition of lauric acid to fragranced microemulsions led to a continuous modification of the structure, which was observed as a change of the 2D scattering patterns, as shown in Figure 3A. The 2D scattering patterns show a strong anisotropy of the scattered intensity, expressed as a higher intensity in a vertical direction, perpendicular to the capillary axis. We interpret this result as a flow-induced orientation of the scattering objects.
Figure 3.

(A) 2D SAXS images for the LA concentration increase samples. (B) Radial integrations on the 2D images for the LA concentration increase series. Symbols: experimental points. Continuous lines: model fits. The sample-to-detector distance for this data was 0.8 m.
The intrinsic sample orientation makes necessary some additional care on the angular integration of the scattered intensity. The steps indicated in Section 2.3.1 were applied, providing azimuthal plots shown in Figure 3B. In these figures, the procedure described in Section 2.3.2 was used, allowing the estimation of the order parameters.35 The analysis of the radial integration/azimuthal plots was important to determine the order parameter of the system ⟨P2⟩ and the precise values of the orientation angles. With these angles, vertical and horizontal cuts of the images were performed to obtain clear information about the shape, aggregation, and orientation of the scatterers.
The scattering curves, for all lauric acid concentrations in Figure 4A, are characterized by a broad “bump” corresponding to a local form factor P(q) (0.06 < q < 0.4 Å–1). A similar broad bump was previously observed on the scattering curves of surfactant binary solutions containing ellipsoidal micelles,35 cylindrical, or worm-like micelles.44 Due to the clear orientation of the objects in a vertical direction, the horizontal cuts may provide information for the form factor and some aggregates not affected by the flow-induced orientation.
Figure 4.

(A) Radial profiles of the scattered intensity of samples at different lauric acid concentrations. The concentration of fragrance (dihydromyrcenol) and surfactant is constant and equal to 1.9 and 6% wt, respectively. (B) Radial profiles of the scattered intensity of samples at different fragrance (DHM) concentrations. The concentration of lauric acid and surfactant is constant and equal to 1.6 and 6% wt, respectively. In all curves, symbols: experimental data, solid lines: model fits. Labels H and V stand for horizontal and vertical directions, respectively. The sample-to-detector distance for this data was 0.8 m.
As observed in Figure 4A (H curves), the proposed model (see Section 2.3.3) provides a good fit of the experimental data. Both prolate and oblate micelles can fit the scattering data with similar quality (see the SI). Therefore, from the SAXS data alone, it is not possible to precisely determine the micellar shape; only the fact that the micelles are anisometric is well confirmed. For the plots shown in Figure 4A, we assumed prolate ellipsoidal micelles since the fit quality was slightly better than those for oblate micelles. The parameters deduced from the curve fitting for the different LA concentrations (Table S5 in the SI) revealed ellipsoidal micelles, with a radius of around 12 Å, a length of about 50 Å, and anisotropy (defined as the ratio between the length and the radius of the ellipsoid) around 2. The radius is close to half of the lauric acid bilayer45 thickness (11–12 Å) at an experimental pH value of 4.9. Interestingly, this analysis also holds for the case of oblate micelles: one obtains a radius of 22 Å, an anisotropy of around 0.5, and a half-thickness of ∼11 Å. Therefore, the half-thickness is also close to thickness of a half of the lauric acid bilayer, which indicates that both oblate and prolate micelles could provide similar fitting quality. The formation of anisometric micelles in mixtures of lauric acid and other types of surfactants is already known in the literature.
The factorization with the structure factor provides a tentative picture of the microscopic arrangement of the micelles in the system. The results shown in Table S5 (SI) indicate the formation of planar agglomerates of ellipsoidal micelles, with a thickness similar to the micelle smaller diameter, which can be understood as planar “sheets” of micelles. Interestingly, the dimensions of these sheets obtained from the modeling analysis are capable of reproducing with reasonable precision the overall concentrations presented in each sample.
This successful analysis of the horizontal cuts provided a very good base for the description of the vertical cuts. As shown in Figure 4A (V curves), at lauric acid concentrations above 1.4% wt (sample L1), a large structural peak converting to a sharp peak (at 2.5% wt lauric acid—sample L4, corresponding to a surfactant-to-fatty-acid volume ratio of 2:1) is presented on the scattering curves at low q values in the mesoscopic range (q = 0.006 to 0.06 Å–1). This indicates the presence of long-range interactions between the scatterers. To consider this periodicity, a lamellar-like structure factor was added to the model, as discussed in Section 2.3.3.
The fits using this model are shown as solid lines in Figure 4A (V curves), and the full list of model parameters is included in Table S5 (SI). In both: the vertical and horizontal cuts, in the full range of LA concentration, the micelle small radius was ∼12 Å and the micelles anisotropy was ∼2. The analyses revealed that the micelles aggregate in planar-like sheets of overall typical sizes of 400 × 200 × 30Å3. These sheets pill as planar layers, giving rise to Bragg-like peaks with a typical periodicity of ∼334–370 Å and correlation lengths of ∼6000–4000 Å, which corresponds to 10–20 repeating units.
In summary, the obtained structural parameters indicated the formation of planar-like sheets composed of ellipsoidal micelles, piled up on a 1D periodical structure. Since the system is soft and diffusive, one can only see a single peak due to dislocations or fluctuations on the planes. The absence of interference peaks from the in-plane micelles indicates a lack of well-ordered micelles within the sheets.
A tentative sketch of the suggested structure with oblate and prolate ellipsoidal micelles is represented in Figure 5A and B, respectively. The results shown in Table S5 demonstrate that the size and overall anisotropy of the micelles are preserved when increasing the LA concentration. The repeating distance between planar sheets is reduced as the LA concentration increases, whereas the correlation distance D increases. These effects suggest that the addition of LA molecules leads to a closer arrangement of micelles in the planes and consequently lower repeating distance.
Figure 5.

Sketch of the structure proposed based on the X-ray diffraction results: (A) with oblate ellipsoidal micelles and (B) with prolate ellipsoidal micelles.
The scattering patterns observed with our samples differ from those typical for lyotropic nematics. The specificity of the nematic X-ray patterns and the properties of the different nematic phases are discussed in detail by Figueiredo Neto.46 It was experimentally shown that the 2D patterns of all nematic phases contain two bands due to a pseudo-lamellar ordering of at least eight lamellar distances, and a third diffuse band, related to the micellar positional ordering in the direction perpendicular to the pseudo-lamellar ordering. The existence of a structural or “correlation” peak and its position at low q values as a typical for the nematic phase arrangement was also mentioned by Holmes et al.,47 Pelletier et al.,48 and Davidson et al.29 The 2D patterns of our samples at first sight look similar to those described by Neto and Davidson, but the second-order band is not visible. In our case, we do not have a nematic pseudo-lamellar ordering and, therefore, no second-order peak is observed. Micelles are arranged in planes, as depicted in Figure 5, an arrangement that is not present in the usual lyotropic nematics. In our systems, the orientation observed in some of the diffraction patterns could be induced by the shear flow during the preparation of the samples—its appearance was observed during the addition of the lauric acid under agitation. According to the studies of Baza et al.,20 the shear-induced alignment along the vorticity axis is not perfect and large domains could be generated by the flow with an averaged director aligned in any direction including the flow direction. The size of the visible colored birefringent domains and the high repeating distance suggest that the scattering objects are not single micelles but clusters of anisotropic micelles and therefore the repeat distance d should be the distance between 2D oriented sheets. The finite size of those sheets, obtained from the modeling analysis and their influence also on the scattering in the horizontal direction, suggests the formation of a “crumple” arrangement of the sheets in the system. The overall size of the sheets can be seen as the average correlation size of the scatterers. One can also have the existence of uncorrelated “pieces” of sheets oriented randomly. Finally, increasing the lauric acid concentration, the aspect ratio of the micelles, and the domain size, the lamellar “pieces” are pushed to arrange in a lamellar-like structure under shear.
To verify that the described structures did not form due to the polydispersity of the surfactant chain lengths, Neodol 91-8 was replaced by the highly pure C10E8 surfactant, keeping the same sample composition (sample called L2-P). As can be observed in Figure S5 in the SI, butterfly-like 2D scattering patterns were obtained with scattering clouds strongly polarized and tilted at different angles. In this case, the scattering intensity in the horizontal direction is very low, revealing a very strong orientation of the domains in the direction perpendicular to the capillary axis. Therefore, the diffusivity of the samples (L0–L4) in the horizontal direction could be related to the polydispersity of the hydrocarbon chain lengths of the surfactant Neodol 91-8. In this sample kept at rest, the homogeneity and the birefringence were preserved intact for more than 1 year at room temperature.
3.1.2. Fragrance Oil Effect
The presence of a fragrance oil with alcohol functionality (dihydromyrcenol) plays an important role in the formation of the structure sketched in Figure 5, similar to the lauric acid action. Figure 6 shows the series of 2D SAXS patterns, which demonstrate the tendency to alignment as the concentration of the fragrance oil increases. The radial integrations (Figure 6B) and the results in Table S2 (SI) denote that, at dihydromyrcenol concentrations up to 0.5% wt, the mixtures are isotropic (samples S0 and S1) and for concentrations higher than 1% wt of dihydromyrcenol (samples S2–S5), the intensity of the flow alignment increases. With these considerations, the angular section analysis for the vertical and horizontal directions was performed, as explained in the previous section. The obtained 1D curves, showing the effect of the fragrance, are presented in Figure 4B.
Figure 6.

(A) 2D SAXS images for the DHM concentration increase samples. (B) Radial integrations on the 2D images for the DHM concentration increase series. Symbols: experimental points. Continuous lines: model fits. Sample-to-detector distance for this data was 0.8 m.
Sample S1 containing 0.5% wt of fragrance oil, which, at rest, is isotropic, plays the role of a reference sample in this series of studies because lauric acid is not soluble in water at temperatures below 45 °C in the absence of fragrance oil. A transition is obtained from an isotropic to a birefringent solution at 1% wt of added fragrance oil.
By using the theoretical model to fit the vertical and horizontal X-ray scattering curves of the scattering patterns, one obtains an interesting behavior of the system. For samples S0 and S1, the aggregation of micelles (Sagg(q)) consists of the formation of globular clusters (see parameters A, B, and C in Table S5, SI). Additionally, to fit the scattering data from samples S0 and S1, it was necessary to add a hard-sphere structure factor (SHS(q)),35 indicating the presence of a micelle–micelle interaction in the system and promoting a decrease on the scattering intensity at q ∼ 0.04–0.05 Å–1. Since samples S0 and S1 do not show an orientational ordering, it is an indication that the sample alignment requires the formation of a planar-like sheet. Sample S2 showed the 1D periodical sheet-like arrangement (see parameter C in Table S5) and consequently the tendency of alignment under shear (Figure 6 and Table S2 in the SI). Samples S3–S5 confirmed the stacked lamellar-like character seen in other data. Therefore, one clearly remarks a critical concentration of dihydromyrcenol (>1% wt), keeping constant the surfactant (6% wt) and lauric acid (1.6% wt) contents, giving rise to a transition toward the already encountered 2D-arrangement domains. As mentioned before, the incorporation of fragrance oil with alcohol functionality led to the tendency of the formation of planar-like sheets, which, consequently, led to their lamellar-like stacking. The orientation and the translational ordering were found to increase with the oil concentration increase. This is expressed by a sharpening of the structural peak, a stronger difference between the vertical and horizontal scattering intensities, and decreasing repeating distance d. From the ratio between the correlation distance D and the repeating distance d, one can conclude that the correlation distance D increases from ∼2 to ∼17 planar sheets.
The chemical structure of the fragrance oil influences the structures, determining the preferential site of solubilization, i.e., palisade layer or interior of the micelles. One can compare the SAXS curves of the samples with dihydromyrcenol (fragranced alcohol) (sample S4 in Figure 6) and exaltolide (cyclic fragranced musk or lactone, sample E1) (Figure 7). Both fragrance ingredients are solubilized at the same molar concentration of 0.12 mol/L. The sample with dihydromyrcenol showed a tendency to orient perpendicularly to the capillary axis, whereas the exaltolide sample showed a tendency to align along the capillary direction. This difference in the orientation of the structures is reflected in the rheological properties, as shown later in Section 3.2. The fitting of the experimental scattering curves indicated that the highly hydrophobic lactone provoked an increase in the equatorial radius (13.6 Å) of the micelles, keeping the same anisotropy. As shown in Table S5, the repeating distance d is higher in the mixture that solubilized exaltolide (395 ± 4 Å) than in the mixture that solubilized dihydromyrcenol (360 ± 4 Å), i.e., the clusters containing the lactone micelles are less closely packed.
Figure 7.

SAXS data for sample solubilizing exaltolide (E1). (A) 2D SAXS images. (B) Radial integrations on the 2D images. (C) Radial profiles of scattered intensity (CH—horizontal cut; CV—vertical cut). Symbols: experimental data, solid lines: model fits. Sample composition: 89.5% wt (water + propylene glycol) + 6.0% wt C9–11E8 + 1, 6% wt lauric acid + 2.9% wt exaltolide. The data obtained at 8.0 m (USAXS) was combined with the curve at 0.8 m (SAXS).
The correlation distance is lower for the structures containing exaltolide (∼2700 Å) than for those containing the dihydromyrcenol (∼4700 Å).
3.1.3. Microstructure Variation Derived from a Dilution Experiment
To confirm the microstructure suggested above, we performed a progressive dilution of the samples with the aqueous mixture (water + propylene glycol), starting from the highly concentrated sample (Q0) at 60% wt of active matter (36% wt C9–11E8 + 16% wt dihydromyrcenol + 8% wt lauric acid). The sample appearance between crossed polarizing filters is presented in Figure 8, with a decreasing active matter content.
Figure 8.

Isotropic-to-birefringent phase transition on a dilution line (samples Q0–Q6). The active matter content in % wt is written on the images. The sample tubes with an inner diameter of 20.4 mm were photographed through crossed polarizing filters. The scale is 5 mm.
By observing the colored patterns on the images, one clearly distinguishes the transition from the isotropic (black) to birefringent phase (between 60% (Q0) and 33% (Q1) active matter). Further dilution led to an increase of the number of the colored domains and to their size reduction. The 2D scattering data for the dilution series is shown in Figure 9A, and the radial integrations are shown in Figure 9B. As one can clearly see, sample Q0 (60% active matter) has no intrinsic (or flow) optical anisotropy. However, the other samples, with a decreasing active matter concentration, show a tendency to flow alignment. The corresponding scattering curves are shown in Figure 10A (symbols) with the model fits (solid lines). The obtained fitting parameters are given in Table S5 in the SI.
Figure 9.

(A) 2D SAXS images for the dilution series samples. For sample Q6, the diffraction peak was behind the beam-stopper for the SAXS configuration; therefore, the USAXS data was used (Q6U). One observed variation on the USAXS 2D image; so, the first collected frame (Q6U773) and the last collected frame (Q6U780) are shown. (B) Radial integrations on the 2D images SAXS for the dilution line series. (C) USAXS data. Symbols: experimental points. Continuous lines: model fits. For samples Q0–Q6, the sample-to-detector distance was 0.8 m. For sample Q6U, the sample-to-detector distance was 8.0 m.
Figure 10.

(A) Radial profiles of the scattered intensity of samples containing different concentrations of active matter along a dilution line: 60% wt (black), 33% wt (red), 25% wt (green), 19% wt (magenta), 12.5% wt (blue), 9,1% wt (orange), and 5.6% wt (dark gray). For samples Q0–Q6, the sample-to-detector distance was 0.8 m. For sample Q6U, the sample-to-detector distance was 8.0 m. (B) Repeat distance as a function of active matter volume fraction. The red line represents the linear fit of the experimental points. The slope is 1.18, and d0 calculated from the intercept is equal to 23.6 Å.
The sample containing 60% wt (Q0) active matter can be considered as a classical bicontinuous microemulsion, having the typical broad peak on the scattering curve.49
The sample with 33% wt (Q1) active matter is identified as a highly flow-oriented phase (⟨P2⟩ = 0.62), with a scattering profile presenting two bands at q1 = 0.06 Å–1 and q2 = 0.12 Å–1, an indication of a lamellar arrangement.27,36 The interference color is a single yellow color observed through crossed filters. Therefore, it could be identified as a well-aligned phase with a multiple stacking arrangement. The repeating distance for the sample with 33% wt of active matter was found to be d = 93 Å and represented the closest packing of the domains.
At 25% wt (Q2) of active matter, the sample is still a well-aligned phase, with a scattering curve characterized by a single but very sharp peak at q = 0.046 Å–1 and a repeating distance of d = 120 Å. The appearance of a variety of colors and the loss of the second-order peak indicate an increased disorder, as shown by the increase of the parameter σdis.
Further dilution (Q3–Q6) expands the distance between the stacked domains and reduces even more their size. Notably, the micellar organization in planar clusters is preserved until unusually high dilutions (94.4% aqueous phase), and the repeating distance increased up to d = 726 Å (for sample Q6, the USAXS data was used in order to have a good representation of the diffraction peak). A similar repeating distance, but clearly due to strong electrostatic repulsions, was observed previously with ionic50 and cationic synthetic lipids.51
The repeating distance d depends on the active
matter content (Figure 10B), according to the equation  . This result shows that the structure undergoes
a “one-dimensional swelling”,8 with an aqueous phase incorporated between the sheets of the ellipsoidal
micelles solubilizing the fragrance. It is also interesting to note
that the overall sizes of the sheet-like micelle aggregates are reasonably
larger for this dilution line, reaching values of ∼2000 ×
2000 × 30 Å3. This demonstrates that the high
amount of active matter in the beginning can lead to the formation
of larger sheets.
. This result shows that the structure undergoes
a “one-dimensional swelling”,8 with an aqueous phase incorporated between the sheets of the ellipsoidal
micelles solubilizing the fragrance. It is also interesting to note
that the overall sizes of the sheet-like micelle aggregates are reasonably
larger for this dilution line, reaching values of ∼2000 ×
2000 × 30 Å3. This demonstrates that the high
amount of active matter in the beginning can lead to the formation
of larger sheets.
3.1.4. Discussion of the Nanostructures Obtained by SAXS
The nonhomogeneous distribution of different types of surfactants and cosurfactants within the micelles is a fact already known in the literature on lyotropic liquid crystals. The significant difference between the size of the polar heads or the length of the hydrophobic tails of the surfactant and cosurfactant promotes this nanosegregation of molecules in the micelle. It was previously reported, for example, that when the short ethoxylated chain C12Em (m = 1–4) surfactant was mixed with the cholesteryl ether ChEOm (m = 10 and 15) surfactant, the resulting micelles were induced to grow in a unidimensional way, leading to a viscoelastic behavior of the solutions. It was explained that the sphere-to-long rod transition had been provoked by the small polar heads of C12EOm due to a consequent interfacial curvature reduction. The same phenomenon was demonstrated by combining poly(oxyethylene) sorbitan monooleate (Tween 80) and CnE3 (n = 12, 14, 16). When sodium dodecyl ether sulfate/cocamidopropyl betaine was combined with lauric acid,52,53 a transition from rodlike to disklike micelles was observed.
In our complex mixtures, a similar nonhomogeneous distribution of the surface-active molecules in the micelle should take place. This is due to the significant difference between the size of the polar heads of the nonionic surfactant and lauric acid (eight ethoxy groups compared to COOH) having hydrophobic chains (C9–11 and C12) of similar length. The linear length of the polar head of the ethoxylated surfactant is approximately 30 Å, whereas the length of the polar part of lauric acid is about 2 Å.54 The packing parameter of C10E8 was estimated to be lower than 1/3, and the shape of its micelles was reported to be spherical.55 Therefore, based on the cited study, we can assume that the micelles made of surfactant molecules (C9–11E8 or C10E8), in the absence of lauric acid, show a spherical shape.
On the other hand, studies of lauric acid micelles at different pH values revealed that at pH between 4 and 6, lauric acid molecules form well-ordered bilayers with a high degree of interdigitation.45,56 Thus, the addition of lauric acid molecules to the spherical micelles of C10E8 (or C9–11E8) should significantly increase the effective packing parameter and lead to a transformation of the spherical micelles to ellipsoidal micelles because of the small polar COOH head of the fatty acid.
This was confirmed in our studies by the theoretical treatment of the scattering curves with appropriate models, which revealed the presence of ellipsoidal micelles. It can be assumed that, energetically and due to the nonhomogeneous molecular distribution in the micelle, the lauric acid molecules would be preferentially arranged (segregate) in the micellar equatorial area instead of in the polar caps. Then, one could suppose that a bicelle should be the more precise micellar model, having a lauric acid bilayer in the equatorial region and mainly surfactant molecules in the spherical caps. However, due to the complexity of our systems, low resolution of the SAXS curves, and the combined presence of form factor and structure factor effects, it is not possible to retrieve specific details on the micelle’s shapes. Therefore, we assumed the uniaxial ellipsoidal shape for the micelles.
The 2D domains of anisotropic micelles were observed for all of the systems with a repeating distance almost one order of magnitude higher than the micelle size. At the pH of our solutions (pH 4.9), the carboxylic acid functional groups of lauric acid molecules are slightly dissociated (∼15% COO– and 85% COOH).45 This is confirmed by previous studies57 concerning pKa shifts of lauric acid integrated into nonionic micelles of C12E8, which showed that the pKa of lauric acid in water (assumed to be 4.8) is shifted positively by 1.9 units and has a value of 6.7. Thus, electrostatic repulsion, due to the presence of deprotonated lauric acid molecules, is unlikely to be the single reason for the 1D ordering in layers observed in our proposed structure. Moreover, the repeating distance d is reduced, increasing the lauric acid concentration, which indicates that the interactions are not purely electrostatic repulsion, as observed in polyelectrolyte solutions.58
The formation of planar micellar domains (clusters) could be explained by the formation of the H-bonding network. The hypothesis of the H-bonding network is based on the chemical structure of the compounds used in the composition of the samples. All compounds: Neodol, lauric acid, dihydromyrcenol, propylene glycol, and water, contain H-bond donors and acceptors. The FTIR spectra of the single-component ingredients and their ternary mixture are presented in Figure 11. The domains reflecting the absorbance of IR due to H-bonds are −OH stretching vibration (3600–3200 cm–1), −OH-deformation vibrations (900–950 cm–1), and C=O stretching vibrations (1750–1690 cm–1) domains. As can be observed from the spectra, all molecules used in our samples create intermolecular H-bonds (peaks around 3500–3200 cm–1). Lauric acid (measured in solid form) possesses an additional very strong peak at 1698 cm–1 corresponding to the C=O stretching vibrations and demonstrating that it exists in a dimer form.
Figure 11.

FTIR spectra of single-component ingredients used in the studied samples: Neodol (blue), lauric acid (red), dihydromyrcenol (green), and their mixture (black) in the ratios used in the sample L3: Neodol/DHM = 0.94 and Neodol/LA = 1.43.
In our solutions, we expected H-bonds between the lauric acid molecules and the polar PEO groups of the ethoxylated surfactant molecules from neighboring micelles. The last hypothesis is supported by the studies of Morrow et al.56 and Pielichowska et al.59 who reported strong H-bonding between the polyethylene groups and the lauric acid. Pielichowska et al. discuss the H-bonding interactions as intermolecular interactions between PEO–PEO and lauric acid in the single-component samples and between PEO and lauric acid in the studied blends based on their FTIR studies.
In order to verify our supposition, we performed FTIR studies of solvent-free ternary mixtures, in which we kept constant the ratio between Neodol and dihydromyrcenol (0.94 molar) and varied the lauric acid concentration. The ratio between the three compounds corresponds to the ratio in the samples L0–L4. FTIR curves for the ternary mixtures are compared in Figure 12. A change of the intensity and shift of the peaks toward lower wavenumbers in the −OH stretching vibration domain 3600–3200 cm–1 (Figure 12, down left) clearly indicate H-bonding interactions between the different molecules of the mixture. The C=O stretching peaks (in the wavenumber range 1750–1700 cm–1) appearing due to the presence of lauric acid undergo variations, increasing the LA concentration. The C=O groups of lauric acid in the mixture absorb at two different wavenumbers (two peaks at 1733 and 1711 cm–1), whereas the single-component lauric acid has only one C=O peak placed at 1698 cm–1 (Figure 11, red curve). The first peak (Figure 12, down right) is related to the free C=O groups of lauric acid, not participating in H-bonding, whereas the second peak is related to the absorption by the H-bonded C=O groups. As could be clearly observed, increasing the LA concentration in the mixture leads to an increased second peak (at 1711 cm–1) intensity, demonstrating the enhanced H-bonding network. The highest quantity of C=O groups forming H-bonds corresponds to the highest concentration of LA (2.5% wt) for which a well-ordered lamellar phase was found by SAXS. These results confirm the presence of H-bonding in our samples.
Figure 12.

FTIR spectra of mixtures of Neodol, dihydromyrcenol (DHM), and LA at different concentrations of LA. The ratios (Neodol + DHM) to LA correspond to the ratios in the samples L0–L4.
3.2. Rheological Properties
Classical flow and oscillatory rheological studies were performed as a first approach to obtain general information about the macroscopic properties of the investigated solutions, the latter being important for the application of the developed delivery systems. The complex structure of the studied solutions suggests complex viscoelastic behavior although with surprisingly low viscosity.
However, considering that the structures are anisotropic and have the tendency to orient under flow, further studies using the more appropriate rheo-SAXS technique (Couette cell-SAXS (or SANS)) would be necessary to deeply understand the rheology of the current lyotropic system.
3.2.1. Effect of Lauric Acid and Fragrance Oil
The flow curves at different lauric acid concentrations are compared in Figure 13A. For all samples, the shear stress is a nonlinear function of the shear rate indicating non-Newtonian flow behavior. On the curve corresponding to the sample at 1% wt of lauric acid (Figure 13, green curve), two different regimes and a small stress plateau are clearly visible. The solution at 1% wt of lauric acid was identified (by the scattering studies) as an isotropic solution. The small stress plateau at this lauric acid concentration could appear due to the ellipsoidal shape of the micelles as it was determined by SAXS60−62 and could be a sign of shear-induced transition toward the planar sheets of micelles or it could be a sign of a coexistence of the thermodynamically stable isotropic and shear-induced nematic phase as suggested by Schmitt et al.63 and Berret et al.64 However, this is just a speculation because only rheo-SAXS experiments can reveal the exact phase under shear.
Figure 13.
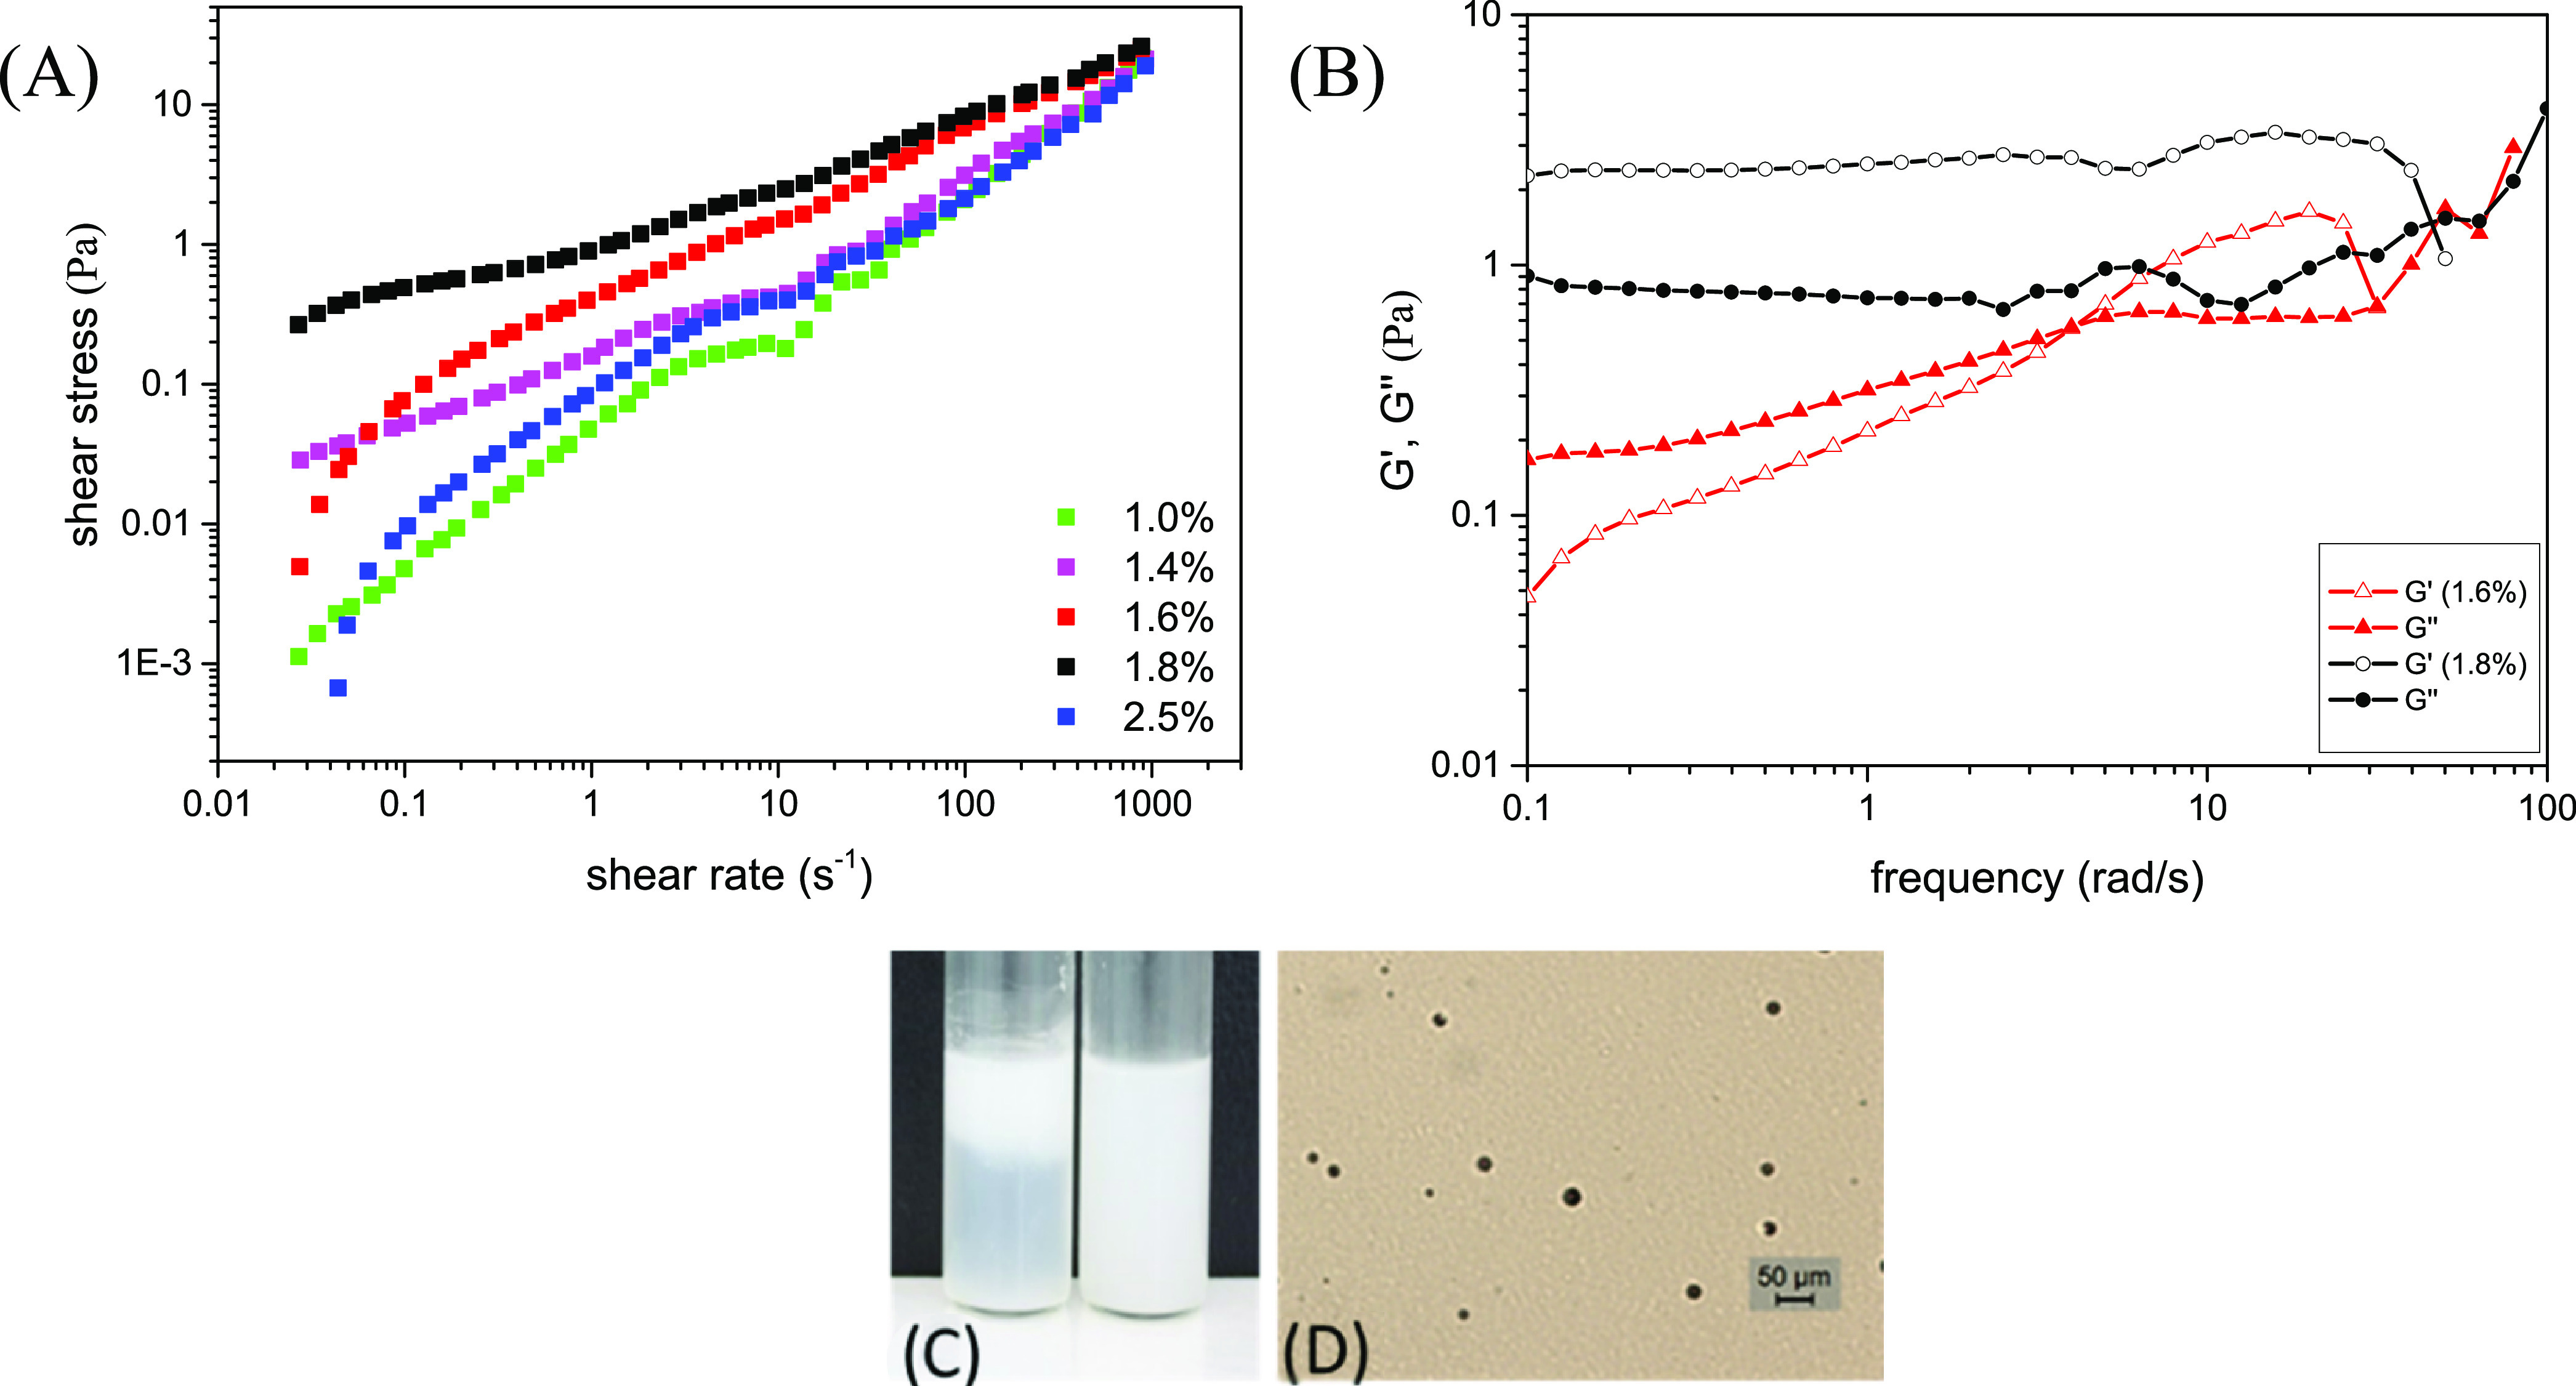
(A) Flow viscosity behavior of samples as a function of lauric acid concentration. (B) Oscillatory behavior of samples as a function of lauric acid concentration. (C) Dispersion of polymeric microcapsules in a microemulsion (left) and in a gel-like (right) formulation from the present study. Creaming of the microcapsules in the microemulsion is observed under storage at room temperature. (D) Microscopic image in a transmitted light of the complex viscoelastic fluid with dispersed microcapsules (black circles). The microscopy clearly shows the internal structure of the complex material.
With increasing lauric acid concentration, the shape of the flow curve is significantly modified, and the values of the shear stress increased. The flow curves for the samples at higher lauric acid concentrations (L1–L4) were fitted with the Herschel–Bulkley model65 (included in the SI, Section 6 and Figure S6). The solutions containing 1.4, 1.6, and 1.8% wt of lauric acid represent pseudo-plastic fluids with a flow index lower than 1. The structures of these samples were identified by scattering studies as micellar planar sheets arranged in a lamellar-type stacking.
Finally, at 2.5% wt of lauric acid (L4), the flow behavior changed again, presenting a narrow stress plateau and reduced shear stress values. This solution was identified by the scattering studies as showing the most ordered lamellar-type structure. The fit with the Herschel–Bulkley model revealed a flow behavior with a flow index equal to 1 and low yield stress (0.12 Pa). Such a flow index for a lamellar phase was obtained by Roux and co-workers66 for the lamellar phase composed of water, SDS, pentanol, and dodecane.
The oscillatory curves, presented in Figure 13B, disclosed viscoelastic behavior at 1.6 and 1.8% wt of lauric acid, which is well correlated to the 2D micellar sheet formation. However, the system seems very sensitive to the concentration of lauric acid. The relaxation time, calculated from the cross-point between G′ and G″, changes abruptly in a narrow range of the lauric acid concentration: the sample with 1.8% of lauric acid has a relaxation time τ > 10 s, whereas the sample at 1.6% of lauric acid revealed a relaxation time τ = 0.5 s.
According to some definitions of a gel,67 these samples could be considered physical gels, with suspensive properties, although having low values of G′ and G″. To confirm this feature, we dispersed 1% wt of fragranced microcapsules in the sample containing 1.6% wt of lauric acid and 1.8% wt of DHM. The internal viscoelastic network kept the polymeric capsules in a stable dispersion at the three temperatures required for storage stability, 3, 25, and 45 °C (Figure 13C,D), for at least 3 months. However, according to the definition of a gel as a nonflowing material, we cannot consider these samples as gels.
After reaching a concentration of 2.5% wt (L4) of lauric acid, the viscoelasticity is lost, and the sample behaves as a viscous fluid.
The flow behavior of the samples from the dilution line is presented in Figure 14A. The flow curve shape is modified with the increasing active matter content, in accordance with color pattern changes and SAXS results (Figures 8–10). The curves with 5.6% wt (Q6), 9.0% wt (Q5), and 12.5% wt (Q4) of active matter have a shape with a small but visible stress plateau. A change in the flow curve shape is observed when the active matter content is above 12.5%.
Figure 14.

Flow (A) and oscillatory (B) behavior of samples from the dilution line.
According to the explanation of the schematic flow behavior presented by Berret,65 the first three curves with active matter content lower than 19% wt could represent biphasic samples containing lamellar-like domains dispersed in the aqueous phase. The large repeating distances obtained in these samples allow the coexistence of a high-quantity aqueous phase intercalated between the sheets.
The small stress plateau on the flow curves disappeared at active matter concentrations above 12.5%, which could indicate the growth of the 2D lamellar-like fraction in the more concentrated samples, in accordance with the increased size of the colored domains in Figure 8. The curves can be fitted by a power law correlation between stress and the shear rate, showing a high concentration of 2D micellar sheets at all shear rates. The flow curve at 60% active matter is a Newtonian fluid with a linear dependence of the shear stress corresponding well to a microemulsion.
The oscillatory rheology measurements of the samples containing 33% (Q1), 25% (Q2), and 19% wt (Q3) of active matter manifested a viscoelastic behavior with a relaxation time decreasing with the dilution (Figure 14B). Below 19% wt of active matter, the mixtures are not viscoelastic. Interestingly, the SAXS data for these samples indicates a strong tendency for alignment in the samples, with relatively high orientational order parameter values ⟨P2⟩.
Viscoelasticity depends strongly on the hydrophobicity of the oil (Figure 15). The viscoelastic sample that solubilizes dihydromyrcenol is elastic in a small range of angular frequencies and have a mesh size value of 0.420 μm (4200 Å). The viscoelastic sample, which solubilizes the highly hydrophobic fragrance oil exaltolide, manifested elastic behavior in the whole frequency range with a lower mesh size of 0.300 μm (3000 Å). It should be recalled that the 2D sheets of micelles containing exaltolide showed the tendency to align along the capillary direction contrarily to the 2D sheets of micelles containing dihydromyrcenol.
Figure 15.

Oscillatory curves of gels containing (A) dihydromyrcenol and (B) exaltolide.
The shear moduli G′ and G″ have remarkably low values for gel-like materials.
4. Conclusions
Transparent complex (water + solvent)–surfactant–(fragrance oil + fatty acid) systems composed of 2D sheets of ellipsoidal micelles, arranged in a lamellar-like structure, were obtained by the mixing of fatty acid with nonionic microemulsions containing fragrance oils. The specific packing design, due to the nonhomogeneous distribution of the surfactant and fatty acid in the micelles, led to the formation of ellipsoidal micelles and their arrangement in 2D planar sheets constituting further the building blocks of a lamellar-like structure. We assume that the H-bonding interaction is responsible for the micelles clustering into large sheets and finally, into flexible planes. The presence of the H-bonding network was confirmed by FTIR analysis. The segregation of surface-active molecules and the unidimensional growth of the micelles, as well as the modification of the packing parameter, are key variables and, in oil-containing systems, could be controlled via the physical–chemical properties of each compositional compound, as shown in our previous studies.68
The two effects, 3D lamellar-type structure formation and local H-bridging between elongated micelles, led to the formation of low viscous, physical gel-like liquids above some critical concentration of the amphiphilic molecules. These complex fluid samples show extraordinary optical properties under polarizing filters. Rheology results unveiled the presence of a 3D network with a mesh size of up to 0.5 μm, allowing the retention of microscopic particles in a stable dispersion without the need for a polymeric thickener.
The fragranced complex fluids reported here are liquid delivery systems, which could be useful in many different fields such as the pharmaceutical, cosmetic, fragrance, and food industries. They are self-thickening, low viscous, flowable, sprayable, and transparent, and they appear as watery or slightly bluish liquids. They could represent a 2-in-1 liquid product capable of solubilizing free and encapsulated fragrance oil.
Acknowledgments
The authors would like to express their acknowledgment to Prof. Thomas Zemb (ICSM Marcoule, France) for the discussions concerning the structures and their evolution. The authors also thank M. Klein for the help in preparing Figure 5. The scattering experiments were performed on beamline ID02 at the European Synchrotron Radiation Facility (ESRF), Grenoble, France. The authors are grateful to Michael Sztucki (local contact at the ESRF) for providing assistance in using beamline ID02. The authors acknowledge the financial support from INCT/CNPq (Conselho Nacional de Desenvolvimento Científico e Tecnológico; Grant numbers: 465259/2014-6 and 303001/2019-4), INCT/FAPESP (Fundação de Amparo à Pesquisa do Estado de São Paulo; Grant Number: 14/50983-3), INCT/CAPES (Coordenação de Aperfeiçoamento de Pessoal de Nível Superior; Grant number: 88887.136373/2017-00), FAPESP (Thematic Project; Grant 2016/24531-3), and INCT-FCx (Instituto Nacional de Ciência e Tecnologia de Fluidos Complexos).
Supporting Information Available
The Supporting Information is available free of charge at https://pubs.acs.org/doi/10.1021/acsomega.3c03500.
Radial integrations and order parameter calculation, form factor and micelle aggregate investigation, SAXS fitting results, birefringence of samples from series L and 2D patterns for the sample L2-P, and flow curves of samples L0–L4 fitted with the Herschel–Bulkley equation (PDF)
The authors declare no competing financial interest.
Supplementary Material
References
- Schowell M.Handbook of Detergents, Part D: Formulation; CRC Press, Tailor&Francis Group, LLC, 2006. [Google Scholar]
- Laupheimer M.; Jovic K.; Antunes F. E.; Miguel M.; Stubenrauch C. Studying orthogonal self-assembled systems: phase behaviour and rheology of gelled microemulsions. Soft Matter 2013, 9, 3661–3670. 10.1039/c3sm27883b. [DOI] [Google Scholar]
- Dieterich S.; Prévost S.; Dargel C.; Sottmann Th.; Giesselmann F. Synergistic structures in lyotropic lamellar gels. Soft Matter 2020, 16, 10268–10279. 10.1039/D0SM01473G. [DOI] [PubMed] [Google Scholar]
- Brizard A. M.; Stuart M. C. A.; van Esch J. H. Self-assembled interpenetrating networks by orthogonal self-assembly of surfactants and hydrogelators. Faraday Discuss. 2009, 143, 345–357. 10.1039/b903806j. [DOI] [PubMed] [Google Scholar]
- Roux D.; Coulon C.; Cates M. E. Sponge phases in surfactant solutions. J. Phys. Chem. A 1992, 96, 4174–4187. 10.1021/j100190a017. [DOI] [Google Scholar]
- Diat O.; Roux D. Effect of Shear on Dilute Sponge Phase. Langmuir 1995, 11, 1392–1395. 10.1021/la00004a054. [DOI] [Google Scholar]
- Mahjoub H. F.; Bourgaux C.; Sergot P.; Kleman M. Evidence of a Sponge-to-Lamellar Phase Transition under Shear by X-Ray Scattering Experiments in a Couette Cell. Phys. Rev. Lett. 1998, 81, 2076–2079. 10.1103/PhysRevLett.81.2076. [DOI] [PubMed] [Google Scholar]
- Yamamoto J.; Tanaka H. Shear-Induced Sponge-to-Lamellar Transition in a Hyperswollen Lyotropic System. Phys. Rev. Lett. 1996, 77, 4390–4393. 10.1103/PhysRevLett.77.4390. [DOI] [PubMed] [Google Scholar]
- Pujolle-Robic C.; Noirez L. Observation of shear-induced nematic-isotropic transition in side-chain liquid crystal polymers. Nature 2001, 409, 167–171. 10.1038/35051537. [DOI] [PubMed] [Google Scholar]
- Tardani F.; Gentile L.; Ranieri G. A.; La Mesa C. Shear Orientation in Nematic Carbon Nanotube Dispersions: A Combined NMR Investigation. J. Phys. Chem. C 2013, 117, 8556–8562. 10.1021/jp4015349. [DOI] [Google Scholar]
- Gentile L.; Behrens M. A.; Porcar L.; Butler P.; Wagner N. J.; Olsson U. Multilamellar Vesicle Formation from a Planar Lamellar Phase under Shear Flow. Langmuir 2014, 30, 8316–8325. 10.1021/la501071s. [DOI] [PubMed] [Google Scholar]
- Oliveira C. L. P.; Gerbelli B. B.; Silva E. R. T.; Nallet F.; Navailles L.; Oliveira E. A.; Pedersen J. S. Gaussian deconvolution: a useful method for a form-free modeling of scattering data from mono-and multilayered planar systems. J. Appl. Crystallogr. 2012, 45, 1278–1286. 10.1107/S002188981204191X. [DOI] [Google Scholar]
- Nallet F.; Laversanne R.; Roux D. Modelling X-ray or neutron scattering spectra of lyotropic lamellar phases: interplay between form and structure factors. J. Phys. II 1993, 3, 487–502. 10.1051/jp2:1993146. [DOI] [Google Scholar]
- Hamley I. W. Diffuse scattering from lamellar structures. Soft Matter 2022, 18, 711–721. 10.1039/D1SM01758F. [DOI] [PubMed] [Google Scholar]
- Lawson D.; Flautt T. J. J. Magnetically Oriented Lyotropic Liquid Crystalline Phases. J. Am. Chem. Soc. 1967, 89, 5489–5491. 10.1021/ja00997a054. [DOI] [Google Scholar]
- Neto A. M. F.; Liébert L.; Galerne Y. Temperature and Concentration Range of the Biaxial Nematic Lyomesophase in the Mixture Potassium Laurate/1-Decanol/D2O. J. Phys. Chem. A 1985, 89, 3737–3739. 10.1021/j100263a030. [DOI] [Google Scholar]
- Yu L. J.; Saupe A. Liquid crystalline phases of the sodium decylsulfate/decanol/water system. Nematic-nematic and cholesteric-cholesteric phase transitions. J. Am. Chem. Soc. 1980, 102, 4879–4883. 10.1021/ja00535a006. [DOI] [Google Scholar]
- Neto A. M. F.; Salinas S. R. A.. The Physics of Lyotropic Liquid Crystals: Phase Transitions and Structural Properties; Oxford University Press: New York, U.S., 2005. [Google Scholar]
- Schwartz M.; Lenzini G.; Geng Y.; Rønne P. B.; Ryan P. Y. A.; Lagerwall J. P. F. Cholesteric liquid crystal shells as enabling material for information-rich design and architecture. Adv. Matter 2018, 30, 1707382 10.1002/adma.201707382. [DOI] [PubMed] [Google Scholar]
- Baza H.; Turiv T.; Li B.-X.; Li R.; Yavitt B. M.; Fukuto M.; Lavrentovich O. D. Shear-induced polydomain structures of nematic lyotropic chromonic liquid crystal disodium cromoglycate. Soft Matter 2020, 16, 8565–8576. 10.1039/D0SM01259A. [DOI] [PubMed] [Google Scholar]
- Radley K.; Reeves L. W.; Tracey A. S. Effect of counterion substitution on the type and nature of nematic lyotropic phases from nuclear magnetic resonance studies. J. Phys. Chem. A 1976, 80, 174–182. 10.1021/j100543a018. [DOI] [Google Scholar]
- Charvolin J.; Levelut A. M.; Samulski E. T. Lyotropic nematics: molecular aggregation and susceptibilities. J. Phys. Lett. 1979, 40, 587–592. 10.1051/jphyslet:019790040022058700. [DOI] [Google Scholar]
- Hendrikx Y.; Charvolin J. Structural relations between lyotropic phases in the vicinity of the nematic phases. J. Phys. 1981, 42, 1427–1440. 10.1051/jphys:0198100420100142700. [DOI] [Google Scholar]
- Neto A. M. F.; Galerne Y.; Levelut A. M.; Liébert L. Pseudo-lamellar ordering in uniaxial and biaxial lyotropic nematics: a synchrotron X-ray diffraction experiment. J. Phys. Lett. 1985, 46, 499–505. 10.1051/jphyslet:019850046011049900. [DOI] [Google Scholar]
- Yu L. J.; Saupe A. Observation of a Biaxial Nematic Phase in Potassium Laurate-1-Decanol-Water Mixtures. Phys. Rev. Lett. 1980, 45, 1000–1003. 10.1103/PhysRevLett.45.1000. [DOI] [Google Scholar]
- Neto A. M. F. The Physics of Lyotropic Nematic Liquid Crystals. Braz. J. Phys. 1992, 22, 85–91. [Google Scholar]
- Forrest B. J.; Reeves L. W. New lyotropic liquid crystals composed of finite nonspherical micelles. Chem. Rev. 1981, 81, 1–14. 10.1021/cr00041a001. [DOI] [Google Scholar]
- Muñoz J.; Alfaro M. C. Rheological and phase behaviour of amphiphilic lipids. Grasas Aceites 2000, 51, 6–25. 10.3989/gya.2000.v51.i1-2.403. [DOI] [Google Scholar]
- Davidson P.; Penisson C.; Constantin D.; Gabriel J-C. P. Isotropic, nematic, and lamellar phases in colloidal suspensions of nanosheets. Proc. Natl. Acad. Sci. U.S.A. 2018, 115, 6662–6667. 10.1073/pnas.1802692115. [DOI] [PMC free article] [PubMed] [Google Scholar]
- Yamamoto J.; Tanaka H. Transparent nematic phase in a liquid-crystal-based microemulsion. Nature 2001, 409, 321–325. 10.1038/35053035. [DOI] [PubMed] [Google Scholar]
- Poulin P.; Weitz D. A. Inverted and multiple nematic emulsions. Phys. Rev. E 1998, 57, 626–637. 10.1103/PhysRevE.57.626. [DOI] [Google Scholar]
- Huang C.-Y.; Petschek R. G.. Annual March Meeting; American Physical Society: Minneapolis, MN, U.S., 2000.
- Narayanan T.; Sztucki M.; Van Vaerenbergh P.; Leonardon J.; Gorini J.; Claustre L.; Sever F.; Morse J.; Boesecke P. A multipurpose instrument for time-resolved ultra-small-angle and coherent X-ray scattering. J. Appl. Crystallogr. 2018, 51, 1511–1524. 10.1107/S1600576718012748. [DOI] [PMC free article] [PubMed] [Google Scholar]
- Deutsch M. Orientational order determination in liquid crystals by x-ray diffraction. Phys. Rev. A 1991, 44, 8264–8270. 10.1103/PhysRevA.44.8264. [DOI] [PubMed] [Google Scholar]
- Santos O. R.; Reis D.; Oliveira-Filho A. G.; Oliveira C. L. P.; Neto A. M. F. Structure and local order of lyotropic cholesteric calamitic phases: The effect of the chiral molecule. J. Mol. Liq. 2022, 349, 118097 10.1016/j.molliq.2021.118097. [DOI] [Google Scholar]
- Hamley I. W.Introduction to Soft Matter: Polymers, Colloids, Amphiphiles and Liquid Crystals; WILEY, 2000; pp 286–304. [Google Scholar]
- Glatter O. A new method for the evaluation of small-angle scattering data. J. Appl. Crystallogr. 1977, 10, 415–421. 10.1107/S0021889877013879. [DOI] [Google Scholar]
- Oliveira C. L. P.; Behrens M. A.; Pedersen J. S.; Erlacher K.; Otzen D.; Pedersen J. S. A SAXS Study of Glucagon Fibrillation. J. Mol. Biol. 2009, 387, 147–161. 10.1016/j.jmb.2009.01.020. [DOI] [PubMed] [Google Scholar]
- Oliveira C. L. P.Investigating Macromolecular Complexes in Solution by Small Angle X-Ray Scattering. In Current Trends in X-Ray Crystallography; Chandrasekaran A., Eds.; InTech, 2011; pp 367–392. [Google Scholar]
- Förster S.; Timmann A.; Konrad M.; Schellbach C.; Meyer A.; Funari S. S.; Mulvaney P.; Knott R. Scattering Curves of Ordered Mesoscopic Materials. J. Phys. Chem. B 2005, 109, 1347–1360. 10.1021/jp0467494. [DOI] [PubMed] [Google Scholar]
- Sharma S. C.; Abe M.; Aramaki K.. Self-Organized Surfactant Structures; WILEY-VCH Verlag GmbH & Co.: KGaA, Weinheim, 2010. [Google Scholar]
- Mezzenga R.; Meyer C.; Servais C.; Romoscanu A. I.; Sagalowicz L.; Hayward R. C. Shear rheology of lyotropic liquid crystals: a case study. Langmuir 2005, 21, 3322–3333. 10.1021/la046964b. [DOI] [PubMed] [Google Scholar]
- Beck R.; Hoffmann H.. Bicontinuous Liquid Crystals; Lynch M. L.; Spicer P., Eds.; CRC Press, Tailor&Francis Group, LLC, 2005; Vol. 127. [Google Scholar]
- Varade D.; Sharma S. C.; Aramaki K. Wormlike micelles in Tween-80/CmEO3 mixed nonionic surfactant systems in aqueous media. J. Colloid Interface Sci. 2007, 312, 489–497. 10.1016/j.jcis.2007.02.090. [DOI] [PubMed] [Google Scholar]
- Morrow B. H.; Koenig P. H.; Shen J. K. Atomistic simulations of pH-dependent self-assembly of micelle and bilayer from fatty acids. J. Chem. Phys. 2012, 137, 194902 10.1063/1.4766313. [DOI] [PMC free article] [PubMed] [Google Scholar]
- Neto A. M. F. The Physics of Lyotropic Nematic Liquid Crystals. Braz. J. Phys. 1992, 22, 85–91. [Google Scholar]
- Holmes M. C.; Leaver M. S.; Smith A. M. Nematic and Disrupted Lamellar Phases in Cesium Pentadecafluorooctanoate/2H2O: A Small Angle Scattering Study. Langmuir 1995, 11, 356–365. 10.1021/la00001a058. [DOI] [Google Scholar]
- Pelletier O.; Bourgaux C.; Diat O.; Davidson P.; Livage J. A small-angle X-ray scattering study of the isotropic and nematic phases of V2O5 suspensions. Eur. Phys. J. E 2000, 2, 191–198. 10.1007/PL00013663. [DOI] [Google Scholar]
- Duvail M.; Dufrêche J.-F.; Arleth L.; Zemb Th. Mesoscopic modelling of frustration in microemulsions. Phys. Chem. Chem. Phys. 2013, 15, 7133–7141. 10.1039/c3cp43981j. [DOI] [PubMed] [Google Scholar]
- Demé B.; Debois M.; Gulik-Krzywicki T.; Zemb T. Giant Collective Fluctuations of Charged Membranes at the Lamellar-to-Vesicle Unbinding Transition. 1. Characterization of a New Lipid Morphology by SANS, SAXS, and Electron Microscopy. Langmuir 2002, 18, 997–1004. 10.1021/la010723b. [DOI] [Google Scholar]
- Dubois M.; Zemb T. Phase behavior and scattering of double-chain surfactants in diluted aqueous solutions. Langmuir 1991, 7, 1352–1360. 10.1021/la00055a011. [DOI] [Google Scholar]
- Anachkov S. E.; Georgieva G.; Abezgauz L.; Danino D.; Kralchevsky P. Viscosity Peak due to Shape Transition from Wormlike to Disklike Micelles: Effect of Dodecanoic Acid. Langmuir 2018, 34, 4897–4907. 10.1021/acs.langmuir.8b00421. [DOI] [PubMed] [Google Scholar]
- Colafemmina G.; Recchia R.; Ferrante A. S.; Amin S.; Palazzo G. Lauric acid-induced formation of a lyotropic nematic phase of disk-shaped micelles. J. Phys. Chem. B 2010, 114, 7250–7260. 10.1021/jp1020774. [DOI] [PubMed] [Google Scholar]
- Powell J.; Kalakewich K.; Uribe-Romo F. J.; Harper J. K. Solid-state NMR and DFT predictions of differences in COOH hydrogen bonding in odd and even numbered n-alkyl fatty acids. Phys. Chem. Chem. Phys. 2016, 18, 12541–12549. 10.1039/C6CP00416D. [DOI] [PubMed] [Google Scholar]
- Sato T.; Saito Y.; Anazawa I. Micellar structure, and micellar inner polarity of octaethylene glycol n-alkyl ethers. J. Chem. Soc., Faraday Trans. 1 1988, 84, 275–279. 10.1039/f19888400275. [DOI] [Google Scholar]
- Morrow B. H.; Wang Y.; Wallace J. A.; Koenig P. H.; Shen J. K. Simulating pH titration of a single surfactant in ionic and nonionic surfactant micelles. J. Phys. Chem. B 2011, 115, 14980–14990. 10.1021/jp2062404. [DOI] [PubMed] [Google Scholar]
- da Silva F. L. B.; Bogren D.; Söderman O.; Åkesson T.; Jönsson B. Titration of fatty acids solubilized in cationic, nonionic, and anionic micelles. Theory and experiment. J. Phys. Chem. B 2002, 106, 3515–3522. 10.1021/jp012033m. [DOI] [Google Scholar]
- Combet J. Polyelectrolytes and small angle scattering. EPJ Web Conf. 2018, 188, 03001 10.1051/epjconf/201818803001. [DOI] [Google Scholar]
- Pielichowska K.; Głowinkowski S.; Lekki J.; Binias D.; Pielichowski K.; Jenczyk J. PEO/fatty acid blends for thermal energy storage materials. Structural/morphological features and hydrogen interactions. Eur. Polym. J. 2008, 44, 3344–3360. 10.1016/j.eurpolymj.2008.07.047. [DOI] [Google Scholar]
- a Rehage H.; Hoffmann H. J. Viscoelastic surfactant solutions: model systems for rheological research. Phys. Chem. 1988, 92, 4712–4719. 10.1021/j100327a031. [DOI] [PubMed] [Google Scholar]; b Rehage H.; Hoffmann H. Viscoelastic surfactant solutions: model systems for rheological research. Mol. Phys. 1991, 74, 933–973. 10.1080/00268979100102721. [DOI] [Google Scholar]
- Berret J. F. Transient rheology of wormlike micelles. Langmuir 1997, 13, 2227–2234. 10.1021/la961078p. [DOI] [Google Scholar]
- Spenley N. A.; Cates M. E.; MacLeish T. C. B. Nonlinear rheology of wormlike micelles. Phys. Rev. Lett. 1993, 71, 939–942. 10.1103/PhysRevLett.71.939. [DOI] [PubMed] [Google Scholar]
- Schmitt V.; Lequeux F.; Pousse A.; Roux D. Flow Behavior and Shear Induced Transition near an Isotropic/Nematic Transition in Equilibrium Polymers. Langmuir 1994, 10, 955–961. 10.1021/la00015a057. [DOI] [Google Scholar]
- Berret J.-F.; Roux D. C.; Porte G.; Lindner P. Shear-induced isotropic-to-nematic phase transition in equilibrium polymers. Europhys. Lett. 1994, 25, 521–526. 10.1209/0295-5075/25/7/008. [DOI] [Google Scholar]
- Gentile L.; Amin S.. Rheology Primer for Nanoparticle Scientists. In Colloidal Foundations of Nanoscience; Elsevier, 2022; pp 289–306. [Google Scholar]
- Roux D.; Nallet F.; Diat O. Rheology of lyotropic lamellar phases. Europhys. Lett. 1993, 24, 53–59. 10.1209/0295-5075/24/1/009. [DOI] [Google Scholar]
- Nishinari K.Some Thoughts on The Definition of a Gel. In Gels: Structures, Properties, and Functions; Springer, 2009; Vol. 136, pp 87–94. [Google Scholar]
- Tchakalova V.; Testard F.; Wong K.; Parker A.; Benczédi D.; Zemb T. Solubilization and interfacial curvature in microemulsions I. Interfacial expansion and co-extraction of oil. Colloids Surf., A 2008, 331, 31–39. 10.1016/j.colsurfa.2008.07.061. [DOI] [Google Scholar]
Associated Data
This section collects any data citations, data availability statements, or supplementary materials included in this article.