

ABSTRACT
Bacterial capsules provide protection against environmental challenges and host immunity. Historically, Escherichia coli K serotyping scheme, which relies on the hypervariable capsules, has identified around 80 K forms that fall into four distinct groups. Based on recent work by us and others, we predicted that E. coli capsular diversity is grossly underestimated. We exploited group 3 capsule gene clusters, the best genetically defined capsule group in E. coli, to analyze publicly available E. coli sequences for overlooked capsular diversity within the species. We report the discovery of seven novel group 3 clusters that fall into two distinct subgroups (3A and 3B). The majority of the 3B capsule clusters were found on plasmids, contrary to the defining feature of group 3 capsule genes localizing at the serA locus on the E. coli chromosome. Other new group 3 capsule clusters were derived from ancestral sequences through recombination events between shared genes found within the serotype variable central region 2. Intriguingly, flanking regions 1 and 3, known to be conserved areas among capsule clusters, showed considerable intra-subgroup variation in clusters from the 3B subgroup, containing genes of shared ancestry with other Enterobacteriaceae species. Variation of group 3 kps clusters within dominant E. coli lineages, including multidrug-resistant pathogenic lineages, further supports that E. coli capsules are undergoing rigorous change. Given the pivotal role of capsular polysaccharides in phage predation, our findings raise attention to the need of monitoring kps evolutionary dynamics in pathogenic E. coli in supporting phage therapy.
IMPORTANCE Capsular polysaccharides protect pathogenic bacteria against environmental challenges, host immunity, and phage predations. The historical Escherichia coli K typing scheme, which relies on the hypervariable capsular polysaccharide, has identified around 80 different K forms that fall into four distinct groups. Taking advantage of the supposedly compact and genetically well-defined group 3 gene clusters, we analyzed published E. coli sequences to identify seven new gene clusters and revealed an unexpected capsular diversity. Genetic analysis revealed that group 3 gene clusters shared closely related serotype-specific region 2 and were diversified through recombination events and plasmid transfer between multiple Enterobacteriaceae species. Overall, capsular polysaccharides in E. coli are undergoing rigorous change. Given the pivotal role capsules play in phage interactions, this work highlighted the need to monitor the evolutionary dynamics of capsules in pathogenic E. coli for effective phage therapy.
KEYWORDS: capsular polysaccharide, surface polysaccharide, evolution, Escherichia coli, phage receptor, glycobiology, evolutionary biology, polysaccharides
INTRODUCTION
The cell surface of many Escherichia coli strains is enveloped in a gelatinous layer composed of tightly packed strands of long-chain polysaccharides called capsular polysaccharide or capsule (1). E. coli capsules are structurally diverse: over 80 capsular serotypes are known to date and referred to as different K antigens in the E. coli serotyping scheme (2). Cell encapsulation, plus the structural heterogeneity of capsules, protects the bacterium against various environmental stresses (3–6).
Capsular polysaccharide is instrumental in host-pathogen and predator-prey interactions with phages (7). While some capsules in E. coli, such as K1 and K92, were found to interrupt the host complement cascade to escape innate immunity, encapsulation by other capsule types, such as K5, does not confer serum resistance (8, 9). Several additional studies also revealed cases where the production of a surface capsule could enhance phagocytosis by the host (8, 9). The role of capsules in phage interactions is also complex. Some capsules are protective against phage attacks by providing an effective physical barrier, but others often constitute the primary receptor for the binding of the phage tail spikes (10–14).
The biosynthetic machineries for different capsular polysaccharides are also complex. Four bacterial polysaccharide pathways are known, but the most exploited biosynthetic pathways are the Wzx/Wzy-dependent and ATP-binding-cassette (ABC) transporter pathways (1, 15–21). Relative to other bacterial species, the capsular polysaccharide pathways in E. coli are arguably the most complex. First, E. coli employs both major pathways (Wzx/Wzy and ABC pathways) for capsular biosynthesis (1); second, these capsular biosynthetic pathways could be further divided into four distinct groups (groups 1 to 4) based on differences in the biosynthetic process, gene cluster arrangement and mode of regulation control (1). The chromosomal loci harboring the capsular gene clusters (kps) also differ. Group 1 and 4 kps gene clusters are localized to the galF/gnd locus, while several group 2 and 3 kps gene clusters were mapped near the serA locus through Southern blot analysis (1) (Fig. 1A).
FIG 1.

E. coli group 3 capsule loci and known repeat-unit structures. (A) The kps locus in the genetic map of the E. coli chromosome (drawn based on the linkage maps by B. J. Bachmann, 61). (B) Known group 3 capsular structures. (C) Relative evolutionary divergence between subgroups 3A and 3B at family level. Fig. 1B and C were redrawn from reference 23. OAc, O-acetyl group; Rha, rhamnose; KDO, keto-deoxyoctulosonate; GlcA, glucuronic acid; Thr, threonine; Ser, serine; Fru, fructose; Qui4NMal, 4,6-dideoxy-4-malonylaminoglucose, and Glc, glucose. Note that theonine/serine and K54 were highlighted in red to indicate that the modification is K54 exclusive.
Group 2 and 3 capsules are made by the ABC transporter pathway (1). While group 2 capsules have been well studied, comparatively little is known about group 3 structure and function, with most of our understanding being inferred from biochemical and structural characterizations of group 2 (1). The ABC transporter pathway involves the synthesis of complete polysaccharide strands linked to a short poly-Kdo linker on a lipid carrier, lyso-phosphatidylglycerol, at the cytosolic face of the cytoplasmic membrane (22). The termination steps in biosynthesis are coupled to the transport of the polysaccharide to the periplasmic face, then to the cell surface by an ABC transporter complex consisting of at least four proteins KpsDEMT (1). Like all genetically defined group 2 kps clusters, group 3 clusters share a three-region gene organization format, except they encode the conserved ABC transporter genes (kpsDMTE) in region 1 (instead of region 3 in group 2), and the kpsCS genes for Kdo oligosaccharide linker assembly are in region 3 (instead of region 1 in group 2) (see Fig. 2A). In both groups, the conserved regions 1 and 3 flank the variable central region 2 that houses serotype-specific genes dedicated to the synthesis of nucleoside sugars (and other structural components) and glycosyltransferases (GTs) (23). We recently uncovered unexpectedly high sequence divergence in the “conserved” regions 1 and 3 of group 3 kps clusters, leading to their further division into subgroup 3A and 3B (Fig. 1C) (23). Given their long evolutionary history, we predict that further variation must exist within group 3 capsules that we set out to uncover.
FIG 2.

Newly identified E. coli K-antigen group 3 gene clusters. (A) Organization of group 3 kps gene cluster. (B) Region 2 of three new subgroup 3A (and previously identified TBA_2) kps clusters. (C) Region 2 of four new subgroup 3B kps clusters. Genes were colored accordingly to putative functions. The identity (%) between related genes was given, except for those with identity above 98%. The dotted shade between TBA_5 and TBA_6 indicates the region corresponding to the 3′ end of the wsaE gene sharply displaced by the insertion of an unrelated transposase gene.
Novel K serotypes are frequently reported for many species, such as Klebsiella pneumoniae (24). This is not the case for E. coli, where the degree of capsular diversity is commonly believed to be close to final (25–27). However, two recent independent studies suggest otherwise (23, 28). First, Nanayakkara et al. reported that some E. coli strains from phylogroups A, B1, and C had acquired Klebsiella capsules at the galF/udg locus reminiscent of group 1 capsules in E. coli (28). Our recent genetic analysis of group 3 capsules also supports that kps diversity in E. coli is underestimated (23). Only six group 3 capsular serotypes were recognized in E. coli until very recently (2). While their structures were elucidated in the 1990’s (29–33) (shown in Fig. 1B), their genetic loci were uncharacterized until recently, leaving only K3 and K98 to be genetically determined (23, 34). Our analysis also identified three novel group 3 gene clusters from publicly available E. coli genomes that could not be assigned to either K3 or K98, demonstrating that the total number of group 3 kps clusters exceeds those previously described (23).
Here, we exploited the compact and genetically defined group 3 kps clusters to assess the degree to which novel kps types circulating in E. coli have been overlooked. We report the discovery of seven new kps gene clusters in E. coli. Rather than taking a phylogenetic approach, we used the existing group 3 sequences to establish the framework explaining how the diversity in related E. coli group 3 kps clusters may have evolved. Remarkably, subgroup 3B kps gene clusters, but not 3A, are mainly present in plasmids. This contradicts conventional knowledge stating that all group 3 clusters are proximal to the serA gene on the E. coli chromosome. There is also clear evidence for a set of related 3B clusters being shared between multidrug-resistant (MDR) E. coli strains and other Enterobacteriaceae family members. Given the vital role of capsular polysaccharides in phage predation and interactions, it is critical to characterize and monitor the dynamics of change for kps clusters in pathogenic E. coli strains.
RESULTS
Identification of seven novel group 3 kps gene clusters.
GenBank survey of all published E. coli sequences using kps conserved regions 1 and 3 from K10 and K11 (representatives of subgroups 3A and 3B, respectively) revealed seven new group 3 kps gene clusters carrying previously unreported region 2 sequences (Fig. 2B and C). Due to the lack of sufficient information to assign new gene clusters to the remaining known structures of either K3 or K98, we continue to use the temporary to-be-assigned (TBA) nomenclature adopted in our earlier work (23). We propose that these seven gene clusters, TBA_4 to TBA_10, code to synthesize novel capsule serotypes. Note that whether these gene clusters are functional needs further experimental validations. For accessions and precise localization of genomic and plasmid sequences, see Table S1.
Our previous analysis revealed a block of strikingly conserved genes encoding enzymes for dTDP-Rha biosynthesis (rmlBDAC genes) in the serotype-specific region 2 of all group 3 gene clusters, except K11 (subgroup 3B). Three conserved GT genes were also identified immediately upstream of the rml genes (wckC-wsaE-wckE or wckI-wsaE-wckE in 3A clusters and wckUVW in 3B clusters). This 3-GT block was proposed for synthesizing a complex oligosaccharide linker (23). In the present study, five of the seven new kps gene clusters (TBA_4 to TBA_8) also contained the rmlBDAC genes (Fig. 2B and C). In all cases but TBA_6, the conserved 3-GT block is identified upstream of the rml genes (Fig. 2B and C). The tight coexistence with rml genes with the 3-GT block and the finding that the TBA_6 cluster only contains the rml genes suggests that the proposed linker likely contains Rha.
A consensus feature of group 3 kps gene clusters is that they are located on a chromosomal locus close to the serA gene (Fig. 1A) (1). Consistent with this, all eight subgroup 3A clusters were localized within 20 to 150 kb upstream of the serA gene and downstream of the rrfG gene (Fig. 3A). However, all 3B clusters, except TBA_3 (Fig. 3A), were present in plasmid sequences instead of mapping to the serA chromosomal locus of E. coli (Fig. 3B). Note that K11, TBA_7, TBA_9, and TBA_10 clusters are flanked by conserved IS1 transposase elements that may be instrumental in mobilizing these kps loci (Fig. 3B).
FIG 3.

Localization of group 3 kps gene clusters. (A) Subgroup 3A clusters and the only 3B cluster TBA_3 are mapped to a position on the E. coli chromosome flanked distantly by the 23S rRNA rrfG and serA genes. (B) Subgroup 3B clusters were detected on plasmids. The full plasmid sequence carrying the K11 kps gene cluster (CP103510.1) was compared against other 3B plasmids. The innermost ring shows GC content, following by ring showing sequential comparisons to another K11 plasmid, and then plasmids carrying TBA_7, TBA_8, TBA_9, and TBA_10 kps clusters against CP103510.1 (K11).
Region 2 typically encodes GTs and synthetases required to make specialized nucleotide sugars and precursors for other structural constituents. In this respect, the gene content of region 2 in the new clusters provided a reasonable way to assess the level of complexity for the repeat unit for which structural information remains unknown. Out of the seven newly identified clusters, all but TBA_4 and TBA_10 carry an additional copy of the udg gene for UDP-glucuronic acid (GlcA) biosynthesis, suggesting the five group 3 clusters likely produce an acidic capsule (Fig. 2). Other synthetases potentially encode structural component precursors, CMP-sialic acid, myco-inositol, CMP-N-acetylneuraminic acid (Neu5Ac), UDP-galactofuranose (Galf), UDP-N-acetyl-mannosamine (ManNAc), UDP-N-acetylmannosaminuronic acid (ManNAcA), as well as modification genes encoding O-acetylase, methyltransferase, and sulfotransferase (Fig. 2). Two to five GT genes were identified in region 2 in each of these seven clusters (Fig. 2), but we currently lack structural data to assign any speculative functions.
Several subgroup 3A gene clusters have likely originated by diversification from ancestral forms using shared central region genes.
Although the conserved regions 1 and 3 may be the primary recombination spot for diversity in the kps locus, it is hard to speculate their history confidently, given that currently observed cluster forms are likely derived from intermediate forms no longer in existence. However, the central regions (region 2) of the newly identified TBA_4, TBA_5, and TBA_6 kps clusters are very similar to that from TBA_2 (Fig. 2). Aside from sharing almost identical rml genes, two GT genes immediately after the conserved region 1 were prevalent in all three kps clusters and shared ~ 92% nucleotide identity to wckM and wckN from TBA_2 (CA696_004240 and CA696_004245 respectively, in CP023142.1). These traits suggest that diversification may have occurred through recombination at these shared region 2 genes. DualBrothers was used initially to detect potential recombination events between these three gene clusters (35). Nonetheless, genetic changes could not be inferred, presumably because of the large, gapped regions in the variable central region; therefore, substitution patterns were instead employed to investigate the history of the kps clusters (Fig. 4).
FIG 4.
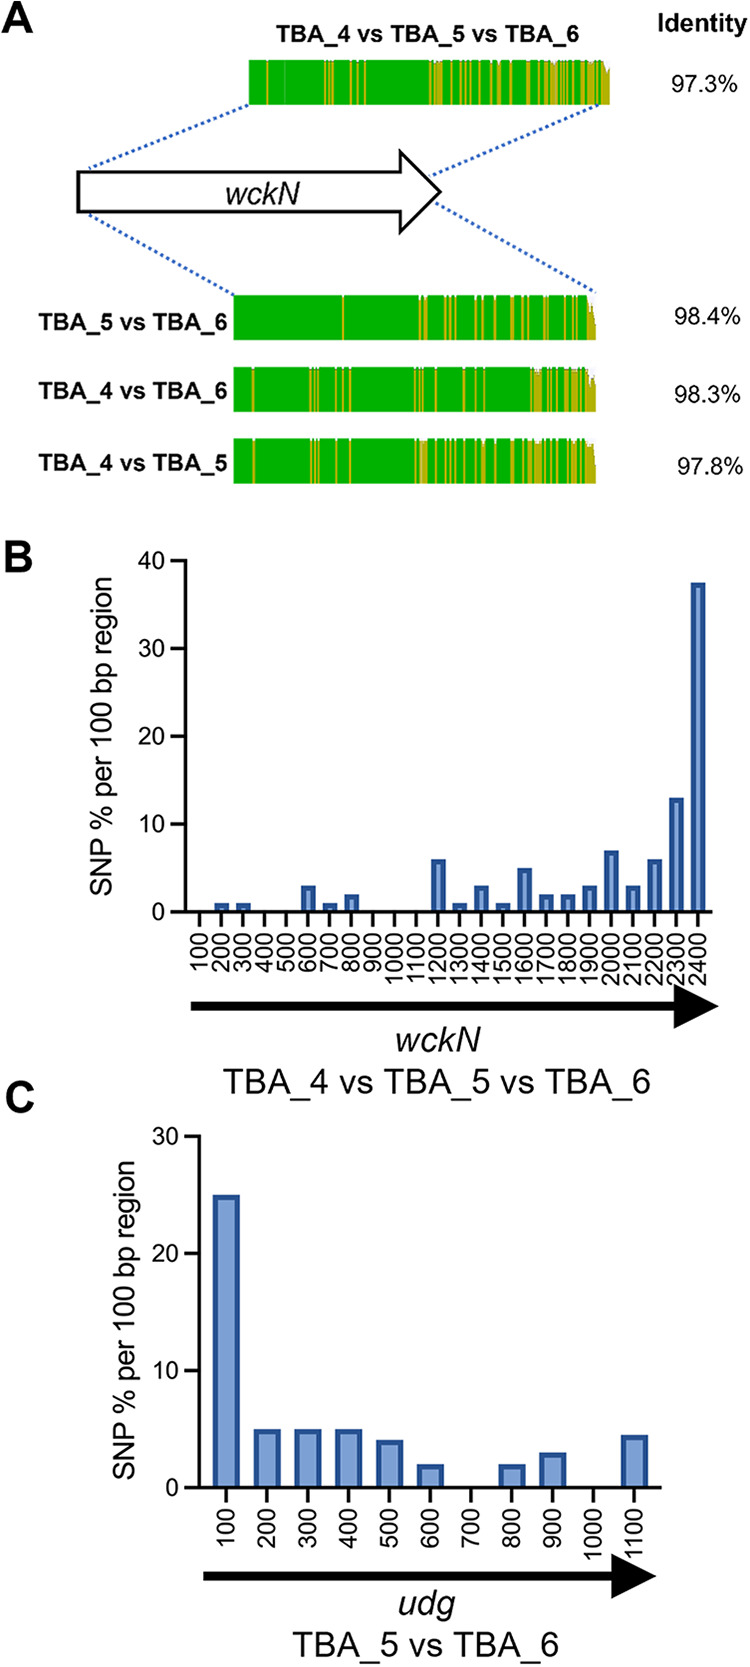
SNP distribution frequencies reveal putative recombination points between TBA_4, TBA_5, and TBA_6 clusters. (A) The ClustalW aligned identity map of the wckN gene from TBA_4, TBA_5, and TBA_6. Note that the score identity from TBA_4 versus TBA_5 versus TBA_6 was derived from multiple sequence alignment while the rest were identity scores from pairwise comparisons. (B) SNP density of the wckN gene sequences from TBA_4/5/6 clusters over 100 bp regions. (C) SNP density of the udg gene between TBA_5 and TBA_6. The SNP density was calculated as the percentage of nucleotide substitutions across regions of 100 bp length. Note that the numerical values at the x axis in panels B and C refers to the positions of gene sequences being compared.
A cluster of substitutions was observed at the 3′ end of the wckN gene between TBA_4, TBA_5, and TBA_6 (Fig. 4A). Furthermore, SNP density analysis revealed a sharp increase (from less than 10% to 37%) in the last 100 bp region of the GT gene (Fig. 4B). A central region is shared between TBA_4 and TBA_6 to TBA_5 (Fig. 2B). TBA_5 and TBA_6 clusters host an almost identical udg gene (95.2%) similar to the orthologue in TBA_2 (92.2% and 91.9% identity, respectively), while this gene is absent in TBA_4. In TBA_6, although the genes after udg are annotated as four hypothetical genes and a putative carnitine oxidoreductase gene, they are homologous to a related hypothetical gene, and wckC-wsaE proposed to be involved in linker synthesis shared by diverse group 3.
Remarkably, a similar but reversed SNP density pattern in wckM/wckN was observed in the shared udg gene between TBA_5 and TBA_6, with 25% substitutions found in the first 100 bp of the gene that then quickly declined to below 5% (Fig. 4C). It seems highly likely that wckN and udg (for TBA_5 and TBA_6) constitute part of the recombination hot spot that gave rise to TBA_4, TBA_5, and TBA_6 clusters. However, the relationship of TBA_4, TBA_5, and TBA_6 is further complicated by additional differences observed further down the 3′ end and just before the rml genes (Fig. 2B). These variations might be related to transposase activities. The evidence is particularly strong for TBA_6; most of the putative carnitine oxidoreductase sequence resembles that of the wsaE gene (97.1%), and an InsA10 transposase gene displaces the 3′ end sequence from the reverse complement direction (Fig. 2B).
Plasmid-borne TBA_7 and TBA_8 clusters are highly related to the chromosomal TBA_3 kps cluster.
Three 3B clusters, including TBA_3, TBA_7, and TBA_8, shared similar gene content in central region 2. Thus, we determine the SNP densities in their shared/conserved loci to investigate common ancestry. Region 2 in TBA_3 and TBA_8 differed only in the presence of two distinctive genes (Fig. 5A). Although the first two region 2 genes were almost identical between the two clusters, we identified 87 nucleotide substitutions condensed in the last 664 bp of the second region 2 gene (locus tag: BHT24_16990 for TBA _3) (Fig. 5D). Interestingly, continuous substitutions involving four spikes of high SNP densities between TBA_3 and TBA_8 were observed from udg through to wckU but this pattern suddenly disappeared in the subsequent wckV gene (Fig. 5E). Based on the observed substitution patterns, we propose recombination occurred at BHT24_16990 in TBA_3 (or equivalent locus in TBA_8) and the udg-wckV gene. In this case, the several spikes of SNP density may represent footprints of multiple previous recombination events in this locus.
FIG 5.

SNP analysis of shared genes between TBA_3, TBA_7, and TBA_8 kps clusters. (A) Region 2 of TBA_7 and TBA_8 clusters from plasmids are highly related to the chromosomal TBA_3 cluster (identities were derived from pairwise comparisons with each related gene from TBA_7 and TBA_8 to TBA_3). Where no numbers are shown, it denotes genes with a pairwise identity of > 98% to reference TBA_3 sequences. (B and C) SNP density maps for related genes from TBA_7 and TBA_3. (D and E) SNP density maps of related genes from TBA_8 and TBA_3. The SNP density was calculated as the percentage of nucleotide substitutions present across regions of 100 bp length. Note that the numerical values at the x axis in panels B, C, D, and E refers to the positions of gene sequences being compared.
TBA_7 is also very similar to TBA_3 and TBA_8. However, many shared genes in region 2, including the 3-GT block and several rml genes, contained strings of contiguous substitutions compared to TBA_3 and TBA_8 (Fig. 5A). Interestingly, this substitution pattern was sharply halted at the first region 2 gene immediately after region 1, a SAM-dependent methyltransferase gene. Most nucleotide substitutions (41 nucleotides) identified in the shared methyltransferase gene between TBA_3 and TBA_7 were clustered to the last 263 bp of the coding sequence (Fig. 5B). The dTDP Rha biosynthesis genes are remarkably conserved, and cases where they showed varied substitutional patterns often reflects recombination history (36, 37), and was discussed in detail by Reeves et al. (38). Interestingly, although rmlBAD genes are almost all identical between TBA_3 and TBA_8 (>99.7% identity), only the rmlC gene just before region 3 is identical between the three clusters (Fig. 5C). The overall pattern suggests that rmlC served as another recombination junction. It appears that region 2 in TBA_3 (and TBA_8) has a separate lineage of origin from that of TBA_7.
Insights into the evolution of subgroup 3B kps clusters from other Enterobacteriaceae species.
We previously posited that subgroups 3A and 3B have been diverging for an enormous amount of time before appearing in E. coli (Fig. 1C) (23). The finding that 3B clusters are often present on plasmids suggests they are a relatively recent acquisition by E. coli. Bacterial surface polysaccharide gene clusters typically have a lower GC content (≤ 40%) than the genome average of E. coli. This atypical GC % provides a strong basis to indicate that the clusters were acquired by lateral transfer and allows tightly controlled expression in the host species through rare codons and H-NS silencing (39). All subgroup 3A clusters maintain a consistent GC content at 40% to 43%, in line with that expectation. In contrast, the GC content of subgroup 3B gene clusters is considerably higher than that of 3A clusters (between 46.3% and 52.2%, except TBA_9 at 44.3% due to a 39.8% GC region 2), including TBA_3, the only 3B cluster found on the chromosome of E. coli (Table S1). Higher GC content areas were particularly observed across conserved kps regions 1 (~ 50%) and 3 (≥ 56%) and supports an independently evolving ancestry of 3B from subgroup 3A clusters.
Extended sequence searches among non-E. coli sequences present in GenBank using the conserved regions 1 and 3 from the K11 cluster (MG736913.1) revealed high identity chromosomal and plasmid sequence hits in Leclercia, Citrobacter, and Enterobacter species (Table 1). The non-E. coli chromosomal sequence hits in particular hold interest, as they may reveal the origins of subgroup 3B clusters. Interestingly, region 1 from K11 had the highest identity to Leclercia sp. G3L (CP088265.1), although much less identity is shared between their region 3 sequences (86.19%). Region 3 of K11 resembled that of Leclercia sp. W17 (CP031101.1) at 95.86%, but this is not the case across region 1. To investigate this further, phylogenetic trees were constructed for region 1 and region 3, using sequences from all six 3B clusters from E. coli and the eight chromosomal 3B-like clusters (Table 1) from Leclercia and Citrobacter (Fig. 6). It is expected that if the two kps regions in subgroup 3B clusters have evolved from a single progenitor, the two trees would share similar topologies. Indeed, this is the case for clusters TBA_3, TBA_7, and TBA_8, suggesting they have likely diverged through horizontal gene transfer using shared genes within region 2 (Fig. 5). This finding supports the use of tree topology to infer the origins of kps regions considered to be conserved (Fig. 6A and B).
Table 1.
Genome and plasmid sequences from non-E. coli species and strains encoding subgroup 3B-like kps clustersa
| Bacteria | Location | Accession No. | Position (Start to End) | Region 1 % NT.ID b (% coverage) |
Region 3 % NT.ID (% coverage) |
Three-GT block | rmlBCAD |
|---|---|---|---|---|---|---|---|
| Leclercia sp. G3L | C | CP088265.1 | 537470 to 568288 | 97.06 (100) | 86.19 (96) | No | Yes |
| L. adecarboxylata strain L21 | P | MN423365.1 | 7593 to 31994 | 97.99 (100) | 98.83 (92) | Yes | Yes |
| Enterobacter hormaechei strain RHBSTW-00040 | P | CP058177.1 | 9006 to 37888 | 93.03 (99) | 96.78 (96) | Yes | Yes |
| L. adecarboxylata strain kcgeb_e1 | C | CP098325.1 | 592378 to 569918 | 90.97 (100) | 88.00 (96) | Yes | Yes |
| L. adecarboxylata strain 707804 | C | CP049980.1 | 186361 to 160033 | 89.46 (100) | 86.77 (96) | Yes | Yes |
| E. hormaechei strain RHBSTW-00059 | P | CP058169.1 | 5165 to 30059 | 89.15 (100) | 97.96 (96) | Yes | Yes |
| E. asburiae strain CAV1043 | P | CP011590.1 | 83480 to 9327 | 88.07 (99) | 97.99 (96) | Yes | Yes |
| Leclercia sp. LSNIH1 | C | CP026387.1 | 1804966 to 1830886 | 85.34 (99) | 86.72 (96) | Yes | Yes |
| Leclercia sp. W17 | C | CP031101.1 | 4199260 to 4215744 | 85.45 (100) | 95.85 (96) | No | No |
| Citrobacter freundii complex sp. CFNIH4 | C | CP026231.1 | 3594205 to 3618799 | 85.48 (98) | 85.55 (96) | Yes | Yes |
| L. adecarboxylata strain Z96-1 | C | CP040889.1 | 2715785 to 2688935 | 85.03 (100) | 88.98 (96) | Yes | Yes |
| L. adecarboxylata strain SH19PE29 | C | CP087280.1 | 576686 to 554506 | 85.2 (98) | 86.90 (96) | Yes | Yes |
| E. roggenkampii strain RHBSTW-00002 | P | CP058198.1 | 5165 to 34689 | 99.73 (100) | 97.99 (96) | Yes | Yes |
Only those with nucleotide identity ≥ 85% to the E. coli group 3 K11 sequence were listed.
NT.ID, nucleotide identity; P, plasmid; C, chromosome.
FIG 6.

Phylogenetic trees constructed with region 1 and region 3 sequences from E. coli subgroup 3B kps clusters and 3B-like clusters present in other Enterobacteriaceae species. (A) Region 1 phylogenetic tree. (B) Region 3 phylogenetic tree. Regions 1 and 3 from K10 (subgroup 3A) were used as the out-group in A and B, respectively. Neighbor-joining trees were constructed with Geneious Tree Builder using ClustalW alignments of the nucleotide sequences of regions 1 and 3 from group 3 kps clusters and 3B-like clusters of other Enterobacteriaceae species with a bootstrap value of 10,000 (inbuilt into Geneious 8.1.9, https://www.geneious.com). Each major clade in panel A tree (region 1) was color-coded, and sequences within these clades were assigned the same color in panel B tree (region 3) to illustrate that the two regions likely have separate origins.
Clusters TBA_9 and TBA_10 formed a separate branch shared in both trees (Fig. 6). However, while their region 1 sequences grouped with Leclercia sp. W17 (CP031101.1) (Fig. 6A), region 3 sequences were divergent from W17, and constitute members in two distinctive major clades (Fig. 6B). A similar pattern was observed with K11 in that its region 1 and region 3 sequences were grouped separately between the two phylogenetic trees (Fig. 6). Overall, the incongruent trees suggest that regions 1 and 3 in subgroup 3B kps clusters have evolved from multiple ancestries or that each region was separately acquired by two independent horizontal gene transfers. We propose that the subgroup 3B clusters likely evolved through independent recombination events across different Enterobacteriaceae species before entering E. coli by plasmid-mediated transfers, and TBA_3 demonstrates how this could be captured into the typical chromosomal kps locus for stable vertical transfer.
Variations in group 3 kps clusters within dominant E. coli clonal lineages.
To examine the distribution of group 3 kps clusters across different E. coli lineages, the 47 E. coli genomes found to encode a group 3 kps cluster at the serA locus were typed according to the Max Planck Institute Scheme (40) (Table S2) and allocated into 12 sequence types (STs). The lineage with the highest frequency of group 3 kps clusters was the uropathogenic ST69 lineage (13/47 genomes; Fig. 7A). Of those, the majority encoded a K54/K96 cluster (53.8%), followed by K10 (23.1%) (Fig. 7B). Clusters TBA_2, TBA_3, and TBA_4 were also found in single ST69 isolates, demonstrating diversity in kps types in this dominant E. coli lineage (Fig. 7B). Two additional STs represented by more than five genomes (ST405 and ST1312) also harbored more than one group 3 kps types, with TBA_5 and K54/K96 being the major kps types, respectively (Fig. 7B). Overall, group 3 kps clusters are not confined to a specific clonal lineage, as the presence of two to four distinct group 3 clusters was observed in more than one ST.
FIG 7.
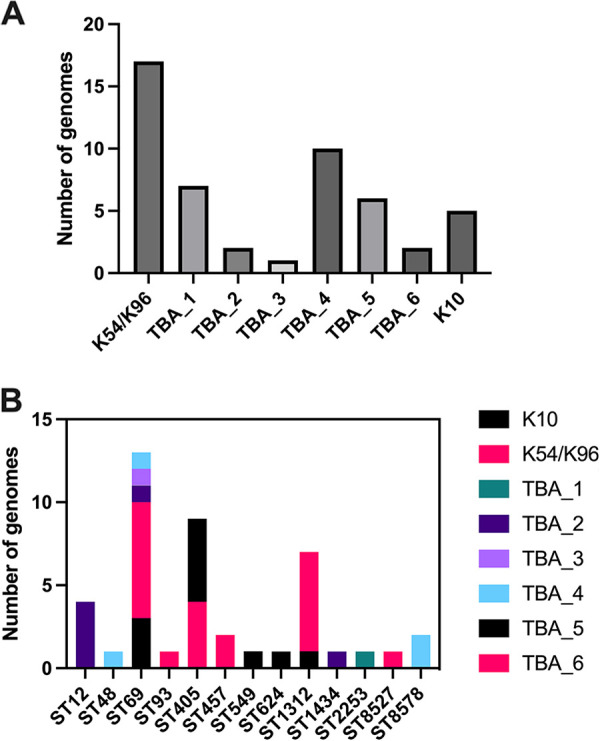
Frequency of chromosomal group 3 kps gene clusters in different E. coli sequence types. (A) Histogram of kps types across 47 E. coli genomes encoding a group 3 capsule. (B) Clonal lineage variations in kps types: Histogram of kps types per E. coli sequence type from 47 genomes encoding a group 3 capsule.
DISCUSSION
The current estimate of 80 capsule forms in E. coli is commonly believed to be close to final (25, 26). However, we previously identified surplus gene clusters that could not be accommodated by the known group 3 capsule scheme (23). This led us to speculate the possibility of unexpected diversity among group 3 kps gene clusters in E. coli, and we confirmed this is the case here. Group 3 clusters are surprisingly diverse. Aside from the K10, K11, and K54/K96 that we could associate with the original scheme, we identified 10 TBA kps gene clusters evenly allocated to the two divergent subgroups. It appears that wide group 3 kps diversity is circulating in the species, but this has gone undetected as the K typing scheme has been long abandoned. A gross underestimation of diversity may also be true for other capsule groups in E. coli.
The kps locus position of group 3 capsules in E. coli was first reported for K10 and K54 through Southern Blot analysis, before its division from Group 2 (41–43). Subsequent works validated shared locus position in several other group 2 encoding strains before this localization was adopted as common knowledge for both groups (1, 44). Although this holds true for all seven 3A kps clusters (proximal to the chromosomal serA gene), we have shown that all 3B kps clusters (except TBA_3) are located on plasmids (Fig. 3). Notably, while we could identify 3B-like gene clusters in other members within Enterobacteriaceae, no closely related clusters were identified for 3A. For one, this finding highlights the possibility that 3A clusters have been evolving in the species for a very long time, while 3B clusters are a relatively recent acquisition in E. coli. Overall, these results provide further support that 3A and 3B subgroups had diverged a long time ago (Fig. 1C) (23).
The primary driver for structural heterogeneity of capsular polysaccharides in group 2 and 3 capsules is the variations within their central region 2. However, there is very little indication of how such variation is generated, with typically the relatively conserved regions 1 and 3 thought to constitute the primary recombination arms to introduce altered polysaccharide forms. We find that region 2 in several of the existing E. coli group 3 kps forms were strikingly similar, and there is substantial genetic evidence that these gene clusters have diverged through recent recombination events (Fig. 2, 4, and 5). One particular highlight is the wsaE GT gene in TBA_5 (shared gene by most subgroup 3A). In the TBA_6 cluster, the original wsaE gene was interrupted by an InsA10 transpose, and the new annotation predicted it as a carnitine oxidoreductase gene (Fig. 2A). There is a sharp break from no identity to high identity at the junction into the carnitine oxidoreductase gene. It is worth mentioning that these observed sequences may be very different from the original recombination product, as there would be changes driven by selection to refine the function of the disrupted wsaE gene. It is interesting that for the Wzx/Wzy pathway, cases in which only subtle differences exist between polysaccharide gene clusters are relatively rare, given that the evolution of a new form in this pathway required the acquisition of a Wzx and Wzy that could adapt to prevent cell lysis (19, 21). We are unaware of any restrictions to the evolution of surface polysaccharide forms produced by the ABC transporter pathway; as such, perhaps the trade-off is little, and very intricate changes are sufficient to evolve novel polysaccharide forms.
Regions 1 and 3 for 3B kps clusters are particularly interesting because we could allocate them to different recent ancestries shared by other members of Enterobacteriaceae (Fig. 6). In short, our analysis provides clear evidence that kps clusters are recombination hot spots. Several possible paths can introduce variations in the serotype-specific region 2, shedding some light on the evolutionary trajectory of capsular biosynthesis. First, new kps forms may be formed by recombination events between shared genes within region 2. Second, it is also possible that an entire block of region 2 may be captured into existing kps clusters outside of the species based on sequence conservation of flanking regions 1 and 3. Recombinant products may also be subjected to further divergence through random genetic drift or selection pressure to introduce antigenic variation required to override existing host immunity or receptor interactions under phage predation. It is unexpected that some kps gene clusters can result from reassortments of supposedly conserved regions 1 and 3 sourced from different origins and, in this process, presumably acquire novel region 2 genes. In this respect, the diversification process of group 3 could harvest on the existing capsular complexities in related species.
Irrespective of what may be driving kps diversification, the finding of rigorous changes in capsular polysaccharides in E. coli, including in pathogenic clinical isolates that carry MDR genes (Tables S2 to S4), has important health implications. E. coli is the leading cause of mortality associated with antimicrobial resistance, accounting for over 800,000 lives globally in 2019 alone (45). Several recent studies have proposed phage therapy as a potential alternative to antibiotics against MDR E. coli infections (46). However, it is well-established that intricate surface encapsulation changes can affect phage binding to initiate an attack (10–14, 47, 48). In light of this, our discovery of an unexpected expansion of capsular diversity highlights the importance of reinstating the K-antigen typing scheme. This work also raises attention to the need to track capsular changes during and after administration of phage therapies to ensure their sustained safety and efficacy as standalone infection control regimes or as antibiotic adjuvants.
MATERIALS AND METHODS
Detection of novel group 3 kps gene clusters.
Known sequences of conserved region 1 (kpsDMTE) and region 3 (kpsCS) from K10 (Accession No.: MK278915) of subgroup 3A and K11 (Accession No.: MG736913) of subgroup 3B clusters were used to identify putative new group 3 clusters in published sequences with BLAST (49) and parameters restrictive to those of E. coli, using a cut-off 82% identity (>99% coverage). Manual curations were used to exclude sequences resembling each other (>98% identity across region 2). Briefly, the sequences were compared and analyzed with progressiveMauve for regions shared between gene clusters to yield seven new gene clusters (50). This work assigned a temporary to-be-assigned (TBA) nomenclature from Hong et al. (23) to these new gene clusters.
kps sequence analysis.
Genes, gene products, and regions with shared homologies identified from progressiveMauve (50) were further examined by built-in programs from the Geneious software package (Geneious 8.1.9). ClustalW Alignments were performed at default settings (cost matrix: IUB; Gap penalty: 15; Gap extend cost: 6.66) with a free end gaps (51). Recombination analysis was performed by assessment of sequences with shared homologies in regions of 100 bp in either ClustalW pairwise or multiple sequence alignments. The substitutional distributions between compared sequences were calculated to percentage values and plotted to determine SNP densities.
Phylogenetic analysis.
The multiple sequence alignments of shared regions 1 and 3 in related subgroup 3B kps clusters and 3B-like clusters from other Enterobacteriaceae species were processed and separated using ClustalW performed at default settings (cost matrix: IUB; Gap penalty: 15; Gap extend cost: 6.66) with free end gaps (inbuilt into Geneious 8.1.9) (51). The alignments were then concatenated to generate the neighbor-joining phylogenetic tree using Geneious Tree Builder with a bootstrap value of 10,000 (inbuilt into Geneious 8.1.9).
Multilocus sequence typing.
Fifty E. coli genomes were identified to encode a group 3 kps cluster mapped to the serA locus. The FASTA files of the GenBank sequences were downloaded, and MLST was performed according to the Max Planck Scheme with MLST 2.0 (40, 52). Forty-seven genomes (of the 50 genomes) were allocated into 12 STs, while three were disqualified due to imperfect hits (see Table S2 for detail). These data were combined with the known chromosomal group 3 capsular gene clusters to determine variations in capsular polysaccharides within a given clonal lineage (see Table S2 for accessions and relevant details of the isolates).
Search for antimicrobial resistance genes.
The identification of antimicrobial resistance genes was conducted with ResFinder 4.1 (2022-08-08 database) (53–58).
Visual presentation.
Visual comparisons of plasmid sequences were performed using BLAST Ring Image Generator (59), Artemis ACT (60) and Geneious 8.1.9.
Supplementary Material
ACKNOWLEDGMENTS
Y.H., J.Q., and M.T. were supported by the Australian Research Council (DP190101613), the National Health and Medical Research Council of Australia (GNT1144046), and the Clive and Vera Ramaciotti Foundation (Health Investment Grant 2017HIG0119). Y.H. and M.T. are also supported by funds from the Max Planck Queensland Centre at the Queensland University of Technology (QUT). Y.H. gratefully acknowledges support from the Faculty of Health Early Career Researcher Schemes of QUT. X.B.F. is a recipient of an QUT Amplify Scholarship. All funders had no role in study design, data collection and analysis, decision to publish, or preparation of the manuscript.
Y.H. contributed to conceptualization and design, data collection, data analysis and interpretation, and data presentation and supervision; M.T. supervised the study, contributed to data interpretation, and obtained the funding; J.Q. and X.B.F. contributed to data analysis; Y.H. drafted the manuscript; Y.H. and M.T. substantially revised the manuscript. All authors agreed to the publication of the manuscript.
We declare no competing interests.
Footnotes
Supplemental material is available online only.
Contributor Information
Yaoqin Hong, Email: yaoqin.hong@qut.edu.au.
Makrina Totsika, Email: makrina.totsika@qut.edu.au.
Xiaoyu Tang, Shenzhen Bay Laboratory.
REFERENCES
- 1.Sande C, Whitfield C. 2021. Capsules and extracellular polysaccharides in Escherichia coli and Salmonella. EcoSal Plus 9:eESP-0033-2020. doi: 10.1128/ecosalplus.ESP-0033-2020. [DOI] [PMC free article] [PubMed] [Google Scholar]
- 2.Kunduru BR, Nair SA, Rathinavelan T. 2016. EK3D: an E. coli K antigen 3-dimensional structure database. Nucleic Acids Res 44:D675–81. doi: 10.1093/nar/gkv1313. [DOI] [PMC free article] [PubMed] [Google Scholar]
- 3.Sarkar S, Ulett GC, Totsika M, Phan M-D, Schembri MA. 2014. Role of capsule and O antigen in the virulence of uropathogenic Escherichia coli. PLoS One 9:e94786. doi: 10.1371/journal.pone.0094786. [DOI] [PMC free article] [PubMed] [Google Scholar]
- 4.Thomassin J-L, Lee MJ, Brannon JR, Sheppard DC, Gruenheid S, Le Moual H. 2013. Both group 4 capsule and lipopolysaccharide O-antigen contribute to enteropathogenic Escherichia coli resistance to human α-defensin 5. PLoS One 8:e82475. doi: 10.1371/journal.pone.0082475. [DOI] [PMC free article] [PubMed] [Google Scholar]
- 5.Schembri MA, Dalsgaard D, Klemm P. 2004. Capsule shields the function of short bacterial adhesins. J Bacteriol 186:1249–1257. doi: 10.1128/JB.186.5.1249-1257.2004. [DOI] [PMC free article] [PubMed] [Google Scholar]
- 6.Stone E, Campbell K, Grant I, McAuliffe O. 2019. Understanding and exploiting phage-host interactions. Viruses 11:567. doi: 10.3390/v11060567. [DOI] [PMC free article] [PubMed] [Google Scholar]
- 7.Jann K, Jann B. 1992. Capsules of Escherichia coli, expression and biological significance. Can J Microbiol 38:705–710. doi: 10.1139/m92-116. [DOI] [PubMed] [Google Scholar]
- 8.Stevens P, Huang SN, Welch WD, Young LS. 1978. Restricted complement activation by Escherichia coli with the K-1 capsular serotype: a possible role in pathogenicity. J Immunol 121:2174–2180. doi: 10.4049/jimmunol.121.6.2174. [DOI] [PubMed] [Google Scholar]
- 9.Cross AS. 1990. The biologic significance of bacterial encapsulation. Curr Top Microbiol Immunol 150:87–95. doi: 10.1007/978-3-642-74694-9_5. [DOI] [PubMed] [Google Scholar]
- 10.Seed KD. 2015. Battling Phages: How Bacteria Defend against Viral Attack. PLoS Pathog 11:e1004847–e1004847. doi: 10.1371/journal.ppat.1004847. [DOI] [PMC free article] [PubMed] [Google Scholar]
- 11.Soundararajan M, von Bünau R, Oelschlaeger TA. 2019. K5 capsule and lipopolysaccharide are important in resistance to T4 phage attack in probiotic E. coli strain Nissle 1917. Front Microbiol 10:2783. doi: 10.3389/fmicb.2019.02783. [DOI] [PMC free article] [PubMed] [Google Scholar]
- 12.Scholl D, Adhya S, Merril C. 2005. Escherichia coli K1's capsule is a barrier to bacteriophage T7. Appl Environ Microbiol 71:4872–4874. doi: 10.1128/AEM.71.8.4872-4874.2005. [DOI] [PMC free article] [PubMed] [Google Scholar]
- 13.Lin H, Paff ML, Molineux IJ, Bull JJ. 2017. Therapeutic application of phage capsule depolymerases against K1, K5, and K30 capsulated E. coli in mice. Front Microbiol 8. doi: 10.3389/fmicb.2017.02257. [DOI] [PMC free article] [PubMed] [Google Scholar]
- 14.de Sousa JAM, Buffet A, Haudiquet M, Rocha EPC, Rendueles O. 2020. Modular prophage interactions driven by capsule serotype select for capsule loss under phage predation. ISME J 14:2980–2996. doi: 10.1038/s41396-020-0726-z. [DOI] [PMC free article] [PubMed] [Google Scholar]
- 15.Greenfield LK, Whitfield C. 2012. Synthesis of lipopolysaccharide O-antigens by ABC transporter-dependent pathways. Carbohydr Res 356:12–24. doi: 10.1016/j.carres.2012.02.027. [DOI] [PubMed] [Google Scholar]
- 16.Reeves PR, Cunneen MM. 2010. Biosynthesis of O-antigen chains and assembly, p 319–335. In Holst O, Brennan PJ, Itzstein Mv, Moran AP (ed), Microbial Glycobiology. Academic Press, San Diego, CA. doi: 10.1016/B978-0-12-374546-0.00018-3. [DOI] [Google Scholar]
- 17.Whitfield C, Williams DM, Kelly SD. 2020. Lipopolysaccharide O-antigens-bacterial glycans made to measure. J Biol Chem 295:10593–10609. doi: 10.1074/jbc.REV120.009402. [DOI] [PMC free article] [PubMed] [Google Scholar]
- 18.Islam ST, Lam JS. 2014. Synthesis of bacterial polysaccharides via the Wzx/Wzy-dependent pathway. Can J Microbiol 60:697–716. doi: 10.1139/cjm-2014-0595. [DOI] [PubMed] [Google Scholar]
- 19.Hong Y, Liu MA, Reeves PR. 2018. Progress in our understanding of Wzx flippase for translocation of bacterial membrane lipid-linked oligosaccharide. J Bacteriol 200. doi: 10.1128/JB.00154-17. [DOI] [PMC free article] [PubMed] [Google Scholar]
- 20.Kalynych S, Morona R, Cygler M. 2014. Progress in understanding the assembly process of bacterial O-antigen. FEMS Microbiol Rev 38:1048–1065. doi: 10.1111/1574-6976.12070. [DOI] [PubMed] [Google Scholar]
- 21.Hong Y, Hu D, Verderosa AD, Qin J, Totsika M, Reeves PR. 2023. Repeat-unit elongations to produce bacterial complex long polysaccharide chains, an O-antigen perspective. EcoSal Plus doi: 10.1128/ecosalplus.esp-0020-2022. [DOI] [PMC free article] [PubMed] [Google Scholar]
- 22.Willis LM, Whitfield C. 2013. KpsC and KpsS are retaining 3-deoxy-D-manno-oct-2-ulosonic acid (Kdo) transferases involved in synthesis of bacterial capsules. Proc Natl Acad Sci USA 110:20753–20758. doi: 10.1073/pnas.1312637110. [DOI] [PMC free article] [PubMed] [Google Scholar]
- 23.Hong Y, Cunneen MM, Reeves PR. 2019. Two extremely divergent sequence forms of the genes that define Escherichia coli group 3 capsules suggest a very long history since their common ancestor. FEMS Microbiol Lett 366. doi: 10.1093/femsle/fnz091. [DOI] [PubMed] [Google Scholar]
- 24.Follador R, Heinz E, Wyres KL, Ellington MJ, Kowarik M, Holt KE, Thomson NR. 2016. The diversity of Klebsiella pneumoniae surface polysaccharides. Microb Genom 2. doi: 10.1099/mgen.0.000073. [DOI] [PMC free article] [PubMed] [Google Scholar]
- 25.Jann B, Jann K. 1997. Capsules of Escherichia coli, p 113–143. In Sussman M (ed), Escherichia coli: Mechanisms of virulence. Cambridge University Press, Cambridge, UK. [Google Scholar]
- 26.Jann B, Jann K. 1990. Structure and biosynthesis of the capsular antigens of Escherichia coli. Curr Top Microbiol Immunol 150:19–42. doi: 10.1007/978-3-642-74694-9_2. [DOI] [PubMed] [Google Scholar]
- 27.Whitfield C. 2009. Structure and assembly of Escherichia coli capsules. EcoSal Plus 3. doi: 10.1128/ecosalplus.4.7.3. [DOI] [PubMed] [Google Scholar]
- 28.Nanayakkara BS, O'Brien CL, Gordon DM. 2019. Diversity and distribution of Klebsiella capsules in Escherichia coli. Environ Microbiol Rep 11:107–117. doi: 10.1111/1758-2229.12710. [DOI] [PubMed] [Google Scholar]
- 29.Sieberth V, Jann B, Jann K. 1993. Structure of the K10 capsular antigen from Escherichia coli O11:K10:H10, a polysaccharide containing 4,6-dideoxy-4-malonylamino-D-glucose. Carbohydr Res 246:219–228. doi: 10.1016/0008-6215(93)84034-4. [DOI] [PubMed] [Google Scholar]
- 30.Jann B, Kochanowski H, Jann K. 1994. Structure of the capsular K96 polysaccharide (K96 antigen) from Escherichia coli O77: K96: H− and comparison with the capsular K54 polysaccharide (K54 antigen) from Escherichia coli O6: K54: H10. Carbohydr Res 253:323–327. doi: 10.1016/0008-6215(94)80080-4. [DOI] [PubMed] [Google Scholar]
- 31.Hahne M, Jann B, Jann K. 1991. Structure of the capsular polysaccharide (K98 antigen) of E. coli O7: K98: H6. Carbohydr Res 222:245–253. doi: 10.1016/0008-6215(91)89023-9. [DOI] [PubMed] [Google Scholar]
- 32.Dengler T, Himmelspach K, Jann B, Jann K. 1988. Structure of the capsular K3 antigen of Escherichia coli 04: K3: H4, a polysaccharide containing a 4-deoxy-2-hexulosonic acid. Carbohydr Res 178:191–201. doi: 10.1016/0008-6215(88)80111-3. [DOI] [PubMed] [Google Scholar]
- 33.Rodriguez M-L, Jann B, Jann K. 1990. Structure and serological properties of the capsular K11 antigen of Escherichia coli O13: K11: H11. Carbohydr Res 196:101–109. doi: 10.1016/0008-6215(90)84109-8. [DOI] [PubMed] [Google Scholar]
- 34.Yang S, Xi D, Jing F, Kong D, Wu J, Feng L, Cao B, Wang L. 2018. Genetic diversity of K-antigen gene clusters of Escherichia coli and their molecular typing using a suspension array. Can J Microbio doi: 10.1139/cjm-2017-0620. [DOI] [PubMed] [Google Scholar]
- 35.Minin VN, Dorman KS, Fang F, Suchard MA. 2005. Dual multiple change-point model leads to more accurate recombination detection. Bioinformatics 21:3034–3042. doi: 10.1093/bioinformatics/bti459. [DOI] [PubMed] [Google Scholar]
- 36.Li Q, Hobbs M, Reeves PR. 2003. The variation of dTDP-L-rhamnose pathway genes in Vibrio cholerae. Microbiology (Reading) 149:2463–2474. doi: 10.1099/mic.0.26382-0. [DOI] [PubMed] [Google Scholar]
- 37.Li Q, Reeves PR. 2000. Genetic variation of dTDP-L-rhamnose pathway genes in Salmonella enterica. Microbiology (Reading) 146:2291–2307. doi: 10.1099/00221287-146-9-2291. [DOI] [PubMed] [Google Scholar]
- 38.Reeves PR, Cunneen MM, Liu B, Wang L. 2013. Genetics and evolution of the Salmonella galactose-initiated set of O antigens. PLoS One 8:e69306. doi: 10.1371/journal.pone.0069306. [DOI] [PMC free article] [PubMed] [Google Scholar]
- 39.Navarre WW, Porwollik S, Wang Y, McClelland M, Rosen H, Libby SJ, Fang FC. 2006. Selective silencing of foreign DNA with low GC content by the H-NS protein in Salmonella. Science 313:236–238. doi: 10.1126/science.1128794. [DOI] [PubMed] [Google Scholar]
- 40.Wirth T, Falush D, Lan R, Colles F, Mensa P, Wieler LH, Karch H, Reeves PR, Maiden MCJ, Ochman H, Achtman M. 2006. Sex and virulence in Escherichia coli: an evolutionary perspective. Mol Microbiol 60:1136–1151. doi: 10.1111/j.1365-2958.2006.05172.x. [DOI] [PMC free article] [PubMed] [Google Scholar]
- 41.Orskov I, Nyman K. 1974. Genetic mapping of the antigenic determinants of two polysaccharide K antigens, K10 and K54, in Escherichia coli. J Bacteriol 120:43–51. doi: 10.1128/jb.120.1.43-51.1974. [DOI] [PMC free article] [PubMed] [Google Scholar]
- 42.Pearce R, Roberts IS. 1995. Cloning and analysis of gene clusters for production of the Escherichia coli K10 and K54 antigens: identification of a new group of serA-linked capsule gene clusters. J Bacteriol 177:3992–3997. doi: 10.1128/jb.177.14.3992-3997.1995. [DOI] [PMC free article] [PubMed] [Google Scholar]
- 43.Whitfield C, Roberts IS. 1999. Structure, assembly and regulation of expression of capsules in Escherichia coli. Mol Microbiol 31:1307–1319. doi: 10.1046/j.1365-2958.1999.01276.x. [DOI] [PubMed] [Google Scholar]
- 44.Drake CR, Boulnois GJ, Roberts IS. 1993. The Escherichia coli serA-linked capsule locus and its flanking sequences are polymorphic, genetic evidence for the existence of more than two groups of capsule gene clusters. J Gen Microbiol 139:1707–1714. doi: 10.1099/00221287-139-8-1707. [DOI] [PubMed] [Google Scholar]
- 45.Murray CJL, Ikuta KS, Sharara F, Swetschinski L, Robles Aguilar G, Gray A, Han C, Bisignano C, Rao P, Wool E, Johnson SC, Browne AJ, Chipeta MG, Fell F, Hackett S, Haines-Woodhouse G, Kashef Hamadani BH, Kumaran EAP, McManigal B, Achalapong S, Agarwal R, Akech S, Albertson S, Amuasi J, Andrews J, Aravkin A, Ashley E, Babin F-X, Bailey F, Baker S, Basnyat B, Bekker A, Bender R, Berkley JA, Bethou A, Bielicki J, Boonkasidecha S, Bukosia J, Carvalheiro C, Castañeda-Orjuela C, Chansamouth V, Chaurasia S, Chiurchiù S, Chowdhury F, Clotaire Donatien R, Cook AJ, Cooper B, Cressey TR, Criollo-Mora E, Cunningham M, et al. 2022. Global burden of bacterial antimicrobial resistance in 2019: a systematic analysis. Lancet 399:629–655. doi: 10.1016/S0140-6736(21)02724-0. [DOI] [PMC free article] [PubMed] [Google Scholar]
- 46.Gómez-Ochoa SA, Pitton M, Valente LG, Sosa Vesga CD, Largo J, Quiroga-Centeno AC, Hernández Vargas JA, Trujillo-Cáceres SJ, Muka T, Cameron DR, Que Y-A. 2022. Efficacy of phage therapy in preclinical models of bacterial infection: a systematic review and meta-analysis. Lancet Microbe 3:e956–e968. doi: 10.1016/S2666-5247(22)00288-9. [DOI] [PubMed] [Google Scholar]
- 47.Holt KE, Lassalle F, Wyres KL, Wick R, Mostowy RJ. 2020. Diversity and evolution of surface polysaccharide synthesis loci in Enterobacteriales. ISME J 14:1713–1730. doi: 10.1038/s41396-020-0628-0. [DOI] [PMC free article] [PubMed] [Google Scholar]
- 48.Venturini C, Petrovic Fabijan A, Fajardo Lubian A, Barbirz S, Iredell J. 2022. Biological foundations of successful bacteriophage therapy. EMBO Mol Med 14:e12435. doi: 10.15252/emmm.202012435. [DOI] [PMC free article] [PubMed] [Google Scholar]
- 49.Altschul SF, Gish W, Miller W, Myers EW, Lipman DJ. 1990. Basic local alignment search tool. J Mol Biol 215:403–410. doi: 10.1016/S0022-2836(05)80360-2. [DOI] [PubMed] [Google Scholar]
- 50.Darling AE, Mau B, Perna NT. 2010. progressiveMauve: multiple genome alignment with gene gain, loss and rearrangement. PLoS One 5:e11147. doi: 10.1371/journal.pone.0011147. [DOI] [PMC free article] [PubMed] [Google Scholar]
- 51.Chenna R, Sugawara H, Koike T, Lopez R, Gibson TJ, Higgins DG, Thompson JD. 2003. Multiple sequence alignment with the Clustal series of programs. Nucleic Acids Res 31:3497–3500. doi: 10.1093/nar/gkg500. [DOI] [PMC free article] [PubMed] [Google Scholar]
- 52.Larsen MV, Cosentino S, Rasmussen S, Friis C, Hasman H, Marvig RL, Jelsbak L, Sicheritz-Pontén T, Ussery DW, Aarestrup FM, Lund O. 2012. Multilocus sequence typing of total-genome-sequenced bacteria. J Clin Microbiol 50:1355–1361. doi: 10.1128/JCM.06094-11. [DOI] [PMC free article] [PubMed] [Google Scholar]
- 53.Malberg Tetzschner AM, Johnson JR, Johnston BD, Lund O, Scheutz F. 2020. In silico genotyping of Escherichia coli isolates for extraintestinal virulence genes by use of whole-genome sequencing data. J Clin Microbiol 58. doi: 10.1128/JCM.01269-20. [DOI] [PMC free article] [PubMed] [Google Scholar]
- 54.Clausen P, Aarestrup FM, Lund O. 2018. Rapid and precise alignment of raw reads against redundant databases with KMA. BMC Bioinformatics 19:307. doi: 10.1186/s12859-018-2336-6. [DOI] [PMC free article] [PubMed] [Google Scholar]
- 55.Bortolaia V, Kaas RS, Ruppe E, Roberts MC, Schwarz S, Cattoir V, Philippon A, Allesoe RL, Rebelo AR, Florensa AF, Fagelhauer L, Chakraborty T, Neumann B, Werner G, Bender JK, Stingl K, Nguyen M, Coppens J, Xavier BB, Malhotra-Kumar S, Westh H, Pinholt M, Anjum MF, Duggett NA, Kempf I, Nykäsenoja S, Olkkola S, Wieczorek K, Amaro A, Clemente L, Mossong J, Losch S, Ragimbeau C, Lund O, Aarestrup FM. 2020. ResFinder 4.0 for predictions of phenotypes from genotypes. J Antimicrob Chemother 75:3491–3500. doi: 10.1093/jac/dkaa345. [DOI] [PMC free article] [PubMed] [Google Scholar]
- 56.Zankari E, Allesøe R, Joensen KG, Cavaco LM, Lund O, Aarestrup FM. 2017. PointFinder: a novel web tool for WGS-based detection of antimicrobial resistance associated with chromosomal point mutations in bacterial pathogens. J Antimicrob Chemother 72:2764–2768. doi: 10.1093/jac/dkx217. [DOI] [PMC free article] [PubMed] [Google Scholar]
- 57.Camacho C, Coulouris G, Avagyan V, Ma N, Papadopoulos J, Bealer K, Madden TL. 2009. BLAST+: architecture and applications. BMC Bioinformatics 10:421. doi: 10.1186/1471-2105-10-421. [DOI] [PMC free article] [PubMed] [Google Scholar]
- 58.Joensen KG, Scheutz F, Lund O, Hasman H, Kaas RS, Nielsen EM, Aarestrup FM. 2014. Real-time whole-genome sequencing for routine typing, surveillance, and outbreak detection of verotoxigenic Escherichia coli. J Clin Microbiol 52:1501–1510. doi: 10.1128/JCM.03617-13. [DOI] [PMC free article] [PubMed] [Google Scholar]
- 59.Alikhan N-F, Petty NK, Ben Zakour NL, Beatson SA. 2011. BLAST Ring Image Generator (BRIG): simple prokaryote genome comparisons. BMC Genomics 12:402. doi: 10.1186/1471-2164-12-402. [DOI] [PMC free article] [PubMed] [Google Scholar]
- 60.Carver TJ, Rutherford KM, Berriman M, Rajandream M-A, Barrell BG, Parkhill J. 2005. ACT: the Artemis comparison tool. Bioinformatics 21:3422–3423. doi: 10.1093/bioinformatics/bti553. [DOI] [PubMed] [Google Scholar]
- 61.Bachmann BJ. 1990. Linkage map of Escherichia coli K-12, edition 8. Microbiol Rev 54:130–197. doi: 10.1128/mr.54.2.130-197.1990. [DOI] [PMC free article] [PubMed] [Google Scholar]
Associated Data
This section collects any data citations, data availability statements, or supplementary materials included in this article.
Supplementary Materials
Tables S1 to S4. Download spectrum.01432-23-s0001.xlsx, XLSX file, 0.02 MB (16.9KB, xlsx)