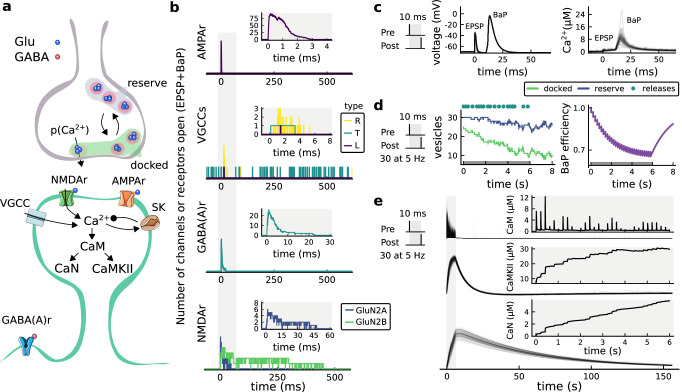
Figure 1. | The synapse model, its timescales and mechanisms.
(a), Model diagram with the synaptic components including pre and postsynaptic compartments and inhibitory transmission (bottom left). AMPAr, NMDAr: AMPA- and NMDA-type glutamate receptors respectively; GABA(A)r: Type A GABA receptors; VGCC: R-, T- and L-type voltage-gated Ca2+ channels; SK: SK potassium channels. (b), Stochastic dynamics of the different ligand-gated and voltage-gated ion channels in the model. Plots show the total number of open channels as a function of time. The insets show a zoomed time axis highlighting the difference in timescale of the activity among the channels. (c), Dendritic spine membrane potential (left) and calcium concentration (right) as function of time for a single causal (1Pre1Post10) stimulus (EPSP: single excitatory postsynaptic potential, ‘1Pre’; BaP: single back-propagated action potential, ‘1Post’). (d), Left: depletion of vesicle pools (reserve and docked) induced by 30 pairing repetitions delivered at 5 Hz (Sterratt et al., 2011), see Materials and methods. The same depletion rule is applied to both glutamate- and GABA-containing vesicles. Right: BaP efficiency as function of time. BaP efficiency phenomenologically captures the distance-dependent attenuation of BaP (Buchanan and Mellor, 2007; Golding et al., 2001), see Materials and methods. (e), Concentration of active enzyme for CaM, CaN, and CaMKII, as function of time triggered by 30 repetitions of 1Pre1Post10 pairing stimulations delivered at 5 Hz. The vertical grey bar is the duration of the stimuli, 6 s. The multiple traces in the graphs in panels c (right) and e reflect the run-to-run variability due to the inherent stochasticity in the model.

