. 2023 Aug 17;12:e80152. doi: 10.7554/eLife.80152

Figure 6. Effects of extracellular calcium and magnesium concentrations on plasticity.

(a), Synaptic weight (%) for a STDP rule with [Ca2+]o=1.3 mM (fixed ratio, Ca/Mg = 1.5). According to the data extracted from Inglebert et al., 2020, the number of pairing repetitions for causal/positive (anti-causal/negative) delays is 100 (150), both delivered at 0.3 Hz. The solid line is the mean, and the ribbons are the 2nd and 4th quantiles predicted by our model (all panels use 100 samples). (b), Same as a, but for [Ca2+]o = 1.8 mM (Ca/Mg ratio = 1.5). (c), Same as a, but for [Ca2+]o = 3 mM (Ca/Mg ratio = 1.5). (d), Mean time spent for causal pairing, 1Pre1Post10, at different Ca/Mg concentration ratios. The contour plots are associated with the panels a, b and c. e, Predicted effects of extracellular Ca/Mg on STDP outcome. Synaptic weight change (%) for causal (1Pre1Post10, 100 at 0.3 Hz) and anticausal (1Post1Pre10, 150 at 0.3 Hz) pairings varying extracellular Ca from 1.0 to 3 mM (Ca/Mg ratio = 1.5). The dashed lines represent the experiments in the panel a, b and c. We used 21x22 × 100 data points, respectively calcium x delay x samples. (f), Predicted effects of varying frequency and extracellular Ca/Mg for an STDP protocol. Contour plot showing the mean synaptic weight (%) for a single causal pairing protocol (1Pre1Post10, 100 samples) varying frequency from 0.1 to 10 Hz and [Ca2+]o from 1.0 to 3 mM (Ca/Mg ratio = 1.5). We used 21 x 18 × 100 data points, respectively calcium x frequency x samples.

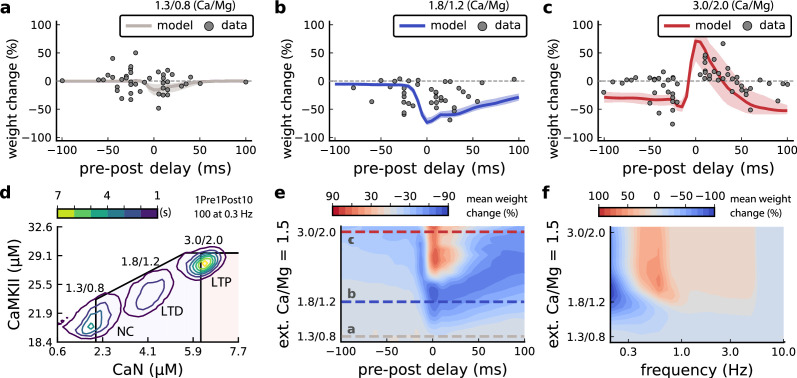
Figure 6.

Figure 6—figure supplement 1. [Ca2+]o and [Mg2+]o related modifications for Inglebert et al., 2020 experiment.

Figure 6—figure supplement 1.

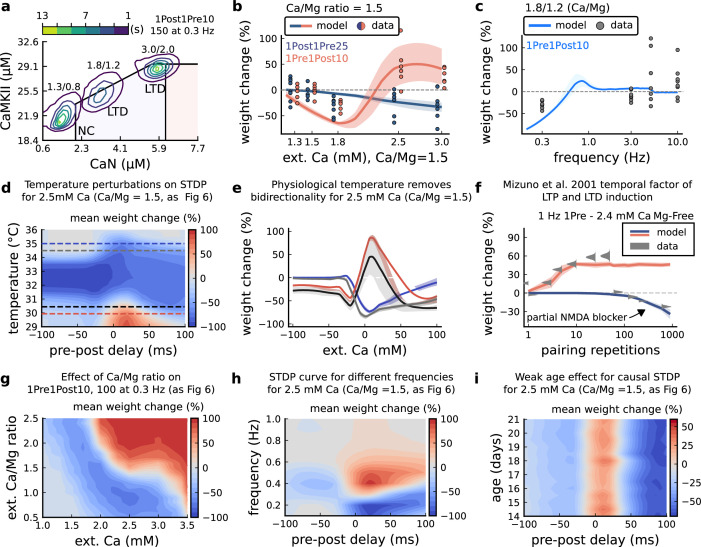
(a), Mean time spent for anticausal pairing, 1Post1Pre10, at different Ca/Mg concentrations. The contour plots are associated with the Figure 6a–c. (b), STDP and extracellular Ca/Mg. Synaptic weight change (%) for causal (1Pre1Post10, 100 at 0.3 Hz) and anticausal (1Post1Pre10, 150 at 0.3 Hz) pairings varying [Ca2+]o from 1.0 to 3 mM (Ca/Mg ratio = 1.5). (c), Varying frequency and extracellular Ca/Mg for the causal pairing 1Pre1Post10, 100 at 0.3 Hz. Synaptic weight change (%) for a single causal pairing protocol varying frequency from 0.1 to 10 Hz. [Ca2+]o was fixed at 1.8 mM (Ca/Mg ratio = 1.5). (d), Mean synaptic weight change (%) for Inglebert et al., 2020 STDP experiment showing how temperature qualitatively modifies plasticity. The dashed lines are ploted in panel b. (e), Mean synaptic weight change (%) showing the effects of 0.5°C change in panel d. Black and grey solid lines represent the same color dashed lines in panel d (30 and 30.5°C). The bidirectional curves, black and grey lines in panel d (dashed) and panel e (solid), becoming full-LTD when temperature increases to 34.5 and 35°C, respectively yellow and purple lines in panel d (dashed) and panel e (solid). Further increase abolishes plasticity. f, Mean synaptic weight change (%) for Mizuno et al., 2001 experiment in Mg-Free ([Mg2+]o = 10-3 mM for best fit) showing the different time requirements to induce LTP and LTD. For LTD, to simulate the NMDAr antagonist D-AP5 which causes a NMDAr partial blocking we reduced the NMDAr conductance by 97%. Note the similarity with Figure 3—figure supplement 4f. (g), Mean synaptic weight change (%) of Inglebert et al., 2020 STDP experiment changing [Ca2+]o and Ca/Mg ratio. (h), Mean synaptic weight change (%) of Inglebert et al., 2020 STDP experiment changing pre-post delay time and frequency. Note the similarity with Figure 3—figure supplement 4c. (i), Mean synaptic weight change (%) of Inglebert et al., 2020 STDP experiment changing pre-post delay time and age. Age has a weak effect on this experiment done at [Ca2+]o = 2.5 mM.
Figure 6—figure supplement 2. Temperature and age effects.

Figure 6—figure supplement 2.

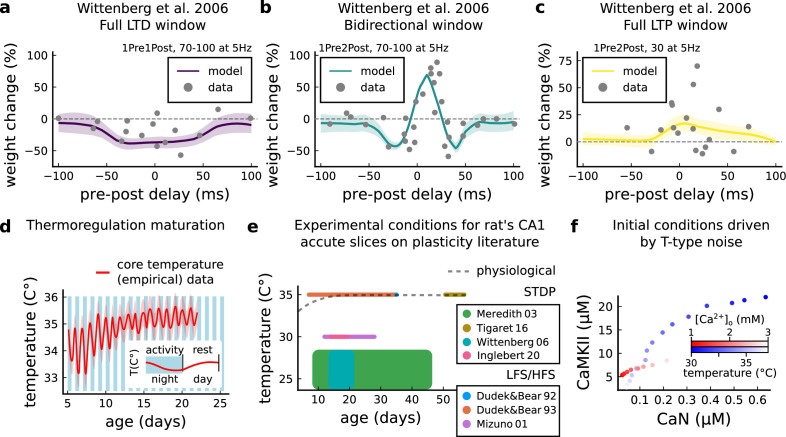
(a), Mean synaptic weight change (%) for Wittenberg and Wang, 2006 STDP experiment for 1Pre1Post10, 70–100 at 5 Hz (see Appendix 1—table 1) showing a full LTD window. Our model also reproduces the data showing that when temperature is increased to 32-34C LTD is abolished (data not shown). (b) Mean synaptic weight change (%) for Wittenberg and Wang, 2006 STDP experiment for 1Pre2Post10, 70–100 at 5 Hz (see Appendix 1—table 1) showing a bidirectional window. (c) Mean synaptic weight change (%) for Wittenberg and Wang, 2006 STDP experiment for 1Pre2Post10, 20–30 at 5 Hz (see Appendix 1—table 1) showing a bidirectional window. We noticed that for Wittenberg and Wang, 2006 experiment, done in room temperature, the temperature sensitivity was higher than for other experiments. (d) Core temperature varying with age representing the thermoregulation maturation. This function (not shown) was fitted using rat (Wood et al., 2016) and mouse data (McCauley et al., 2020) added by 1°C to compensate species differences (Wood et al., 2016). The blue and white bars represent the circadian rhythm as shown in McCauley et al., 2020. However, the ‘rest rhythm’ for young rats (P5-14) may vary. (e), Dotted grey line represents the averaged physiological temperature at different ages in the rat (estimated from mean value of panel d). For the papers the we fitted by the model, we depict the range of temperature and age used. Note that only few experiments were performed at near physiological conditions. (f) Initial conditions for CaN-CaMKII resting concentration for different [Ca2+]o and temperature values. When [Ca2+]o is changed, temperature is fixed at 35°C, while when temperature is changed, [Ca2+]o is fixed at 2 mM.