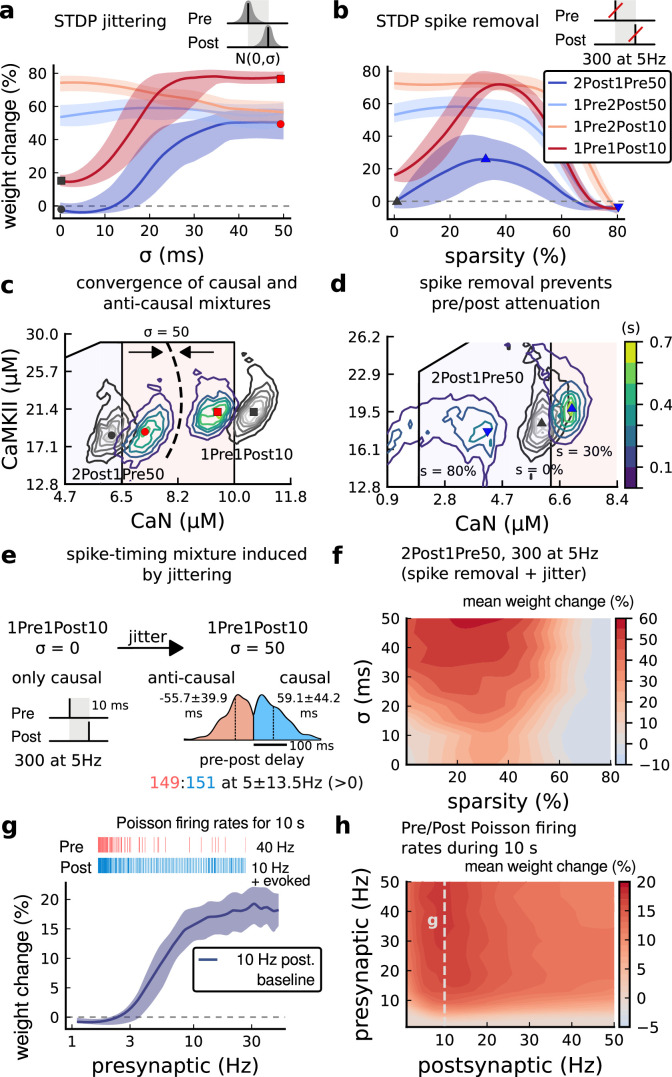
Figure 7. Jitter and spike dropping effects on STDP and Poisson spike trains.
(a) Mean weight (%) for the jittered STDP protocols (protocol color legend shown in b). The solid line is the mean, and the ribbons are the 2nd and 4th quantiles predicted by our model using 100 samples (same for panels a, b and g). (b) Mean weight (%) for the same (Tigaret et al., 2016) protocols used in panel a subjected to random spike removal (sparsity %). (c) Effect of jitttering on Mean time (s) spent by joint enzymes trajectories in LTP/LTD regions. Contour plot shows 2Post1Pre50 and 1Pre1Post10 (300 at 5 Hz) without (grey contour plot) and with jittering (coloured contour plot). The circles and squares correspond to the marks in panel a. (d) Effect of sparsity on Mean time (s) spent by joint enzymes trajectories in LTP/LTD regions. Contour plot in grey showing 0% sparsity for 2Post1Pre50 300 at 5 Hz (see Figure 2j). The contour plots show the protocol with spike removal sparsities at 0% (NC), 30% (LTP), and 80% (NC). The triangles correspond to the same marks in panel a. (e) Distribution of the 50 ms jittering applied to the causal protocol 1Pre1Post10, 300 at 5 Hz in which nearly half of the pairs turned into anticausal. The mean frequency is 5 ±13.5 Hz making it to have a similar firing structure and position in the LTP region. The similar occurs for 2Post1Pre50 (panel c). (f) Mean weight change (%) combining both jittering (panel a) and sparsity (panel b) for 2Post1Pre50, 300 at 5 Hz. (g) Mean weight change (%) of pre and postsynaptic Poisson spike train delivered simultaneously for 10 s. The plot shows the plasticity outcome for different presynaptic firing rate (1000/frequency) for a fixed postsynaptic baseline at 10 Hz. The upper raster plot depicts the released vesicles at 40 Hz and the postsynaptic baseline at 10 Hz (including the AP evoked by EPSP). (h) Mean weight change (%) varying the rate of pre and postsynaptic Poisson spike train delivered simultaneously for 10 s. The heat map data along the vertical white dashed line is depicted in panel g.

