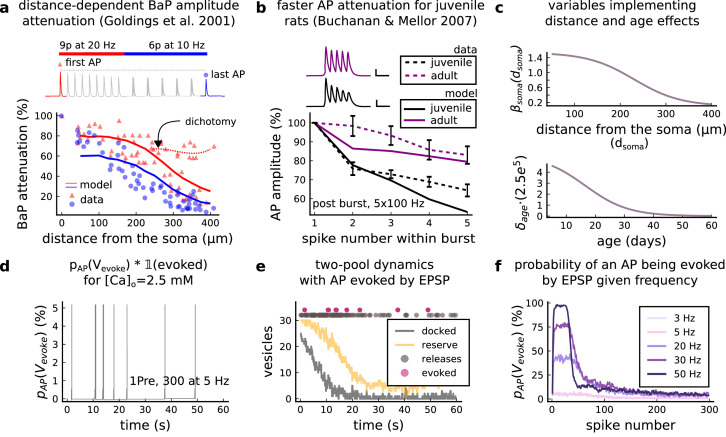
Figure 9. AP Evoked by EPSP.
(a) Model and data comparison for the distance-dependent BaP amplitude attenuation measured in the dendrite and varying the distance from the soma. The stimulation in panel a is set to reproduce the same stimulation as Golding et al., 2001. Golding described two classes of neurons: those that are strongly attenuated and those that are weakly attenuated (dichotomy mark represented by the dashed line). However, in this work we consider only strongly attenuated neurons. (b) Attenuation of somatic action potential from Buchanan and Mellor, 2007 and model in response to five postsynaptic spikes delivered at 100 Hz. The value showed for the model is the spine voltage with distance from the soma set to zero (scale 25 ms, 20 mV). (c) Top panel shows the used in Equation 6 to modify the axial conductance between the soma and dendrite. Bottom panel shows the age-dependent changes in the step of the resource-use equation (Equation 7) that accelerates the BaP attenuation and decreases the sodium currents in Equation 5. (d) Probability of evoking an AP multiplied by the successfully evoked AP, , for the protocol 1Pre, 300 at 5 Hz (2.5 mM Ca). (e) Two-pool dynamics with the same stimulation from panel D showing the vesicle release, the reserve and docked pools, and the evoked AP. (f) Probability of evoking an AP for the protocol 1Pre 300 pulses at different frequencies (3 and 5 Hz have the same probability).

