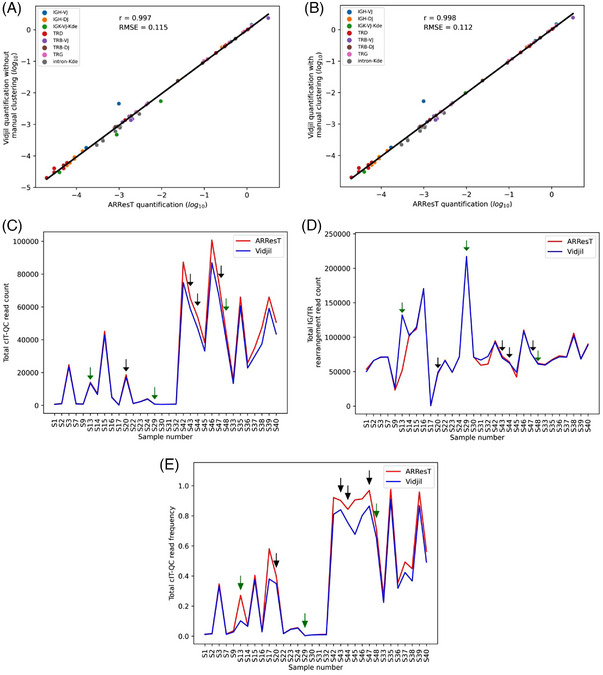
FIGURE 1.

EuroClonality versus ARResT/Interrogate: IG/TR marker quantification and cIT‐QC identification. Analysis of bone marrow NGS files from the original cIT‐QC publication [6]. Samples S1‐S32 correspond to diagnostic B/T‐ALL, while S33‐S48 to aplastic posttreatment. (A and B) Linear regression of the log10 cell frequency for IG/TR clonotypes calculated by ARResT/Interrogate and Vidjil. Pearson's correlation coefficient represented by r, and root‐mean‐square error by RMSE. Vidjil analysis without (A) and with manual clonotype clustering (B). (C, D, and E) ARResT/Interrogate and Vidjil comparison per sample of total cIT‐QC read count (C), total IG/TR rearrangement read count (D), and total cIT‐QC read frequency (total cIT‐QC reads/total V(D)J reads) (E). Green and black arrows indicate samples where a cIT‐QC sequence was missing in both software tools and only in Vidjil, respectively.
