

Abstract
Background:
There is a need for effective interventions to stave off cognitive decline in older adults. Cognitive training has variably produced gains in untrained tasks and daily functioning. Combining cognitive training with transcranial direct current stimulation (tDCS) may augment cognitive training effects; however, this approach has yet to be tested on a large-scale.
Objective/Hypothesis:
This paper will present the primary findings of the Augmenting Cognitive Training in Older Adults (ACT) clinical trial. We hypothesize that receiving active stimulation with cognitive training will result in greater improvements on an untrained fluid cognition composite compared to sham following intervention.
Methods:
379 older adults were randomized, and 334 were included in intent-to-treat analyses for a 12-week multidomain cognitive training and tDCS intervention. Active or sham tDCS was administered at F3/F4 during cognitive training daily for two weeks then weekly for 10 weeks. To assess the tDCS effect, we fitted regression models for changes in NIH Toolbox Fluid Cognition Composite scores immediately following intervention and one year from baseline controlling for covariates and baseline scores.
Results:
Across the entire sample, there were improvements in NIH Toolbox Fluid Cognition Composite scores immediately post-intervention and one year following baseline; however, there were no significant tDCS group effects at either timepoint.
Conclusions:
The ACT study models rigorous, safe administration of a combined tDCS and cognitive training intervention in a large sample of older adults. Despite potential evidence of near-transfer effects, we failed to demonstrate an additive benefit of active stimulation. Future analyses will continue to assess the intervention’s efficacy by examining additional measures of cognition, functioning, mood, and neural markers.
Keywords: tDCS, cognitive training, older adults, cognition, intervention
Introduction
With a growing older adult population, there is an increasing need for interventions to avert age-related cognitive decline [1]. While crystallized cognition (e.g., acquired knowledge, vocabulary) is relatively preserved in late life, older adults’ ability to successfully manage day-to-day tasks can be negatively impacted by prototypical declines in fluid cognitive abilities (e.g., processing speed, attention, executive functioning) [2–4]. Subtle functional changes are associated with an increased risk of conversion from “normal aging” to mild cognitive impairment and dementia [5–7]. Therefore, early interventions aimed at enhancing cognition may help promote independence in late life and slow progression to dementia.
Cognitive training involves guided practice on cognitive tasks aimed at improving performance in one or more domains [8–9]. The Advanced Cognitive Training in Vital Elderly (ACTIVE) study examined the longitudinal effects of cognitive training in 2,832 older adults [10]. Cognitive training groups demonstrated improvements on trained tasks which remained over time and evidence of transfer to functional tasks [10–12]. While a variety of cognitive training studies have identified post-intervention gains on trained tasks and on tasks within similar domains [13–15], findings for transfer effects on untrained cognitive domains and daily functioning are less consistent, presenting a need to improve the efficacy of cognitive training interventions in producing clinically meaningful outcomes [11, 15–18].
Transcranial direct current stimulation (tDCS) is a promising non-invasive technique for inducing neuroplastic changes in the brain [19–20]. tDCS involves delivering a weak direct electrical current via electrodes placed on the surface of the scalp to enhance or diminish neuronal excitability [21–24]. The principal mechanism of action involves a subtle alteration of a neuron’s resting membrane potential affecting the neuron’s probability of firing [22]. Importantly, changes in cortical excitability and improvements in behavior induced by tDCS have been reported to persist long after the stimulation period [25–28]. Further, applying tDCS while an individual is engaging in an active task is thought to result in induced cortical plastic changes primarily in the brain areas functionally relevant for task execution [29]. Therefore, tDCS has been applied in conjunction with other interventions to further optimize behavioral and brain-based outcomes. Combining tDCS with cognitive training has demonstrated additive effects on cognitive and functional abilities in younger [30–32] and older adults [33–36]. For example, older adults who received active tDCS to the bilateral prefrontal cortex combined with cognitive training performed better on verbal working memory and attention tasks compared to those who received sham tDCS [34]. In a separate study, those who received active tDCS demonstrated greater gains on far transfer and functional tasks (e.g., scheduling an appointment) [35]. Finally, post-intervention cognitive gains have been associated with increases in resting-state functional connectivity [36–37], suggesting that this intervention may adaptively modify communication within brain networks vulnerable to aging. These small studies provide evidence that tDCS may potentiate the effects of cognitive training; however, large-scale randomized clinical trials are needed to further evaluate the intervention’s efficacy.
The present paper will report the primary results from the largest randomized clinical trial for tDCS completed to date: The Augmenting Cognitive Training in Older Adults study (ACT; clinicaltrials.gov NCT02851511). ACT uses an adaptive two-phase design. Phase 1 revealed that cognitive training resulted in greater improvements in performance on trained tasks compared to the educational training control group irrespective of tDCS group assignment [38–39]. Thus, phase 2 aimed to determine whether combining cognitive training with active stimulation would augment the benefits of training through improvements on untrained tasks. Using data collected from cognitive training and tDCS samples across both phase 1 and 2, we hypothesized that the active tDCS and cognitive training group would demonstrate greater improvements compared to the sham group on a composite of fluid cognitive abilities (NIH Toolbox Fluid Cognition Composite) from baseline to immediately following the 12-week intervention. We also extended planned analyses (Woods et al., 2018) to explore tDCS effects on the NIH Toolbox Fluid Cognition Composite at one year following baseline to evaluate all timepoints concurrently and the potential maintenance of effects over time. Overall, results provide important insights regarding the efficacy of combining tDCS with cognitive training to enhance cognition in older adults.
Methods
Trial Design
Details of the design and methods were published previously [40]. In brief, ACT was an adaptive two-phase randomized clinical trial that randomized 379 participants across the University of Florida and the University of Arizona (Figure 1). A larger number of participants were recruited and randomized than initially proposed (i.e., 360; Woods et al., 2018) due to an expected greater attrition rate in the context of the COVID-19 pandemic. In phase 1, a cohort of 87 participants were randomly assigned to one of four conditions for a 12-week intervention: cognitive training with active tDCS, cognitive training with sham tDCS, educational training with active tDCS, or educational training with sham tDCS. As previously mentioned, the cognitive training groups demonstrated greater improvements on proximal cognitive tasks compared to the educational training controls [38,39]; thus, the educational training arms were eliminated for phase 2. In phase 2, the remaining participants were randomized to only the two cognitive training arms (i.e., cognitive training with active tDCS or sham tDCS). In total, 334 participants who received cognitive training across phases were included in statistical analyses. Assessment measures and biomarker data were collected at baseline, within 48 hours of completing the three month intervention (further referred to as “post-intervention”), and at a one-year visit (i.e., 9 months following intervention completion, one year from randomization/baseline assessment). The current paper reports the effects of a combined cognitive training and tDCS intervention on the NIH Toolbox Fluid Cognition Composite using the baseline, post-intervention, and one-year timepoints.
Figure 1.
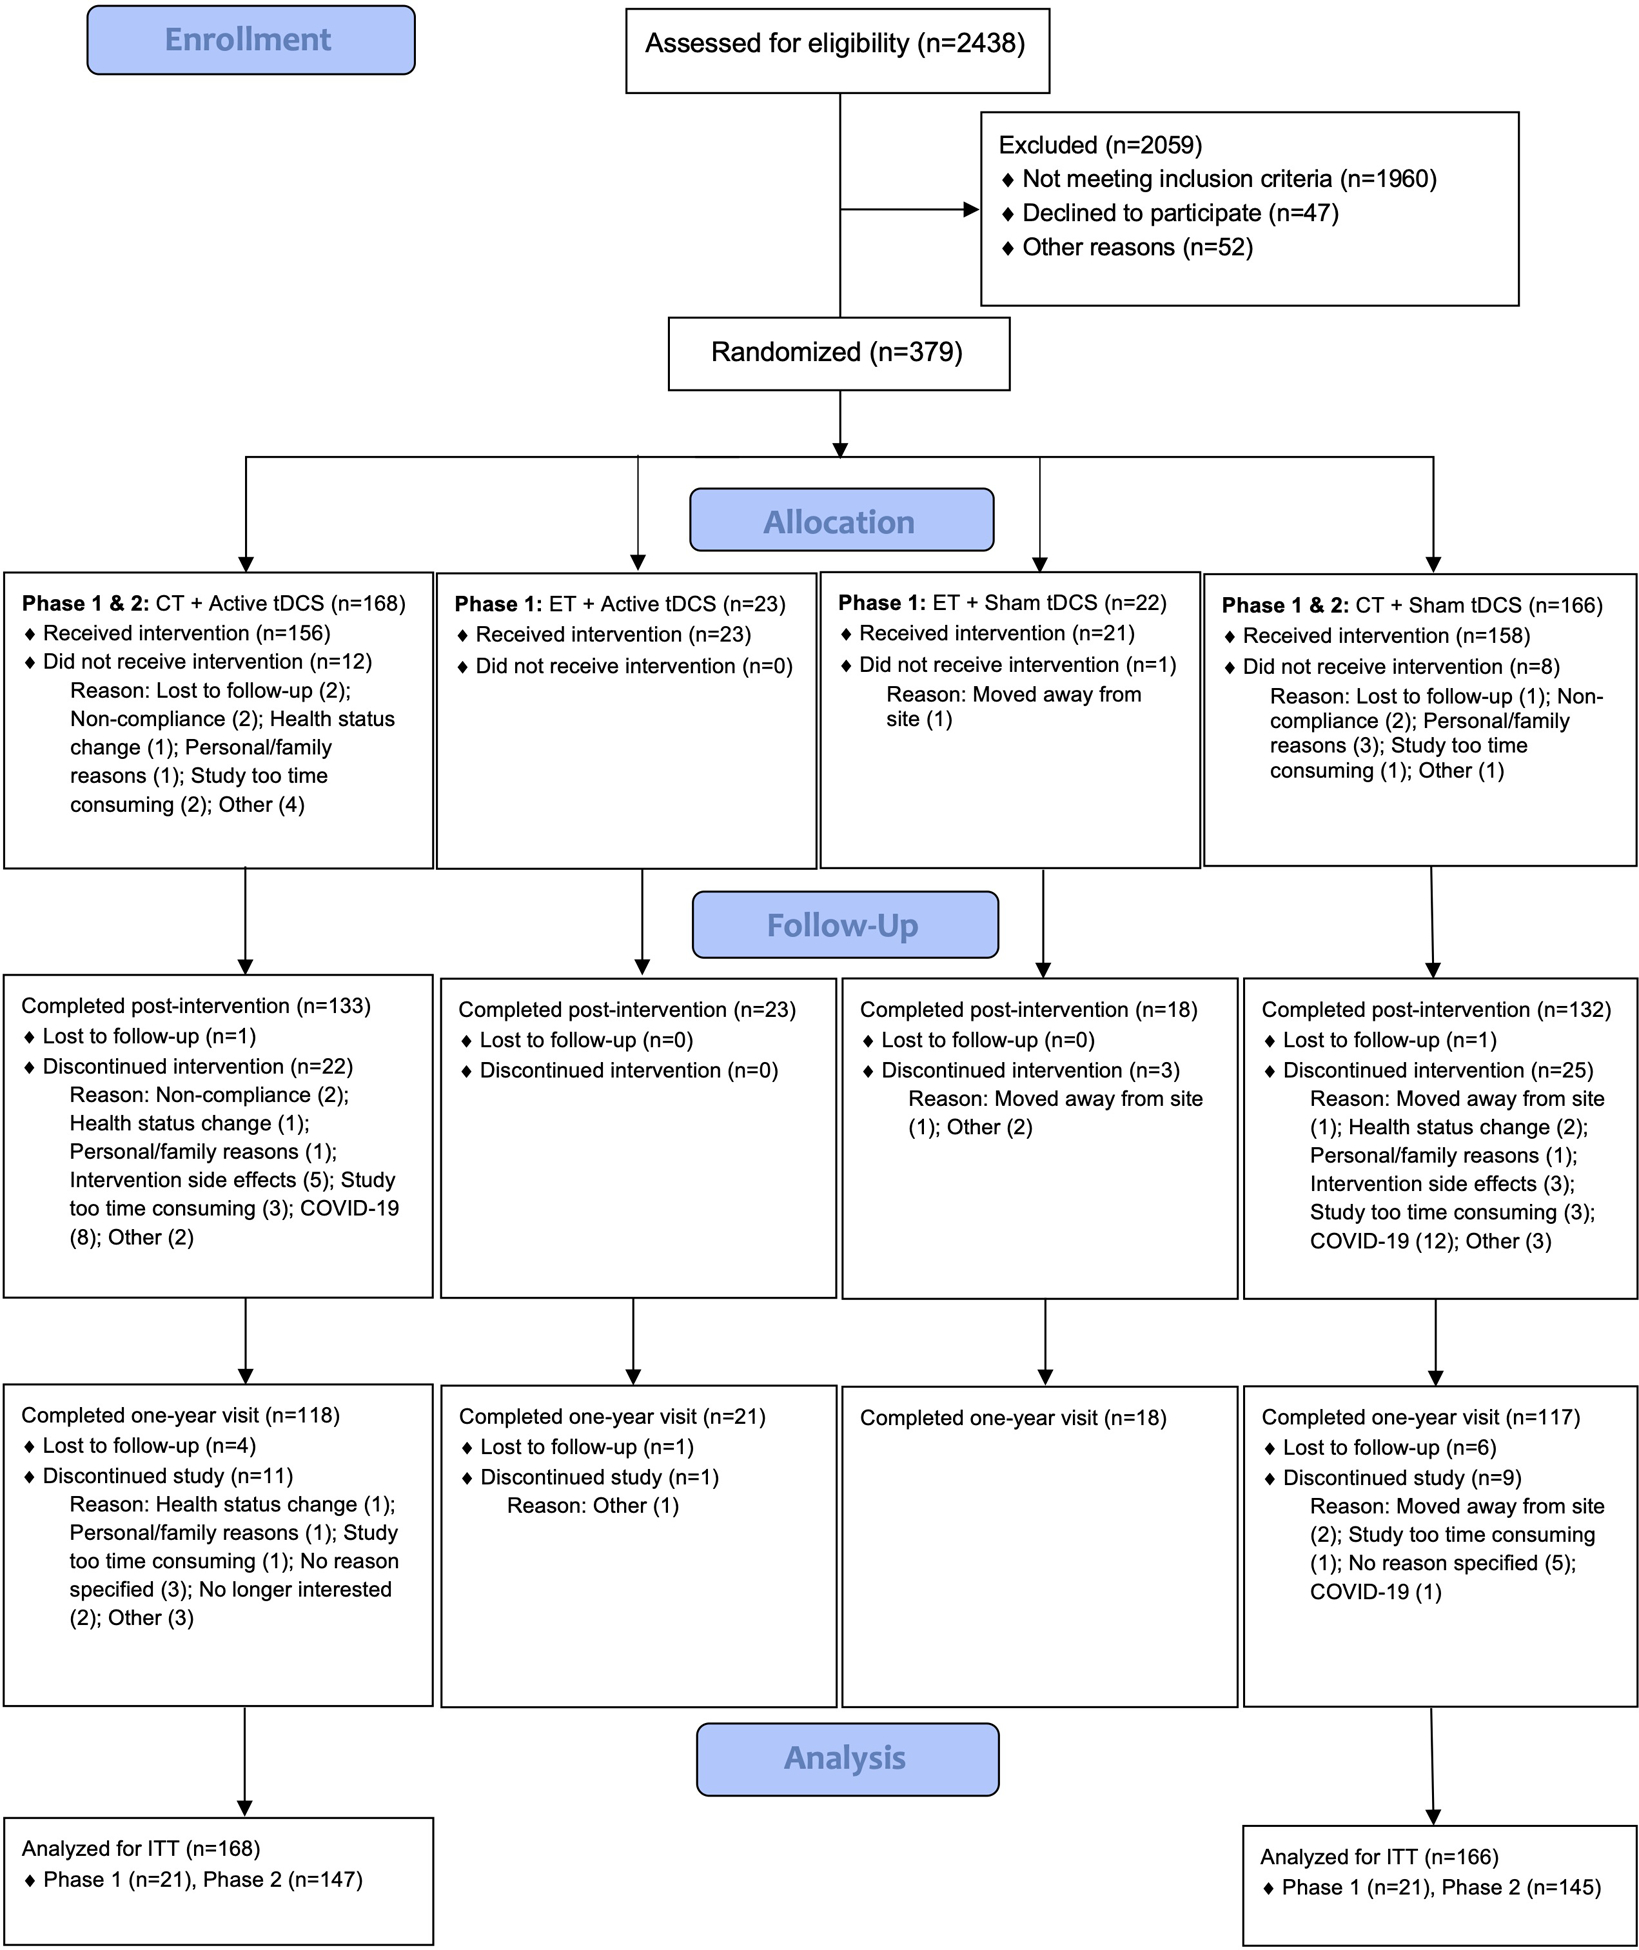
The ACT Study Flow Diagram
Notes: A CONSORT flow diagram depicting the phases of enrollment, intervention allocation, follow-up, and data analysis in this two-group parallel randomized trial. CT = cognitive training, ET = educational training, tDCS = transcranial direct current stimulation, ITT = intent-to-treat.
Participants
Eligibility and Demographics
Participants were recruited from the community by the University of Florida and the University of Arizona through presentations to the public, community events, postcard mailing campaigns, and advertisements (e.g., newspaper, radio, and television). Individuals who were interested in participating contacted the study site to receive more information and complete the initial screening process. Participants were included if they were between the ages of 65–89, right-handed, fluent in English, and had evidence of age-related cognitive decline. This was measured by performance below the 80th percentile on the Brain HQ Cognitive Training assessment composite score, which comprised the 8 tasks used in the cognitive training intervention. Participants were excluded if they had a formal diagnosis or evidence of mild cognitive impairment (1.5 standard deviations below normative data in a single cognitive domain on the National Alzheimer’s Coordinating Center Uniform Data Set battery [41]), dementia, past opportunistic brain infection, neurological disorders, history of major psychiatric illness, the presence of unstable and chronic medical conditions, cancer in the past 3 years, history of brain or head injury resulting in loss of consciousness greater than 20 minutes, colorblindness, uncorrected vision worse than 20/80, hearing loss greater than 20 decibels in either ear, MRI contraindications (e.g., claustrophobia, metal implants, inability to lie still for an hour), and if they were on medications that interfere with tDCS (GABA-ergic or glutamatergic medications or sodium channel blockers) [42]. All participants signed a consent form approved by the Institutional Review Boards at the University of Florida and at the University of Arizona. The entire sample included 334 healthy older adults (mean age = 71.5 ± 5.1) with 11–21 years of education. Overall, the sample was 88.0% White, 5.7% Black or African American, 2.4% American Indian or Alaskan Native, 0.9% Asian, 2.1% identified as more than one race, and 0.9% did not report. 93.4% of the sample identified as Non-Hispanic or Latinx (Table 1).
Table 1.
Demographic and Baseline Characteristics by Intervention Group.
| Variable | All Cognitive Training | |||
|---|---|---|---|---|
| Sham (N=166) | Active (N=168) | p | ||
| Age | M ± SD | 71.5 ± 4.8 | 71.5 ± 5.4 | 0.96 |
| Sex | Male | 55 (33.1%) | 64 (38.1%) | 0.34 |
| Female | 111 (66.9%) | 104 (61.9%) | ||
| Race | American Indian /Alaskan Native | 5 (3.0%) | 3 (1.8%) | 0.16 |
| Asian | 3 (1.8%) | 0 (0.0%) | ||
| African American / Black | 8 (4.8%) | 11 (6.5%) | ||
| White | 148 (89.2%) | 146 (86.9%) | ||
| Multiracial | 2 (1.2%) | 5 (3.0%) | ||
| Unknown / Not reported | 0 (0.0%) | 3 (1.8%) | ||
| Ethnicity | Hispanic or Latinx | 8 (4.8%) | 14 (8.3%) | 0.20 |
| Non-Hispanic or Latinx | 158 (95.2%) | 154 (91.7%) | ||
| Years of Education | M ± SD | 16.4 ± 2.4 | 16.3 ± 2.3 | 0.73 |
| Highest Academic Degree | GED or equivalent | 1 (0.6%) | 3 (1.8%) | 0.71 |
| High school graduate | 14 (8.4%) | 12 (7.1%) | ||
| Some college / associate degree | 38 (22.9%) | 34 (20.2%) | ||
| Bachelor’s degree | 47 (28.3%) | 56 (33.3%) | ||
| Professional / graduate degree | 66 (39.8%) | 63 (37.5%) | ||
| MoCA Total | M ± SD | 26.85 ± 1.87 | 26.66 ± 2.04 | 0.38 |
| NACC UDS MoCA Z-Score | M ± SD | 0.20 ± 0.73 | 0.14 ± 0.72 | 0.52 |
| NACC UDS Memory Z-Score | M ± SD | 0.04 ± 0.67 | −0.09 ± 0.69 | 0.07 |
| NACC UDS Executive / Working Memory Z-Score | M ± SD | −0.13 ± 0.59 | −0.14 ± 0.64 | 0.89 |
| NACC UDS Language Z-Score | M ± SD | 0.01 ± 0.63 | −0.00 ± 0.63 | 0.81 |
| # of medical problems | M ± SD | 3.5 ± 1.9 | 3.4 ± 1.9 | 0.65 |
| # of neurological problems | M ± SD | 0.3 ± 0.7 | 0.3 ± 0.6 | 0.71 |
| # of psychiatric problems | M ± SD | 0.5 ± 0.7 | 0.4 ± 0.7 | 0.54 |
| # of prescription drugs used | M ± SD | 3.2 ± 2.7 | 3.3 ± 2.8 | 0.60 |
| Brain HQ CT Composite Z-score | M ± SD | −0.20 ± 0.46 | −0.18 ± 0.44 | 0.73 |
| BDI-II Total | M ± SD | 3.4 ± 3.9 | 4.0 ± 4.8 | 0.21 |
| Site | UF | 115 (69.3%) | 119 (70.8%) | 0.76 |
| UA | 51 (30.7%) | 49 (29.2%) | ||
| Stimulation Adherence | Yes | 127 (76.5%) | 130 (77.4%) | 0.85 |
| No | 39 (23.5%) | 38 (22.6%) | ||
| Cognitive Training Adherence | Yes | 118 (71.1%) | 124 (73.8%) | 0.58 |
| No | 48 (28.9%) | 44 (26.2%) | ||
Notes: This table compares demographics and baseline characteristics between active and sham stimulation groups across everyone who received cognitive training in the trial. Z-scores were calculated for each cognitive domain in the National Alzheimer’s Coordinating Center Uniform Data Set (NACC UDS). MoCA = Montreal Cognitive Assessment, CT = Cognitive Training, BDI-II = Beck Depression Inventory – Second edition, UF = University of Florida, UA = University of Arizona.
Randomization
The clinical trial statistician performed randomization procedures using a permuted block randomization with block sizes of 8 and 12 and study site as a stratification factor. At each site, within the first eight participants, two participants were randomly assigned to each one of the 4 intervention conditions. Among the next twelve participants, three participants were randomly assigned to each one of the 4 intervention conditions.
Intervention
Cognitive Training
Phase 1 intervention procedures and educational training arms have been detailed previously [40]. Therefore, the following describes the cognitive training arms in phase 1 and 2.
Cognitive training involved completing approximately 40 hours of computerized tasks from Posit Science’s BrainHQ program (www.positscience.com) over the span of 12 weeks. There were 8 total tasks targeting attention/processing speed and working memory (described in Woods et al., 2018, [40]). They were presented equally in a randomized, counterbalanced fashion, and participants were asked to complete four of the tasks (10 minutes each) per day. The tasks were adaptive, increasing in difficulty as the participant progressed through the levels. The first 10 daily cognitive training sessions were completed at the study site over two weeks. During the first 20 minutes of these cognitive training sessions, participants simultaneously received either active or sham stimulation. Then, participants completed one weekly session of cognitive training combined with stimulation at the study site for ten weeks. On the days participants did not receive stimulation, they completed the remainder of their cognitive training sessions at home. Although participants were not supervised live while completing cognitive training at home, metrics of training progress (i.e., number of days trained, levels completed, and minutes spent training per day) were collected by the training website and reviewed with participants at their intervention visits. Using these data, study staff were able to quickly identify participants with low engagement, provide support, and discuss remediation strategies during weekly onsite intervention visits (e.g., establishing a consistent training schedule or making up a training day on the weekend). See Figure 2 for an example of a participant’s intervention timeline.
Figure 2.

Example of a Participant’s Intervention Timeline.
Notes: This schematic depicts an example of the 12-week intervention design. Dark blue squares represent participants completing ten consecutive days of cognitive training combined with stimulation (active or sham) at a study site followed by completing a combined intervention session once per week for 10 weeks. Light blue squares represent the remaining four days per week that participants only complete cognitive training at home for 10 weeks. Gray squares represent days that participants do not complete stimulation or cognitive training. tDCS + CT = transcranial direct current stimulation combined with cognitive training.
Transcranial Direct Current Stimulation
Intervention staff receive a unique 6-digit code depending on tDCS group assignment from the statistician to enter in the Soterix Direct Current Stimulator. Participants, interventionists, and outcome assessors were blinded to the tDCS condition assigned. The active stimulation group received bilateral frontal tDCS by applying 2mA of current for 20 minutes through two biocarbon rubber electrodes encased in saline-soaked 5×7 cm2 sponges. The electrodes were placed at F3 (cathode) and F4 (anode) using the International 10–20 measurement system. Participants tend to habituate to the sensation of tDCS within 30–60 seconds. Therefore, sham procedures were identical except participants only received 2mA of current during the first 30 seconds of the session. Finally, participants were administered a sensation questionnaire to identify perceived sensation (e.g., itching, tingling, burning) before, during, and after each stimulation session rating the intensity on a scale of 0–10.
Adherence
Adherent to intervention was defined by completing greater than or equal to 80% of cognitive training (i.e., ≥ 720 levels) and stimulation sessions (i.e., ≥ 16 sessions). All participants were included in analyses with adherence to cognitive training and stimulation included as binary covariates.
Outcomes
Blinding Questionnaire
Post-intervention, participants and intervention staff completed a questionnaire evaluating blinding efficacy to stimulation condition. Participants and interventionists who were unsure of the condition were presented with a forced choice question to provide their best guess. Finally, participants and interventionists were asked to rate their confidence regarding their answer choice.
NIH Toolbox
The primary outcome measure is the Fluid Cognition Composite (FCC) from the NIH Toolbox Cognition Battery [43]. The FCC provides a single measure of cognitive abilities vulnerable to aging. It comprises of five subtests assessing set-shifting (Dimensional Change Card Sort), attention/inhibitory control (Flanker), episodic memory (Picture Sequence Memory), working memory (List Sorting), and processing speed (Pattern Comparison). See Weintraub et al., 2013 [43] for task descriptions.
Adverse Events
At each assessment visit, participants were asked to report any adverse events and changes in medical conditions or medication use since their last visit. All adverse events were regularly reviewed by an external Data Safety Monitoring Board.
Statistical Analyses
Summary statistics were calculated by group for demographic characteristics and clinical variables at baseline and for the FCC at each assessment. Intent-To-Treat (ITT) analyses were performed to assess the effect of tDCS on changes in FCC from baseline to post-intervention and from baseline to one-year, with missing outcomes predicted by regression models that include demographic and baseline characteristics. Formal statistical inference of the tDCS effect was based on the inverse-normal combination of two p-values, one from the phase 1 data (N=42) and the other from the phase 2 data (N=292). In both analyses, regression models were fitted with change of FCC as the dependent variable and tDCS assignment group as the independent variable along with pre-specified covariates (age, sex, clinical site and baseline composite scores). More specifically, the overall test statistics were [√40 Φ−1(1- p1) + Φ−1(1- p2) √280]/ √320, where Φ−1 is the inverse of standard normal distribution function and the combination weights will be proportional to square root of preplanned sample sizes (40 and 280). In addition, we performed a sensitivity analysis comparing results from the ITT analyses with those from complete case analyses.
Results
Intervention Group Differences at Baseline
There were no significant baseline differences between tDCS groups in demographics, reports of medical history, NACC UDS domain scores, the Brain HQ Cognitive Training assessment composite, depression, or FCC scores (Tables 1 and 2). Analyses of baseline tDCS group differences separated by phase 1 and phase 2 samples is provided in Appendix Tables A.1 and A.2.
Table 2.
Average Outcome Measures by Intervention Group.
| Variable | All Cognitive Training | ||||
|---|---|---|---|---|---|
| Overall (N=334) |
Sham (N=166) |
Active (N=168) |
p | ||
| FCC | T1 | 51.8 ± 9.1 | 51.7 ± 8.7 | 51.9 ± 9.4 | 0.81 |
| T2 | 56.4 ± 9.1 | 56.1 ± 9.0 | 56.6 ± 9.2 | 0.66 | |
| T3 | 56.5 ± 9.3 | 55.9 ± 8.8 | 57.0 ± 9.7 | 0.30 | |
| T2 – T1 Change | 4.6 ± 6.3* | 4.5 ± 6.1* | 4.7 ± 6.5* | 0.78 | |
| T3 – T1 Change | 4.7 ± 6.4* | 4.3 ± 6.3* | 5.1 ± 6.6* | 0.26 | |
Notes: FCC = Fluid Cognition Composite, T1 = baseline assessment, T2 = post-intervention, T3 = one-year assessment. Composite scores are fully-corrected T-scores.
Change is significantly greater than 0 via one-sample t-test at p < 0.05.
Adherence
Overall, 76.9% of the 334 older adults (including those withdrawn) were considered adherent to stimulation, and 72.5% were considered adherent to cognitive training. There were no significant differences in adherence between tDCS groups (Table 1).
Blinding Efficacy
There were no significant differences in predicting treatment condition or confidence in predictions between active and sham groups for both the participant and experimenter blinding questionnaires (Tables 3, 4).
Table 3.
Blinding Efficacy.
| Variable | Response | Overall (n = 259)* |
Responses for those in the Active Group (n = 132) |
Responses for those in the Sham Group (n = 127) |
p |
|---|---|---|---|---|---|
| Participant: Which brain stimulation treatment condition do you believe you received? | Active | 150 (57.9%) | 74 (56.1%) | 76 (59.8%) | 0.54 |
| Sham | 109 (42.1%) | 58 (43.9%) | 51 (40.2%) | ||
| Experimenter: Which brain stimulation treatment condition do you believe the participant received? | Active | 107 (41.8%) | 53 (40.8%) | 54 (42.9%) | 0.73 |
| Sham | 149 (58.2%) | 77 (59.2%) | 72 (57,1%) |
Notes: This table depicts the true allocation of participants to each treatment condition who completed the questionnaire, the total number of responses overall for treatment condition predictions, and then the responses divided between those who actually received active and sham stimulation.
6 participants and 9 experimenters did not have valid responses to the corresponding question.
Table 4.
Confidence in Predicting Treatment Condition.
| Confidence | Statistics | Overall Ratings | Ratings for those in the Active Group | Ratings for those in the Sham Group | p |
|---|---|---|---|---|---|
| Participant: One a scale of 0 to 10, how confident are you that you received your answer selection? | Mean ± SD | 5.8 ± 3.0 | 6.1 ± 2.8 | 5.5 ± 3.2 | 0.24 |
| Median (Min, Max) | 6 (0, 10) | 6 (0, 10) | 6 (0, 10) | ||
| Experimenter: One a scale of 0 to 10, how confident are you that the participant received your answer selection? | Mean ± SD | 3.0 ± 2.8 | 3.1 ± 2.8 | 2.9 ± 2.8 | 0.68 |
| Median (Min, Max) | 3 (0, 9) | 3 (0, 9) | 2 (0, 9) |
Notes: 0 = not at all confident, 10 = completely confident.
NIH Toolbox Outcomes
Across the entire sample, there were significant improvements in FCC from baseline to post-intervention (Mean T2-T1 Change = 4.6) and from baseline to one-year (Mean T3-T1 change = 4.7; Table 2). Controlling for demographics, adherence, and baseline scores, tDCS group did not significantly predict changes in FCC from baseline to post-intervention or from baseline to one-year (Figure 3, Table 5). Older age and higher baseline scores were associated with smaller baseline to post-intervention improvements in FCC (p-values < 0.01; Table 5). From baseline to one-year, female participants demonstrated greater improvements in FCC compared to males, and higher baseline scores were associated with smaller improvements (p-values < 0.01; Table 5).
Figure 3.

Primary Outcome by tDCS Group from Baseline to Post-Intervention and Baseline to One-Year.
Notes: Plots depict distributions of the NIH Toolbox Fluid Cognition Composite fully-corrected T-scores (n = 334) by active and sham stimulation groups at a) baseline and post-intervention and b) baseline and one-year timepoints.
Table 5.
Primary Outcome Results.
| Outcome | Variable | All Cognitive Training | |||||
|---|---|---|---|---|---|---|---|
| Estimate | Lower 95% CI | Upper 95% CI | p | Combination Test p-value | |||
| FCC T2- T1 Change | Intercept | 37.14* | 27.62 | 46.65 | <0.01 | ||
| Stimulation Group | Active | 0.33 | −0.91 | 1.56 | 0.60 | 0.56 | |
| Sham | 0.00 | ||||||
| Age | −0.29* | −0.41 | −0.17 | <0.01 | |||
| Sex | Female | 1.24 | −0.06 | 2.54 | 0.06 | ||
| Male | 0.00 | ||||||
| Site | UF | 0.19 | −1.19 | 1.58 | 0.78 | ||
| UA | 0.00 | ||||||
| Education Level | Bachelor’s degree or above | −0.76 | −2.12 | 0.59 | 0.27 | ||
| Some college / associate degree or below | 0.00 | ||||||
| Stimulation Adherence | Yes | −0.42 | −2.52 | 1.69 | 0.70 | ||
| No | 0.00 | ||||||
| Cognitive Training Adherence | Yes | 0.51 | −1.49 | 2.51 | 0.62 | ||
| No | 0.00 | ||||||
| Baseline FCC | −0.24* | −0.31 | −0.17 | <0.01 | |||
| FCC T3-T1 Change | Intercept | 16.30* | 6.34 | 26.25 | <0.01 | ||
| Stimulation Group | Active | 1.03 | −0.26 | 2.32 | 0.12 | 0.11 | |
| Sham | 0.00 | ||||||
| Age | <0.01 | −0.13 | 0.12 | 0.96 | |||
| Sex | Female | 2.72* | 1.36 | 4.08 | <0.01 | ||
| Male | 0.00 | ||||||
| Site | UF | −1.05 | −2.50 | 0.40 | 0.16 | ||
| UA | 0.00 | ||||||
| Education Level | Bachelor’s degree or above | −0.65 | −2.07 | 0.77 | 0.37 | ||
| Some college / associate degree or below | 0.00 | ||||||
| Stimulation Adherence | Yes | −0.53 | −2.73 | 1.67 | 0.64 | ||
| No | 0.00 | ||||||
| Cognitive Training Adherence | Yes | 0.76 | −1.34 | 2.85 | 0.48 | ||
| No | 0.00 | ||||||
| Baseline FCC | −0.24* | −0.32 | −0.17 | <0.01 | |||
Notes: CI = confidence interval, UF = University of Florida, UA = University of Arizona, FCC = Fluid Cognition Composite, T1 = baseline, T2 = post-intervention, T3 = one-year. All composite scores are fully-corrected T-scores.
Significant at p < 0.01
Results separated by phase 1 and phase 2 samples are provided in Appendix Table A.3. Notably, solely in the phase 2 sample, there is a significant effect of tDCS group, such that the active group demonstrated a 1.57-point greater improvement in FCC from baseline to one-year compared to sham (p = 0.03; Table A.3). Sensitivity analyses revealed largely no differences between ITT and complete case analyses except that this phase 2 one-year tDCS effect is larger but non-significant in the smaller sample of completed cases (estimate = 1.72, p = 0.11; Table A.4).
Sensitivity Analysis
Given the null findings for tDCS effects, we performed a post hoc sensitivity analysis using the POWER procedure in the Statistical Analysis System (SAS) software. Assuming a within-group standard deviation of 6.3 points as observed and a two-tailed 0.05 significance level, the current total sample size of 334 would yield 80% statistical power to detect a between-group difference of 1.72 points in FCC change (Cohen’s effect size of 0.27) using a two-sample t-test and a partial correlation of 0.1555 between FCC change and treatment group using multiple regression controlling for seven covariates. As such, the present null findings are likely due to a true small tDCS effect as opposed to insufficient power to detect an effect.
Stimulation Sensation and Adverse Events
Across all stimulation sessions, the active tDCS group had lower ratings of pain prior to stimulation (p = 0.04) and greater ratings of tingling and burning during stimulation (p = 0.01, p < 0.01) compared to sham (Table 6). Notably, average ratings for each sensation were largely between 0 and 1 on a 10-point scale. Throughout the trial, the sham group reported more body-related adverse events (p = 0.04), while the active group reported more cardiac-related adverse events (p = 0.045; Table 7). In particular, there was a greater number of individuals reporting high blood pressure in the active group (Table A.5), which has not been shown to be related to effects of stimulation. There were no significant group differences in serious adverse events.
Table 6.
Average Ratings of Sensations Experienced Before, During, and After Stimulation by tDCS Group.
| Ratings | Before stimulation | During stimulation | After stimulation | |||||||||||||||
|---|---|---|---|---|---|---|---|---|---|---|---|---|---|---|---|---|---|---|
| Active | Sham | t | p | Active | Sham | t | p | Active | Sham | t | p | |||||||
| M | SD | M | SD | M | SD | M | SD | M | SD | M | SD | |||||||
| Tingling | 0.08 | 0.35 | 0.18 | 0.78 | −1.60 | 0.11 | 1.14 | 1.55 | 0.76 | 0.99 | 2.77 | 0.01 | 0.07 | 0.17 | 0.18 | 0.85 | −1.75 | 0.08 |
| Itching | 0.12 | 0.30 | 0.13 | 0.57 | −0.21 | 0.84 | 0.55 | 1.14 | 0.40 | 0.85 | 1.46 | 0.15 | 0.13 | 0.47 | 0.06 | 0.22 | 1.70 | 0.09 |
| Burning | 0.04 | 0.13 | 0.06 | 0.36 | −0.64 | 0.52 | 1.18 | 1.61 | 0.76 | 1.06 | 2.89 | <0.01 | 0.07 | 0.21 | 0.08 | 0.48 | −0.45 | 0.65 |
| Pain | 0.21 | 0.51 | 0.38 | 0.92 | −2.11 | 0.04 | 0.40 | 1.17 | 0.24 | 0.56 | 1.67 | 0.10 | 0.09 | 0.49 | 0.16 | 0.60 | −1.17 | 0.24 |
| Fatigue | 0.30 | 0.73 | 0.39 | 0.98 | −0.99 | 0.32 | 0.39 | 0.74 | 0.34 | 0.94 | 0.49 | 0.62 | 0.35 | 0.66 | 0.37 | 0.94 | −0.22 | 0.83 |
| Nervousness | 0.10 | 0.62 | 0.10 | 0.33 | −0.02 | 0.99 | 0.23 | 0.63 | 0.23 | 0.66 | −0.07 | 0.94 | 0.10 | 0.33 | 0.13 | 0.44 | −0.55 | 0.58 |
| Headache | 0.13 | 0.32 | 0.16 | 0.50 | −0.77 | 0.44 | 0.11 | 0.69 | 0.09 | 0.28 | 0.27 | 0.79 | 0.07 | 0.27 | 0.11 | 0.32 | −1.11 | 0.27 |
| Difficulty concentrating | 0.17 | 0.50 | 0.18 | 0.42 | −0.11 | 0.91 | 0.59 | 1.11 | 0.46 | 0.92 | 1.23 | 0.22 | 0.30 | 0.66 | 0.27 | 0.53 | 0.41 | 0.68 |
| Mood change | 0.12 | 0.45 | 0.09 | 0.35 | 0.57 | 0.57 | 0.15 | 0.43 | 0.17 | 0.74 | −0.39 | 0.69 | 0.14 | 0.46 | 0.08 | 0.25 | 1.46 | 0.15 |
| Vision change | 0.04 | 0.14 | 0.05 | 0.18 | −0.14 | 0.89 | 0.13 | 0.42 | 0.12 | 0.69 | 0.18 | 0.86 | 0.06 | 0.19 | 0.03 | 0.11 | 1.63 | 0.10 |
| Visual sensation (phosphenes) | 0.01 | 0.09 | 0.04 | 0.38 | −1.03 | 0.31 | 0.02 | 0.13 | 0.01 | 0.09 | 0.87 | 0.39 | 0.02 | 0.14 | 0.01 | 0.09 | 0.76 | 0.45 |
Table 7.
Summary of Adverse Events Excluding Serious Adverse Events by Body System.
| Body System | Overall (N=334) | Sham (N=166) | Active (N=168) | p |
|---|---|---|---|---|
| Overall | 144 (43.1%) | 75 (45.2%) | 69 (41.1%) | 0.45 |
| Body | 47 (14.1%) | 30 (18.1%) | 17 (10.1%) | 0.04 |
| Cardiac | 21 (6.3%) | 6 (3.6%) | 15 (8.9%) | 0.05 |
| Ears | 5 (1.5%) | 2 (1.2%) | 3 (1.8%) | 1.00 |
| Eyes | 22 (6.6%) | 10 (6.0%) | 12 (7.1%) | 0.68 |
| Gastrointestinal | 12 (3.6%) | 4 (2.4%) | 8 (4.8%) | 0.38 |
| Genitourinary | 16 (4.8%) | 10 (6.0%) | 6 (3.6%) | 0.29 |
| Lungs | 1 (0.3%) | 0 (0.0%) | 1 (0.6%) | 1.00 |
| Musculoskeletal | 20 (6.0%) | 12 (7.2%) | 8 (4.8%) | 0.34 |
| Neurological | 26 (7.8%) | 13 (7.8%) | 13 (7.7%) | 0.98 |
| Psychological | 9 (2.7%) | 4 (2.4%) | 5 (3.0%) | 1.00 |
| Renal | 2 (0.6%) | 2 (1.2%) | 0 (0.0%) | 0.25 |
| Skin | 46 (13.8%) | 26 (15.7%) | 20 (11.9%) | 0.32 |
Notes: The counts in the “overall” row are the number of participants reporting at least one adverse event. The counts in the remaining rows are the number of participants who reported an adverse event in that specified body system. Percentages reflect the percent of participants out of the total in each group (334, 166, 168, respectively) reporting the specified adverse event.
Discussion
As the largest randomized clinical trial in tDCS to date, the ACT study provides a foundational framework for the rigorous application of tDCS on a large scale and sheds light on the effects of tDCS combined with cognitive training in older adults. Prior results from phase 1 of ACT demonstrated the efficacy of cognitive training in improving performance on trained tasks compared to an educational training control [38, 39]. The present findings, combining those who received cognitive training across phases, revealed improvements in the entire sample on a composite score of untrained fluid cognitive tasks (i.e., NIH Toolbox Fluid Cognition Composite) that involve trained domains (e.g., attention, processing speed, working memory). However, it is difficult to determine how much these gains relate to cognitive training versus practice effects. Prior studies have examined practice effects using the Fluid Cognition Composite standard scores in older adults. Findings revealed a small 2.7-point gain with 3–5 weeks between administrations [44], yet no practice effects with 15 months between administrations [45]. Using fully-corrected T-scores, we demonstrated a nearly 5-point improvement post-intervention (i.e., three months from baseline) that remained one year following baseline. Perhaps, the multidomain cognitive training paradigm alone produced stable near-transfer effects; however, future studies examining differences in performance gains on the Fluid Cognition Composite between cognitive training and control groups are needed to support this speculation.
The primary aim of the ACT trial was to determine if applying tDCS would augment the effects of cognitive training. Contrary to hypotheses, we failed to demonstrate an additive effect of tDCS, such that there were no significant differences between active and sham stimulation groups in improvements on fluid cognition post-intervention and one year following baseline. This is surprising given prior evidence of enhanced cognitive performance in domains of working memory and episodic memory and evidence of transfer effects following active stimulation with cognitive training in older adults [33–36, 46, 47]. For instance, in a sample of 90 healthy older adults, individuals who received 2mA of stimulation combined with working memory training improved on working memory, processing speed, cognitive flexibility, arithmetic, and functional tasks after one month without contact [35]. Similarly, Teixeira-Santos and colleagues (2022) demonstrated that intervention-related improvements on near-transfer tasks predicted improvements on an untrained reasoning task, suggesting that far-transfer effects are directly related to the enhancement of the trained construct [46]. In contrast, in 123 older adults, Nilsson and colleagues (2017) found no additional benefit of stimulation on working memory training gains [48]. Like the ACT trial, these studies attempted to enhance cognition in older adults using tDCS and cognitive training by targeting the prefrontal cortex – an area structurally and functionally altered with age [49–51]. However, heterogeneous results are likely related to variability in tDCS implementation regarding electrode positioning (e.g., F3/F4, F3/Fp2, F4/contralateral cheek), current dose (2mA for 15, 20, 25, 30 minutes), and frequency of stimulation (5, 10, 20 sessions). In addition, differences in the trained tasks, duration of cognitive training sessions (e.g., 20–40 minutes), and outcome measures may also impact the ability to detect tDCS effects. For instance, although the present cognitive training paradigm targeted multiple domains, perhaps there were differential effects of tDCS, such that certain domains (e.g., working memory) benefitted more from stimulation than others. If that was the case, our selected outcome measure of the NIH Toolbox Fluid Cognition Composite might not have been as sensitive to detect tDCS effects as other single domain tests like the individual NIH Toolbox subtests, standard neuropsychological measures, or neuroimaging task paradigms. Taken together, it is challenging to determine which specific combination of parameters and outcome measures should be used to evaluate these intervention effects in older adults.
The design of the tDCS and cognitive training intervention in the ACT trial was based on a pilot study that demonstrated stimulation effects on working memory performance following two weeks of daily bifrontal tDCS (F3/F4, active stimulation = 2mA for 20 minutes) combined with cognitive training in older adults [33]. To facilitate longer lasting effects, the ACT study extended this design by including an additional ten weeks of cognitive training with stimulation provided only once per week to model “booster” tDCS sessions. Booster stimulation sessions offer promising therapeutic effects in individuals with fibromyalgia and drug cravings [52,53]. However, studies have yet to examine the efficacy of booster stimulation sessions on maintaining cognitive training gains. Thus, in the present study, tDCS effects may have been present following the two weeks of daily stimulation combined with cognitive training but diminished by the post-intervention assessment. Without data collected at this two-week timepoint, these temporal patterns cannot be explored in ACT but should be evaluated by future studies.
It may also be the case that we did not deliver sufficient current to frontal brain regions with stimulation. For instance, 1–1.5cm electrode shifts can significantly alter current distribution in the brain [54]. While standardized procedures were used to place electrodes at F3/F4, if there were slight inaccuracies in electrode position across stimulation sessions or electrode drift during cognitive training, optimal current levels may not have consistently reached target regions. 3D head models of each participant’s electrode placement were taken at every stimulation session before and after cognitive training. Future ACT analyses will examine these head models to assess electrode placement accuracy, generate participant-specific current density maps, and evaluate the potential effects of electrode placement on response to intervention.
Additionally, there is limited knowledge regarding the neurophysiological effects of tDCS in the aging brain. In younger adults, applying 2mA of current for 20 minutes to the motor cortex increases cortical excitability underneath both the anode and cathode [55, 56]. Adults ages 50–65 also experience increased excitability underneath the cathode at these parameters, while older adults ages 66–80 demonstrate slight reductions in excitability [57]. In contrast, applying 2mA to the frontal cortex during an in-scanner working memory task using the F3/F4 montage results in increased functional connectivity between left frontal regions under the cathode during active stimulation in older adults [37]. Without concurrent measures of cortical excitability collected during stimulation, we do not know if we achieved the intended net excitation of the frontal cortex with the present stimulation parameters in our older adult sample. However, future ACT analyses will include tDCS effects on neuroimaging markers collected post-intervention and one year following baseline to provide insight into the effects of this stimulation protocol in a large older adult sample.
Furthermore, increasing evidence to suggests that inter-individual anatomical differences can affect response to tDCS due to differing amounts of current reaching cortical tissue. For instance, age-related brain atrophy results in a concomitant increase in cerebrospinal fluid, which has high conductivity compared to cortical tissue [58]. As such, greater atrophy has been associated with less electrical current reaching the brain in older adults due to shunting [59]. In addition, variations in skull thickness, white matter hyperintensities, and adipose tissue can also affect current density [60–62]. Therefore, depending on their unique anatomical factors, individuals may require higher current doses to effectively target brain regions and produce a behavioral response. Optimizing current dose is important because current direction and intensity predict behavioral outcomes in older adults with 86% accuracy [63]. Thus, in the present study, applying the same tDCS parameters across the entire sample may not have resulted in optimal current delivery to frontal brain regions for each individual. To better facilitate a treatment response, future trials should investigate using baseline neuroimaging data and computational modeling techniques to create and implement individualized tDCS dosing parameters to ensure optimal current delivery for every participant.
There was potential evidence of this tDCS response variability at the group level with differences in stimulation effects between ACT phase 1 (n = 42) and phase 2 samples (n = 292). In the phase 2 sample, those who received active stimulation with cognitive training demonstrated greater gains on the Fluid Cognition Composite compared to sham one year following baseline. There were no tDCS effects detected in the phase 1 sample. These findings may be related to the discrepancies in sample sizes, with phase 2 having greater power to detect effects. However, it is notable that the direction of the tDCS effects was opposite between phases at both timepoints (i.e., active group demonstrating performance reductions in the phase 1 sample versus gains in the phase 2 sample), likely influencing the ability to detect an overall effect in the combined sample. In phase 1, there were significantly more males in the active tDCS group and females in the sham tDCS group, while sex distribution was balanced across conditions in phase 2. Mediated by sex differences in brain structure, female older adults receive higher current density in targeted regions than their male counterparts [64], which may partly explain these discrepancies given the male-dominated active stimulation group in phase 1. In the present study, females also experienced greater one-year gains in the Fluid Cognition Composite compared to males, further demonstrating the importance of considering individual-level factors that may impact tDCS and cognitive training efficacy when designing intervention trials in older adults.
In the ACT study, the cognitive training intervention involved completing 40 hours of computerized tasks from a commercially-available program that have produced performance gains in older adults [33,65,66]. While we demonstrated overall improvements on the primary outcome using this training paradigm, inter-individual differences in cognitive training engagement may have impacted response to stimulation. For instance, those who completed more total minutes or achieved higher difficulty levels may have experienced greater benefits from stimulation. Cognitive training adherence was not a significant predictor in models. However, since this was a binary variable, it did not account for the actual range of cognitive training levels participants completed. Future ACT analyses should evaluate data collected for each participant by the cognitive training program, such as the number of days trained, levels and minutes completed per day, and spacing between training sessions to determine if these factors influence tDCS efficacy. Analyses of these metrics would also provide insight into the amount and frequency of cognitive training necessary to produce optimal effects in older adults.
Cognitive training task difficulty may also impact the efficacy of tDCS, as behavioral improvements occur specifically when stimulation is paired with higher demanding tasks [67]. To avoid ceiling effects on cognitive training tasks, we intentionally excluded participants who performed above the 80th percentile on the cognitive training composite at baseline. However, it may be the case that the present cognitive training and tDCS intervention produces larger effects in individuals with greater cognitive impairment compared to our non-pathological, highly educated sample. For instance, individuals with lower baseline cognitive ability demonstrate greater performance gains following cognitive training compared to those with higher baseline cognitive ability, potentially due to a sufficient “mismatch” between the task demand and functional supply of the brain [68–72]. Similarly, in the present study, individuals with higher baseline Fluid Cognition Composite scores experienced smaller improvements, suggesting they may not have further profited from the intervention in the short-term (i.e., post-intervention and one-year). However, it may be the case that in non-pathological older adults, active stimulation combined with cognitive training allows for better maintenance of cognitive functioning over time. If so, more significant discrepancies in cognitive performance may emerge between active and sham stimulation groups several years after intervention. The significant tDCS effect present at the one-year timepoint in the phase 2 sample may be initial evidence supporting this maintenance hypothesis; however, future analyses should investigate trajectories of decline between intervention groups using longer follow-up timepoints.
Finally, the ACT trial primarily consisted of Non-Hispanic or Latinx and White individuals, which limits the generalizability of findings to systemically marginalized populations. The United States population is becoming increasingly racially and ethnically diverse, which further supports the need for conducting inclusive, representative research on the growing aging population [54–56]. Non-Hispanic Black/African American and Hispanic individuals have a higher prevalence of dementia than White individuals, which can be explained by disparities in health and lived experiences due to structural racism [73–80]. To examine the clinical utility of a cognitive intervention, clinical trials must be conducted on samples representative of the diverse aging population affected by cognitive decline.
Concluding Remarks
The clinical application of combining tDCS with cognitive training to improve cognition in older adults remains unclear. In the present paper, there were improvements on the NIH Toolbox Fluid Cognition Composite immediately following the intervention that were maintained one year after baseline; however, we failed to demonstrate an additive benefit of receiving active stimulation during cognitive training. Nevertheless, the ACT trial has provided a model for the safe administration of tDCS on a large scale, which can inform future tDCS trials using an individualized dosing approach to better facilitate a treatment response. Finally, future ACT trial analyses will examine the intervention’s impact on additional assessments of cognition, daily functioning, mood, and brain structure and function.
Table 8.
Summary of Serious Adverse Events by Body System.
| Body System | Overall (N=334) | Sham (N=166) | Active (N=168) | p |
|---|---|---|---|---|
| Overall | 35 (10.5%) | 19 (11.4%) | 16 (9.5%) | 0.57 |
| Body | 6 (1.8%) | 5 (3.0%) | 1 (0.6%) | 0.12 |
| Cardiac | 5 (1.5%) | 2 (1.2%) | 3 (1.8%) | 1.00 |
| Ears | 0 | 0 | 0 | |
| Eyes | 2 (0.6%) | 2 (1.2%) | 0 (0.0%) | 0.25 |
| Gastrointestinal | 9 (2.7%) | 7 (4.2%) | 2 (1.2%) | 0.10 |
| Genitourinary | 2 (0.6%) | 2 (1.2%) | 0 (0.0%) | 0.25 |
| Lungs | 4 (1.2%) | 2 (1.2%) | 2 (1.2%) | 1.00 |
| Musculoskeletal | 5 (1.5%) | 2 (1.2%) | 3 (1.8%) | 1.00 |
| Neurological | 3 (0.9%) | 1 (0.6%) | 2 (1.2%) | 1.00 |
| Psychological | 0 | 0 | 0 | |
| Renal | 1 (0.3%) | 0 (0.0%) | 1 (0.6%) | 1.00 |
| Skin | 8 (2.4%) | 4 (2.4%) | 4 (2.4%) | 1.00 |
Notes: The counts in the “overall” row are the number of participants reporting at least one adverse event. The counts in the remaining rows are the number of participants who reported an adverse event in that specified body system. Percentages reflect the percent of participants out of the total in each group (334, 166, 168, respectively) reporting the specified adverse event.
Acknowledgments
We would like to thank the participants who devoted their time to the study. This work was supported by the National Institute on Aging [NIA R01AG054077, NIA P30AG019610], the State of Arizona and Arizona Department of Health Services (ADHS), the University of Florida Center for Cognitive Aging and Memory Clinical Translational Research, and the McKnight Brain Research Foundation.
Appendix A
Table A.1.
Demographic and Baseline Characteristics by Phase and Intervention Group.
| Variable | Phase 1 | Phase 2 | |||||
|---|---|---|---|---|---|---|---|
| Sham (N=21) | Active (N=21) | p | Sham (N=145) | Active (N=147) | p | ||
| Age | M ± SD | 71.2 ± 4.1 | 69.8 ± 3.9 | 0.24 | 71.6 ± 5.0 | 71.8 ± 5.6 | 0.69 |
| Sex | 0.01 | 0.93 | |||||
| Female | 15 (71.4%) | 6 (28.6%) | 96 (66.2%) | 98 (66.7%) | |||
| Race | 0.77 | 0.21 | |||||
| Unknown / Not reported | 0 (0.0%) | 0 (0.0%) | 0 (0.0%) | 3 (2.0%) | |||
| Ethnicity | 0.99 | 0.09 | |||||
| Non-Hispanic or Latinx | 18 (85.7%) | 19 (90.5%) | 140 (96.6%) | 135 (91.8%) | |||
| Years of Education | M ± SD | 16.6 ± 2.2 | 16.3 ± 2.4 | 0.74 | 16.3 ± 2.5 | 16.3 ± 2.3 | 0.81 |
| Highest Academic Degree | 0.93 | 0.55 | |||||
| Professional / graduate degree | 9 (42.9%) | 10 (47.6%) | 57 (39.3%) | 53 (36.1%) | |||
| MoCA Total | M ± SD | 27.00 ± 1.41 | 26.62 ± 2.38 | 0.53 | 26.83 ± 1.93 | 26.67 ± 1.99 | 0.48 |
| NACC UDS MoCA Z-Score | M ± SD | 0.22 ± 0.63 | 0.11 ± 0.83 | 0.64 | 0.19 ± 0.74 | 0.15 ± 0.70 | 0.61 |
| NACC UDS Memory Z-Score | M ± SD | −0.07 ± 0.62 | −0.20 ± 0.61 | 0.48 | 0.06 ± 0.67 | −0.08 ± 0.70 | 0.09 |
| NACC UDS Executive / Working Memory Z-Score | M ± SD | −0.06 ± 0.64 | −0.42 ± 0.67 | 0.09 | −0.14 ± 0.58 | −0.10 ± 0.63 | 0.57 |
| NACC UDS Language Z-Score | M ± SD | 0.06 ± 0.58 | −0.12 ± 0.72 | 0.38 | 0.00 ± 0.64 | 0.01 ± 0.62 | 0.93 |
| # of medical problems | M ± SD | 2.8 ± 1.8 | 3.2 ± 1.5 | 0.41 | 3.6 ± 1.9 | 3.4 ± 1.9 | 0.45 |
| # of neurological problems | M ± SD | 0.0 ± 0.2 | 0.2 ± 0.5 | 0.25 | 0.3 ± 0.7 | 0.3 ± 0.7 | 0.91 |
| # of psychiatric problems | M ± SD | 0.5 ± 0.8 | 0.3 ± 0.6 | 0.38 | 0.5 ± 0.7 | 0.4 ± 0.7 | 0.75 |
| # of prescription drugs used | M ± SD | 2.2 ± 2.3 | 3.8 ± 2.9 | 0.06 | 3.3 ± 2.7 | 3.3 ± 2.8 | 0.89 |
| Brain HQ CT Composite Z-score | M ± SD | −0.21 ± 0.46 | −0.26 ± 0.60 | 0.78 | −0.20 ± 0.47 | −0.17 ± 0.42 | 0.61 |
| BDI-II Total | M ± SD | 2.8 ± 3.9 | 4.2 ± 5.5 | 0.35 | 3.5 ± 4.0 | 4.0 ± 4.7 | 0.34 |
| Site | |||||||
| UA | 9 (42.9%) | 9 (42.9%) | 42 (29.0%) | 40 (27.2%) | |||
| Stimulation Adherence | 0.55 | 0.74 | |||||
| No | 1 (4.8%) | 2 (9.5%) | 38 (26.2%) | 36 (24.5%) | |||
| Cognitive Training Adherence | 1.00 | 0.56 | |||||
| No | 3 (14.3%) | 3 (14.3%) | 45 (31.0%) | 41 (27.9%) | |||
Notes: This table compares demographics and baseline characteristics between active and sham stimulation groups across phase I and phase 2 of the trial. Z-scores were calculated for each cognitive domain in the National Alzheimer’s Coordinating Center Uniform Data Set (NACC UDS). MoCA = Montreal Cognitive Assessment, CT = Cognitive Training, BDI-II = Beck Depression Inventory – Second edition, UF = University of Florida, UA = University of Arizona.
In phase 1, there were significant sex differences between groups with 15 females versus 6 males in the sham group and 15 males versus 6 females in the active group (p = 0.01; Table A.1). This difference was not present in phase 2 or in the combined sample.
Table A.2.
Average Outcome Measures by Phase and Intervention Group.
| Variable | Phase 1 | Phase 2 | |||||||
|---|---|---|---|---|---|---|---|---|---|
| Overall (N=42) |
Sham (N=21) |
Active (N=21) |
p | Overall (N=292) |
Sham (N=145) |
Active (N=147) |
p | ||
| FCC | T1 | 50.3 ± 8.6 | 53.0 ± 8.0 | 47.6 ± 8.6 | 0.04 | 52.0 ± 9.1 | 51.5 ± 8.8 | 52.5 ± 9.4 | 0.32 |
| T2 | 54.0 ± 9.4 | 57.2 ± 8.1 | 50.9 ± 9.7 | 0.03 | 56.7 ± 9.0 | 56.0 ± 9.1 | 57.4 ± 8.8 | 0.19 | |
| T3 | 54.6 ± 9.5 | 58.5 ± 8.7 | 50.8 ± 8.8 | <0.01 | 56.7 ± 9.2 | 55.5 ± 8.8 | 57.9 ± 9.6 | 0.03 | |
| T2 – T1 Change | 3.7 ± 5.9* | 4.1 ± 5.8* | 3.3 ± 6.1* | 0.66 | 4.7 ± 6.3* | 4.5 ± 6.1* | 4.9 ± 6.5* | 0.66 | |
| T3 – T1 Change | 4.3 ± 6.6* | 5.5 ± 8.2* | 3.2 ± 4.4* | 0.27 | 4.7 ± 6.4* | 4.1 ± 6.0* | 5.3 ± 6.8* | 0.10 | |
Notes: FCC = Fluid Cognition Composite, T1 = baseline assessment, T2 = post-intervention, T3 = one-year assessment. Composite scores are fully-corrected T-scores.
Change is significantly greater than 0 via one-sample t-test at p < 0.05.
In phase 1, the sham group had higher FCC scores at baseline compared to the active group (p = 0.038; Table A.2). This difference was not present in phase 2 or in the combined sample. In phase 1 and phase 2, there were improvements on FCC from baseline to post-intervention and baseline to one-year significantly greater than zero.
Table A.3.
Primary Outcome Results by Phase.
| Outcome | Variable | Phase 1 | Phase 2 | |||||||
|---|---|---|---|---|---|---|---|---|---|---|
| Estimate | Lower 95% CL | Upper 95% CL | P | Estimate | Lower 95% CL | Upper 95% CL | P | |||
| FCC T2-T1 Change | Intercept | 31.17 | −8.36 | 70.71 | 0.12 | 39.13* | 29.16 | 49.11 | <0.01 | |
| Stimulation Group | Active | −2.61 | −7.25 | 2.02 | 0.26 | 0.70 | −0.61 | 2.02 | 0.29 | |
| Sham | 0.00 | 0.00 | ||||||||
| Age | −0.20 | −0.74 | 0.34 | 0.46 | −0.30* | −0.43 | −0.18 | <0.01 | ||
| Sex | Female | −0.75 | −5.85 | 4.36 | 0.77 | 1.09 | −0.31 | 2.48 | 0.13 | |
| Male | 0.00 | 0.00 | ||||||||
| Site | UF | −0.39 | −4.80 | 4.02 | 0.86 | 0.06 | −1.44 | 1.56 | 0.94 | |
| UA | 0.00 | 0.00 | ||||||||
| Education Level | Bachelor’s degree or above | 1.56 | −2.93 | 6.04 | 0.48 | −1.15 | −2.59 | 0.29 | 0.12 | |
| Some college / associate degree or below | 0.00 | 0.00 | ||||||||
| Stimulation Adherence | Yes | −5.01 | −15.6 | 5.59 | 0.34 | −0.16 | −2.32 | 2.00 | 0.88 | |
| No | 0.00 | 0.00 | ||||||||
| Cognitive Training Adherence | Yes | 1.57 | −6.06 | 9.19 | 0.68 | 0.51 | −1.58 | 2.59 | 0.63 | |
| No | 0.00 | 0.00 | ||||||||
| Baseline FCC | −0.19 | −0.44 | 0.06 | 0.14 | −0.26* | −0.33 | −0.19 | <0.01 | ||
| FCC T3-T1 Change | Intercept | 21.03 | −22.19 | 64.25 | 0.33 | 17.39* | 6.97 | 27.81 | <0.01 | |
| Stimulation Group | Active | −2.96 | −8.03 | 2.11 | 0.24 | 1.57* | 0.20 | 2.94 | 0.03 | |
| Sham | 0.00 | 0.00 | ||||||||
| Age | −0.03 | −0.62 | 0.56 | 0.92 | −0.01 | −0.14 | 0.12 | 0.92 | ||
| Sex | Female | 2.19 | −3.39 | 7.77 | 0.43 | 2.52 | 1.06 | 3.98 | <0.01 | |
| Male | 0.00 | 0.00 | ||||||||
| Site | UF | −0.56 | −5.39 | 4.26 | 0.81 | −1.25 | −2.82 | 0.31 | 0.12 | |
| UA | 0.00 | 0.00 | ||||||||
| Education Level | Bachelor’s degree or above | 0.01 | −4.89 | 4.91 | 1.00 | −0.82 | −2.33 | 0.68 | 0.28 | |
| Some college / associate degree or below | 0.00 | 0.00 | ||||||||
| Stimulation Adherence | Yes | −4.59 | −16.17 | 6.99 | 0.43 | −0.35 | −2.61 | 1.91 | 0.76 | |
| No | 0.00 | 0.00 | ||||||||
| Cognitive Training Adherence | Yes | 3.28 | −5.05 | 11.61 | 0.43 | 0.60 | −1.58 | 2.77 | 0.59 | |
| No | 0.00 | 0.00 | ||||||||
| Baseline FCC | −0.25 | −0.52 | 0.03 | 0.08 | −0.26 | −0.33 | −0.18 | <0.01 | ||
Notes: CI = confidence interval, UF = University of Florida, UA = University of Arizona, FCC = Fluid Cognition Composite, T1 = baseline, T2 = post-intervention, T3 = one-year. Composite scores are fully-corrected T-scores.
*Significant at p < 0.05
Controlling for demographics, adherence, and baseline scores, tDCS group did not significantly predict changes in FCC from baseline to post-intervention in phase 1 or phase 2. Older age and higher baseline scores were associated with smaller baseline to post-intervention improvements in FCC for phase 2 (p-values < 0.001; Table A.3). Additionally, in the phase 2 sample, there is a significant effect of tDCS group on FCC change from baseline to one-year, such that the active group demonstrated a 1.57-point greater improvement compared to sham (p = 0.03; Table A.3). Female participants demonstrated greater baseline to one-year improvements in FCC compared to males, while higher baseline scores were associated with smaller baseline to one-year improvements.
Table A.4.
Intent-to-Treat Analyses with Imputed Data Compared to Analyses with Completed Cases
| Outcomes | tDCS Effect | Imputed by Regression | Completed Cases | ||||
|---|---|---|---|---|---|---|---|
| Est | Std Error | p | Est | Std Error | p | ||
| Phase I | |||||||
| FCC T2 – T1 Change | Active vs Sham | −2.61 | 2.28 | 0.26 | −2.76 | 2.71 | 0.32 |
| FCC T3 – T1 Change | Active vs Sham | −2.96 | 2.49 | 0.24 | −3.05 | 3.14 | 0.34 |
| Phase II | |||||||
| FCC T2 – T1 Change | Active vs Sham | 0.70 | 0.67 | 0.29 | 0.90 | 0.92 | 0.33 |
| FCC T3 – T1 Change | Active vs Sham | 1.57 | 0.7 | 0.03 | 1.72 | 1.08 | 0.11 |
| All Cognitive Training | |||||||
| FCC T2 – T1 Change | Active vs Sham | 0.33 | 0.63 | 0.60 | 0.36 | 0.84 | 0.67 |
| FCC T3 – T1 Change | Active vs Sham | 1.03 | 0.66 | 0.12 | 0.98 | 0.97 | 0.32 |
Notes: FCC = Fluid Cognition Composite, T1 = baseline, T2 = post-intervention, T3 = one-year. Composite scores are fully-corrected T-scores.
Table A.5.
Counts of Specific Body- and Cardiac-Related Adverse Events by Intervention Group.
| Preferred Term | Sham | Active | ||
|---|---|---|---|---|
| # of Participants | # of Events | # of Participants | # of Events | |
| Body | 30 | 37 | 17 | 28 |
| Anemia | 2 | 2 | 0 | 0 |
| Arthritis | 8 | 10 | 8 | 12 |
| Back pain (urgent care visit) | 1 | 1 | 2 | 2 |
| Bone spurs on knees | 0 | 0 | 1 | 1 |
| Breast Cancer | 1 | 1 | 0 | 0 |
| Broken bone in hand from fall | 0 | 0 | 1 | 1 |
| Broken wrist | 1 | 1 | 0 | 0 |
| COVID-19 | 2 | 2 | 0 | 0 |
| Chest pain caused by esophageal gastritis and hiatal hernia | 0 | 0 | 1 | 1 |
| Cut on head | 0 | 0 | 1 | 1 |
| Dehydration | 1 | 1 | 0 | 0 |
| Dizziness | 0 | 0 | 1 | 1 |
| Dysphagia | 1 | 1 | 0 | 0 |
| Fainting post blood draw unrelated to study | 1 | 1 | 0 | 0 |
| Fall | 0 | 0 | 1 | 1 |
| Heat Exhaustion | 1 | 1 | 0 | 0 |
| High Cholesterol | 7 | 7 | 3 | 3 |
| Hypothyroidism | 0 | 0 | 1 | 1 |
| Knee Pain | 0 | 0 | 1 | 1 |
| Low Iron | 1 | 1 | 0 | 0 |
| Mononucleosis | 1 | 1 | 0 | 0 |
| Nasal Drip | 1 | 1 | 0 | 0 |
| Nausea and Dizziness | 2 | 2 | 0 | 0 |
| Neck Injury from car accident | 0 | 0 | 1 | 1 |
| Oral surgery | 3 | 3 | 0 | 0 |
| Radio ablation | 0 | 0 | 1 | 1 |
| Sciatica | 1 | 1 | 0 | 0 |
| Varithena Ablation | 0 | 0 | 1 | 1 |
| Cardiac | 6 | 6 | 15 | 17 |
| Angina | 0 | 0 | 3 | 3 |
| Arrhythmia | 2 | 2 | 0 | 0 |
| Atrial Fibrillation | 0 | 0 | 1 | 1 |
| Chest Pain | 0 | 0 | 1 | 1 |
| Coronary artery disease | 0 | 0 | 1 | 1 |
| Heart Ablation | 1 | 1 | 0 | 0 |
| Heart Murmur | 1 | 1 | 0 | 0 |
| Heart palpitations | 0 | 0 | 1 | 1 |
| High Blood Pressure | 1 | 1 | 6 | 6 |
| Stents | 1 | 1 | 0 | 0 |
| Tachycardia | 0 | 0 | 2 | 3 |
| Thoracic Aortic Aneurysm | 0 | 0 | 1 | 1 |
Notes: On the rows labeled “body” and “cardiac”, “# of Participants” refers to the total number of participants reporting at least one adverse event. Some of these participants reported more than one adverse event, which is reflected in the counts of the subcategory rows; however, they were only counted once in the “body” and “cardiac” rows. “# of Events” refers to the total number of times a specific event was reported throughout the course of the study.
Footnotes
Declaration of Competing Interest
The authors report no conflicts of interest.
CRediT Authorship Contribution Statement
Hanna K Hausman: Conceptualization, Writing – original draft, Writing – review and editing. Gene E. Alexander: Conceptualization, Resources, Supervision, Project Administration. Ronald Cohen: Conceptualization, Project Administration, Funding Acquisition. Michael Marsiske: Conceptualization, Methodology, Project Administration, Funding Acquisition. Steven T. DeKosky: Conceptualization, Investigation. Georg A. Hishaw: Conceptualization, Investigation. Andrew O’Shea: Investigation, Data Curation, Supervision, Project administration, Writing – review and editing. Jessica N. Kraft: Investigation, Data Curation, Writing – review and editing. Yunfeng Dai: Formal Analysis, Data Curation, Visualization. Samuel Wu: Conceptualization, Methodology, Formal Analysis, Data Curation, Writing – original draft, Project Administration. Adam J Woods: Conceptualization, Investigation, Resources, Writing – review and editing, Project Administration, Funding Acquisition.
References
- [1].Ortman JM, Velkoff VA, Hogan H. An Aging Nation: The Older Population in the United States Population Estimates and Projections Current Population Reports. 2014.
- [2].Salthouse TA. Aging and measures of processing speed. Biol Psychol 2000;54:35–54. 10.1016/S0301-0511(00)00052-1. [DOI] [PubMed] [Google Scholar]
- [3].Salthouse TA. Selective review of cognitive aging. J Int Neuropsychol Soc 2010;16:754–60. 10.1017/S1355617710000706. [DOI] [PMC free article] [PubMed] [Google Scholar]
- [4].Murman DL. The Impact of Age on Cognition. Semin Hear 2015;36:111–21. 10.1055/s-0035-1555115. [DOI] [PMC free article] [PubMed] [Google Scholar]
- [5].Chen Y, Denny KG, Harvey D, Farias ST, Mungas D, DeCarli C, et al. Progression from normal cognition to mild cognitive impairment in a diverse clinic- and community-based elderly cohort. Alzheimers Dement 2017;13:399. 10.1016/J.JALZ.2016.07.151. [DOI] [PMC free article] [PubMed] [Google Scholar]
- [6].Farias ST, Chou E, Harvey DJ, Mungas D, Reed B, DeCarli C, et al. Longitudinal Trajectories of Everyday Function by Diagnostic Status. Psychol Aging 2013;28:1070. 10.1037/A0034069. [DOI] [PMC free article] [PubMed] [Google Scholar]
- [7].Lau KM, Parikh M, Harvey DJ, Huang C-J, Farias ST. Early Cognitively Based Functional Limitations Predict Loss of Independence in Instrumental Activities of Daily Living in Older Adults. J Int Neuropsychol Soc 2015;21:688–98. 10.1017/S1355617715000818. [DOI] [PMC free article] [PubMed] [Google Scholar]
- [8].Martin M, Clare L, Altgassen AM, Cameron MH, Zehnder F. Cognition-based interventions for healthy older people and people with mild cognitive impairment. Cochrane Database Syst Rev 2011. 10.1002/14651858.CD006220.PUB2/MEDIA/CDSR/CD006220/IMAGE_N/NCD006220-CMP-004-02.PNG. [DOI] [PubMed] [Google Scholar]
- [9].Kelly ME, Loughrey D, Lawlor BA, Robertson IH, Walsh C, Brennan S. The impact of cognitive training and mental stimulation on cognitive and everyday functioning of healthy older adults: A systematic review and meta-analysis. Ageing Res Rev 2014;15:28–43. 10.1016/J.ARR.2014.02.004. [DOI] [PubMed] [Google Scholar]
- [10].Ball K, Berch DB, Helmers KF, Jobe JB, Leveck MD, Marsiske M, et al. Effects of cognitive training interventions with older adults: A randomized controlled trial. J Am Med Assoc 2002;288:2271–81. 10.1001/jama.288.18.2271. [DOI] [PMC free article] [PubMed] [Google Scholar]
- [11].Rebok GW, Ball K, Guey LT, Jones RN, Kim HY, King JW, et al. Ten-year effects of the advanced cognitive training for independent and vital elderly cognitive training trial on cognition and everyday functioning in older adults. J Am Geriatr Soc 2014;62:16–24. 10.1111/jgs.12607. [DOI] [PMC free article] [PubMed] [Google Scholar]
- [12].Ball K, Edwards JD, Ross LA, McGwin G. Cognitive Training Decreases Motor Vehicle Collision Involvement Among Older Drivers. J Am Geriatr Soc 2010;58:2107. 10.1111/J.1532-5415.2010.03138.X. [DOI] [PMC free article] [PubMed] [Google Scholar]
- [13].Simons DJ, Boot WR, Charness N, Gathercole SE, Chabris CF, Hambrick DZ, et al. Do “Brain-Training” Programs Work?: Psychol Sci Public Interest 2016;17:103–86. 10.1177/1529100616661983. [DOI] [PubMed] [Google Scholar]
- [14].Nguyen L, Murphy K, Andrews G. Immediate and long-term efficacy of executive functions cognitive training in older adults: A systematic review and meta-analysis. Psychol Bull 2019;145:698–733. 10.1037/BUL0000196. [DOI] [PubMed] [Google Scholar]
- [15].Sala G, Aksayli ND, Tatlidil KS, Tatsumi T, Gondo Y, Gobet F. Near and Far Transfer in Cognitive Training: A Second-Order Meta-Analysis. Collabra Psychol 2019;5. 10.1525/COLLABRA.203. [DOI] [Google Scholar]
- [16].Jaeggi SM, Buschkuehl M, Jonides J, Perrig WJ. Improving fluid intelligence with training on working memory. Proc Natl Acad Sci 2008;105:6829–33. 10.1073/PNAS.0801268105. [DOI] [PMC free article] [PubMed] [Google Scholar]
- [17].Melby-Lervåg M, Redick TS, Hulme C. Working Memory Training Does Not Improve Performance on Measures of Intelligence or Other Measures of “Far Transfer”: Evidence From a Meta-Analytic Review. Perspect Psychol Sci 2016;11:512–34. 10.1177/1745691616635612. [DOI] [PMC free article] [PubMed] [Google Scholar]
- [18].Redick TS, Shipstead Z, Harrison TL, Hicks KL, Fried DE, Hambrick DZ, et al. No evidence of intelligence improvement after working memory training: A randomized, placebo-controlled study. J Exp Psychol Gen 2013;142:359–79. 10.1037/a0029082. [DOI] [PubMed] [Google Scholar]
- [19].Stagg CJ, Nitsche MA. Physiological Basis of Transcranial Direct Current Stimulation. Neurosci 2011;17:37–53. 10.1177/1073858410386614. [DOI] [PubMed] [Google Scholar]
- [20].Zheng X, Alsop DC, Schlaug G. Effects of transcranial direct current stimulation (tDCS) on human regional cerebral blood flow. Neuroimage 2011;58:26–33. 10.1016/j.neuroimage.2011.06.018. [DOI] [PMC free article] [PubMed] [Google Scholar]
- [21].Woods AJ, Antal A, Bikson M, Boggio PS, Brunoni AR, Celnik P, et al. A technical guide to tDCS, and related non-invasive brain stimulation tools. Clin Neurophysiol 2016;127:1031–48. 10.1016/j.clinph.2015.11.012. [DOI] [PMC free article] [PubMed] [Google Scholar]
- [22].Nitsche MA, Paulus W. Excitability changes induced in the human motor cortex by weak transcranial direct current stimulation. J Physiol 2000;527:633–9. 10.1111/j.1469-7793.2000.t01-1-00633.x. [DOI] [PMC free article] [PubMed] [Google Scholar]
- [23].Nitsche MA, Cohen LG, Wassermann EM, Priori A, Lang N, Antal A, et al. Transcranial direct current stimulation: State of the art. Brain Stimul 2008;1:206–23. 10.1016/j.brs.2008.06.004. [DOI] [PubMed] [Google Scholar]
- [24].Priori A Brain polarization in humans: A reappraisal of an old tool for prolonged non-invasive modulation of brain excitability. Clin Neurophysiol 2003;114:589–95. 10.1016/S1388-2457(02)00437-6. [DOI] [PubMed] [Google Scholar]
- [25].Nitsche MA, Paulus W. Sustained excitability elevations induced by transcranial DC motor cortex stimulation in humans. Neurology 2001;57:1899–901. 10.1212/WNL.57.10.1899. [DOI] [PubMed] [Google Scholar]
- [26].Stagg CJ, Lin RL, Mezue M, Segerdahl A, Kong Y, Xie J, et al. Widespread modulation of cerebral perfusion induced during and after transcranial direct current stimulation applied to the left dorsolateral prefrontal cortex. J Neurosci 2013;33:11425–31. 10.1523/JNEUROSCI.3887-12.2013. [DOI] [PMC free article] [PubMed] [Google Scholar]
- [27].Fritsch B, Reis J, Martinowich K, Schambra HM, Ji Y, Cohen LG, et al. Direct current stimulation promotes BDNF-dependent synaptic plasticity: Potential implications for motor learning. Neuron 2010;66:198–204. 10.1016/j.neuron.2010.03.035. [DOI] [PMC free article] [PubMed] [Google Scholar]
- [28].Rroji O, van Kuyck K, Nuttin B, Wenderoth N. Anodal tDCS over the Primary Motor Cortex Facilitates Long-Term Memory Formation Reflecting Use-Dependent Plasticity. PLoS One 2015;10:e0127270. 10.1371/journal.pone.0127270. [DOI] [PMC free article] [PubMed] [Google Scholar]
- [29].Pisoni A, Mattavelli G, Papagno C, Rosanova M, Casali AG, Lauro LJR. Cognitive enhancement induced by anodal tDCS drives circuit-specific cortical plasticity. Cereb Cortex 2018;28:1132–40. 10.1093/cercor/bhx021. [DOI] [PubMed] [Google Scholar]
- [30].Ruf SP, Fallgatter AJ, Plewnia C. Augmentation of working memory training by transcranial direct current stimulation (tDCS). Sci Rep 2017;7:1–11. 10.1038/s41598-017-01055-1. [DOI] [PMC free article] [PubMed] [Google Scholar]
- [31].Katz B, Au J, Buschkuehl M, Abagis T, Zabel C, Jaeggi SM, et al. Individual Differences and Long-term Consequences of tDCS-augmented Cognitive Training. J Cogn Neurosci 2017;29:1498–508. 10.1162/jocn_a_01115. [DOI] [PubMed] [Google Scholar]
- [32].Martin DM, Liu R, Alonzo A, Green M, Player MJ, Sachdev P, et al. Can transcranial direct current stimulation enhance outcomes from cognitive training? A randomized controlled trial in healthy participants. Int J Neuropsychopharmacol 2013;16:1927–36. 10.1017/S1461145713000539. [DOI] [PubMed] [Google Scholar]
- [33].Nissim NR, O’Shea A, Indahlastari A, Kraft JN, von Mering O, Aksu S, et al. Effects of Transcranial Direct Current Stimulation Paired With Cognitive Training on Functional Connectivity of the Working Memory Network in Older Adults. Front Aging Neurosci 2019;11. 10.3389/fnagi.2019.00340. [DOI] [PMC free article] [PubMed] [Google Scholar]
- [34].Park SH, Seo JH, Kim YH, Ko MH. Long-term effects of transcranial direct current stimulation combined with computer-assisted cognitive training in healthy older adults. Neuroreport 2014;25:122–6. 10.1097/WNR.0000000000000080. [DOI] [PubMed] [Google Scholar]
- [35].Stephens JA, Berryhill ME. Older Adults Improve on Everyday Tasks after Working Memory Training and Neurostimulation. Brain Stimul 2016;9:553–9. 10.1016/j.brs.2016.04.001. [DOI] [PMC free article] [PubMed] [Google Scholar]
- [36].Antonenko D, Külzow N, Sousa A, Prehn K, Grittner U, Flöel A. Neuronal and behavioral effects of multi-day brain stimulation and memory training. Neurobiol Aging 2018;61:245–54. 10.1016/j.neurobiolaging.2017.09.017. [DOI] [PubMed] [Google Scholar]
- [37].Nissim NR, O’Shea A, Indahlastari A, Telles R, Richards L, Porges E, et al. Effects of in-Scanner Bilateral Frontal tDCS on Functional Connectivity of the Working Memory Network in Older Adults. Front Aging Neurosci 2019;11:51. 10.3389/fnagi.2019.00051. [DOI] [PMC free article] [PubMed] [Google Scholar]
- [38].Boutzoukas EM, O’Shea A, Kraft JN, Hardcastle C, Evangelista ND, Hausman HK, et al. Higher white matter hyperintensity load adversely affects pre-post proximal cognitive training performance in healthy older adults. GeroScience 2022;44:1441. 10.1007/S11357-022-00538-Y. [DOI] [PMC free article] [PubMed] [Google Scholar]
- [39].Hardcastle C, Hausman HK, Kraft JN, Albizu A, O’Shea A, Boutzoukas EM, et al. Proximal improvement and higher-order resting state network change after multidomain cognitive training intervention in healthy older adults. GeroScience 2022;44:1011. 10.1007/S11357-022-00535-1. [DOI] [PMC free article] [PubMed] [Google Scholar]
- [40].Woods AJ, Cohen R, Marsiske M, Alexander GE, Czaja SJ, Wu S. Augmenting cognitive training in older adults (The ACT Study): Design and Methods of a Phase III tDCS and cognitive training trial. Contemp Clin Trials 2018;65:19–32. 10.1016/j.cct.2017.11.017. [DOI] [PMC free article] [PubMed] [Google Scholar]
- [41].Weintraub S, Salmon D, Mercaldo N, Ferris S, Graff-Radford NR, Chui H, et al. The Alzheimer’s Disease Centers’ Uniform Data Set (UDS): The neuropsychologic test battery. Alzheimer Dis Assoc Disord 2009;23:91–101. 10.1097/WAD.0b013e318191c7dd. [DOI] [PMC free article] [PubMed] [Google Scholar]
- [42].McLaren ME, Nissim NR, Woods AJ. The effects of medication use in transcranial direct current stimulation: A brief review. Brain Stimul 2018;11:52–8. 10.1016/j.brs.2017.10.006. [DOI] [PMC free article] [PubMed] [Google Scholar]
- [43].Weintraub S, Dikmen SS, Heaton RK, Tulsky DS, Zelazo PD, Bauer PJ, et al. Cognition assessment using the NIH Toolbox. Neurology 2013;80:S54–64. 10.1212/WNL.0b013e3182872ded. [DOI] [PMC free article] [PubMed] [Google Scholar]
- [44].Parsey CM, Bagger JE, Trittschuh EH, Hanson AJ. Utility of the iPad NIH Toolbox Cognition Battery in a Clinical Trial of Older Adults. J Am Geriatr Soc 2021;69:3519–28. 10.1111/JGS.17382. [DOI] [PMC free article] [PubMed] [Google Scholar]
- [45].Scott EP, Sorrell A, Benitez A. Psychometric Properties of the NIH Toolbox Cognition Battery in Healthy Older Adults: Reliability, Validity, and Agreement with Standard Neuropsychological Tests. J Int Neuropsychol Soc 2019;25:857. 10.1017/S1355617719000614. [DOI] [PMC free article] [PubMed] [Google Scholar]
- [46].Teixeira-Santos AC, Moreira CS, Pereira DR, Pinal D, Fregni F, Leite J, et al. Working Memory Training Coupled With Transcranial Direct Current Stimulation in Older Adults: A Randomized Controlled Experiment. Front Aging Neurosci 2022;14:242. 10.3389/FNAGI.2022.827188/BIBTEX. [DOI] [PMC free article] [PubMed] [Google Scholar]
- [47].Indahlastari A, Hardcastle C, Albizu A, Alvarez-Alvarado S, Boutzoukas EM, Evangelista ND, et al. A Systematic Review and Meta-Analysis of Transcranial Direct Current Stimulation to Remediate Age-Related Cognitive Decline in Healthy Older Adults. Neuropsychiatr Dis Treat 2021;17:971. 10.2147/NDT.S259499. [DOI] [PMC free article] [PubMed] [Google Scholar]
- [48].Nilsson J, Lebedev AV., Rydström A, Lövdén M. Direct-current stimulation does little to improve the outcome of working-memory training in older adults. Psychol Sci 2017;28:907. 10.1177/0956797617698139. [DOI] [PMC free article] [PubMed] [Google Scholar]
- [49].Raz N, Lindenberger U, Rodrigue KM, Kennedy KM, Head D, Williamson A, et al. Regional brain changes in aging healthy adults: General trends, individual differences and modifiers. Cereb Cortex 2005;15:1676–89. 10.1093/cercor/bhi044. [DOI] [PubMed] [Google Scholar]
- [50].Cabeza R Hemispheric asymmetry reduction in older adults: The HAROLD model. Psychol Aging 2002;17:85–100. 10.1037/0882-7974.17.1.85. [DOI] [PubMed] [Google Scholar]
- [51].Reuter-Lorenz PA, Park DC. How Does it STAC Up? Revisiting the Scaffolding Theory of Aging and Cognition. Neuropsychol Rev 2014;24:355–70. 10.1007/s11065-014-9270-9. [DOI] [PMC free article] [PubMed] [Google Scholar]
- [52].Kang JH, Choi SE, Park DJ, Xu H, Lee JK, Lee SS. Effects of add-on transcranial direct current stimulation on pain in Korean patients with fibromyalgia. Sci Rep 2020;10:1–8. 10.1038/s41598-020-69131-7. [DOI] [PMC free article] [PubMed] [Google Scholar]
- [53].Shariatirad S, Vaziri A, Hassani-Abharian P, Sharifi Fardshad M, Molavi N, Fitzgerald PB. Cumulative and booster effects of tdcs sessions on drug cravings, lapse, and cognitive impairment in methamphetamine use disorder: A case study report. Am J Addict 2016;25:264–6. 10.1111/AJAD.12373. [DOI] [PubMed] [Google Scholar]
- [54].Woods AJ, Bryant V, Sacchetti D, Gervits F, Hamilton R. Effects of electrode drift in transcranial direct current stimulation. Brain Stimul 2015;8:515–9. 10.1016/j.brs.2014.12.007. [DOI] [PMC free article] [PubMed] [Google Scholar]
- [55].Batsikadze G, Moliadze V, Paulus W, Kuo MF, Nitsche MA. Partially non-linear stimulation intensity-dependent effects of direct current stimulation on motor cortex excitability in humans. J Physiol 2013;591:1987–2000. 10.1113/JPHYSIOL.2012.249730. [DOI] [PMC free article] [PubMed] [Google Scholar]
- [56].Mosayebi Samani M, Agboada D, Jamil A, Kuo MF, Nitsche MA. Titrating the neuroplastic effects of cathodal transcranial direct current stimulation (tDCS) over the primary motor cortex. Cortex 2019;119:350–61. 10.1016/J.CORTEX.2019.04.016. [DOI] [PubMed] [Google Scholar]
- [57].Ghasemian-Shirvan E, Mosayebi-Samani M, Farnad L, Kuo MF, Meesen RLJ, Nitsche MA. Age-dependent non-linear neuroplastic effects of cathodal tDCS in the elderly population: a titration study. Brain Stimul 2022;15:296–305. 10.1016/j.brs.2022.01.011. [DOI] [PubMed] [Google Scholar]
- [58].Latikka J, Eskola H. The electrical conductivity of human cerebrospinal fluid in vivo. IFMBE Proc 2019;68:773–6. 10.1007/978-981-10-9035-6_142. [DOI] [Google Scholar]
- [59].Indahlastari A, Albizu A, O’Shea A, Forbes MA, Nissim NR, Kraft JN, et al. Modeling transcranial electrical stimulation in the aging brain. Brain Stimul 2020;13. 10.1016/j.brs.2020.02.007. [DOI] [PMC free article] [PubMed] [Google Scholar]
- [60].Ciechanski P, Carlson HL, Yu SS, Kirton A. Modeling transcranial direct-current stimulation-induced electric fields in children and adults. Front Hum Neurosci 2018;12:268. 10.3389/FNHUM.2018.00268/BIBTEX. [DOI] [PMC free article] [PubMed] [Google Scholar]
- [61].Indahlastari A, Albizu A, Boutzoukas EM, O’Shea A, Woods AJ. White matter hyperintensities affect transcranial electrical stimulation in the aging brain. Brain Stimul 2021;14:69–73. 10.1016/J.BRS.2020.11.009. [DOI] [PMC free article] [PubMed] [Google Scholar]
- [62].Truong DQ, Magerowski G, Blackburn GL, Bikson M, Alonso-Alonso M. Computational modeling of transcranial direct current stimulation (tDCS) in obesity: Impact of head fat and dose guidelines☆. Neuroimage (Amst) 2013;2:759–66. 10.1016/J.NICL.2013.05.011. [DOI] [PMC free article] [PubMed] [Google Scholar]
- [63].Albizu A, Fang R, Indahlastari A, O’Shea A, Stolte SE, See KB, et al. Machine learning and individual variability in electric field characteristics predict tDCS treatment response. Brain Stimul 2020;13:1753–64. 10.1016/J.BRS.2020.10.001. [DOI] [PMC free article] [PubMed] [Google Scholar]
- [64].Bhattacharjee S, Kashyap R, Goodwill AM, O’Brien BA, Rapp B, Oishi K, et al. Sex difference in tDCS current mediated by changes in cortical anatomy: A study across young, middle and older adults. Brain Stimul 2022;15:125–40. 10.1016/J.BRS.2021.11.018. [DOI] [PMC free article] [PubMed] [Google Scholar]
- [65].Smith GE, Housen P, Yaffe K, Ruff R, Kennison RF, Mahncke HW, et al. A Cognitive Training Program Based on Principles of Brain Plasticity: Results from the Improvement in Memory with Plasticity-based Adaptive Cognitive Training (IMPACT) Study. J Am Geriatr Soc 2009;57:594. 10.1111/J.1532-5415.2008.02167.X. [DOI] [PMC free article] [PubMed] [Google Scholar]
- [66].Zelinski EM, Spina LM, Yaffe K, Ruff R, Kennison RF, Mahncke HW, et al. Improvement in memory with plasticity-based adaptive cognitive training: results of the 3-month follow-up. J Am Geriatr Soc 2011;59:258–65. 10.1111/J.1532-5415.2010.03277.X. [DOI] [PubMed] [Google Scholar]
- [67].Gill J, Shah-Basak PP, Hamilton R. It’s the Thought That Counts: Examining the Task-dependent Effects of Transcranial Direct Current Stimulation on Executive Function. Brain Stimul 2015;8:253–9. 10.1016/J.BRS.2014.10.018. [DOI] [PubMed] [Google Scholar]
- [68].Zinke K, Zeintl M, Rose NS, Putzmann J, Pydde A, Kliegel M. Working memory training and transfer in older adults: effects of age, baseline performance, and training gains. Dev Psychol 2014;50:304–15. 10.1037/A0032982. [DOI] [PubMed] [Google Scholar]
- [69].Traut HJ, Guild RM, Munakata Y. Why Does Cognitive Training Yield Inconsistent Benefits? A Meta-Analysis of Individual Differences in Baseline Cognitive Abilities and Training Outcomes. Front Psychol 2021;12:1697. 10.3389/FPSYG.2021.662139/BIBTEX. [DOI] [PMC free article] [PubMed] [Google Scholar]
- [70].Shaw JS, Hosseini SMH. The Effect of Baseline Performance and Age on Cognitive Training Improvements in Older Adults: A Qualitative Review. J Prev Alzheimer’s Dis 2021;8:100–9. 10.14283/JPAD.2020.55. [DOI] [PMC free article] [PubMed] [Google Scholar]
- [71].Roheger M, Kalbe E, Corbett A, Brooker H, Ballard C. Lower cognitive baseline scores predict cognitive training success after 6 months in healthy older adults: Results of an online RCT. Int J Geriatr Psychiatry 2020;35:1000–8. 10.1002/GPS.5322. [DOI] [PubMed] [Google Scholar]
- [72].Lövdén M, Bäckman L, Lindenberger U, Schaefer S, Schmiedek F. A Theoretical Framework for the Study of Adult Cognitive Plasticity. Psychol Bull 2010;136:659–76. 10.1037/A0020080. [DOI] [PubMed] [Google Scholar]
- [73].Alzheimer’s Association. 2022 Alzheimer’s Disease Facts and Figures. Alzheimers Dement 2022. https://www.alz.org/media/Documents/alzheimers-facts-and-figures.pdf. [Google Scholar]
- [74].Power MC, Bennett EE, Turner RW, Dowling NM, Ciarleglio A, Glymour MM, et al. Trends in Relative Incidence and Prevalence of Dementia Across Non-Hispanic Black and White Individuals in the United States, 2000–2016. JAMA Neurol 2021;78:275–84. 10.1001/JAMANEUROL.2020.4471. [DOI] [PMC free article] [PubMed] [Google Scholar]
- [75].Demirovic J, Prineas R, Loewenstein D, Bean J, Duara R, Sevush S, et al. Prevalence of dementia in three ethnic groups: The South Florida program on aging and health. Ann Epidemiol 2003;13:472–8. 10.1016/S1047-2797(02)00437-4. [DOI] [PubMed] [Google Scholar]
- [76].Mehta KM, Yeo GW. Systematic review of dementia prevalence and incidence in United States race/ethnic populations. Alzheimers Dement 2017;13:72–83. 10.1016/J.JALZ.2016.06.2360. [DOI] [PubMed] [Google Scholar]
- [77].Plassman BL, Langa KM, Fisher GG, Heeringa SG, Weir DR, Ofstedal MB, et al. Prevalence of dementia in the United States: the aging, demographics, and memory study. Neuroepidemiology 2007;29:125–32. 10.1159/000109998. [DOI] [PMC free article] [PubMed] [Google Scholar]
- [78].Yaffe K, Falvey C, Harris TB, Newman A, Satterfield S, Koster A, et al. Effect of socioeconomic disparities on incidence of dementia among biracial older adults: prospective study. BMJ 2013;347. 10.1136/BMJ.F7051. [DOI] [PMC free article] [PubMed] [Google Scholar]
- [79].Glymour MM, Manly JJ. Lifecourse social conditions and racial and ethnic patterns of cognitive aging. Neuropsychol Rev 2008;18:223–54. 10.1007/S11065-008-9064-Z. [DOI] [PubMed] [Google Scholar]
- [80].Bailey ZD, Feldman JM, Bassett MT. How Structural Racism Works — Racist Policies as a Root Cause of U.S. Racial Health Inequities. N Engl J Med 2021;384:768–73. 10.1056/NEJMMS2025396/SUPPL_FILE/NEJMMS2025396_DISCLOSURES.PDF. [DOI] [PMC free article] [PubMed] [Google Scholar]