

Abstract
Background and Objectives
This prospective, longitudinal cohort study examined trajectories of brain gray matter macrostructure after pediatric mild traumatic brain injury (mTBI).
Methods
Children aged 8–16.99 years with mTBI or mild orthopedic injury (OI) were recruited from 5 pediatric emergency departments. Reliable change between preinjury and 1 month postinjury symptom ratings was used to classify mTBI with or without persistent symptoms. Children completed postacute (2–33 days) and/or chronic (3 or 6 months) postinjury T1-weighted MRI, from which macrostructural metrics were derived using automated segmentation. Linear mixed-effects models were used, with multiple comparisons correction.
Results
Groups (N = 623; 407 mTBI/216 OI; 59% male; age mean = 12.03, SD = 2.38 years) did not differ in total brain, white, or gray matter volumes or regional subcortical gray matter volumes. However, time postinjury, age at injury, and biological sex-moderated differences among symptom groups in cortical thickness of the angular gyrus, basal forebrain, calcarine cortex, gyrus rectus, medial and posterior orbital gyrus, and the subcallosal area all corrected p < 0.05. Gray matter macrostructural metrics did not differ between groups postacutely. However, cortical thinning emerged chronically after mTBI relative to OI in the angular gyrus in older children (d [95% confidence interval] = −0.61 [−1.15 to −0.08]); and in the basal forebrain (−0.47 [−0.94 to −0.01]), subcallosal area (−0.55 [−1.01 to −0.08]), and the posterior orbital gyrus (−0.55 [−1.02 to −0.08]) in females. Cortical thinning was demonstrated for frontal and occipital regions 3 months postinjury in males with mTBI with persistent symptoms vs without persistent symptoms (−0.80 [−1.55 to −0.05] to −0.83 [−1.56 to −0.10]) and 6 months postinjury in females and younger children with mTBI with persistent symptoms relative to mTBI without persistent symptoms and OI (−1.42 [−2.29 to −0.45] to −0.91 [−1.81 to −0.01]).
Discussion
These findings signal little diagnostic and prognostic utility of postacute gray matter macrostructure in pediatric mTBI. However, mTBI altered the typical course of cortical gray matter thinning up to 6 months postinjury, even after symptoms typically abate in most children. Collapsing across symptom status obscured the neurobiological heterogeneity of discrete clinical outcomes after pediatric mTBI. The results illustrate the need to examine neurobiology in relation to clinical outcomes and within a neurodevelopmental framework.
Introduction
Mild traumatic brain injury (mTBI i.e., concussion) is highly prevalent, affecting millions of children annually, and is characterized by subtle disruption of brain tissue.1,2 To date, no known objective imaging biomarker exists for accurate detection or prognostication in pediatric mTBI.2,3 This impedes clinical diagnosis and management.2 Advanced quantitative structural MRI techniques provide information about the macrostructure of cortical and subcortical gray matter (e.g., cortical thickness and subcortical volume) and could increase both scientific and clinical understanding of the neurobiology of pediatric mTBI.2 Despite mixed findings related to mTBI diagnosis, preliminary evidence suggests that postacute and chronic macrostructural measures may aid in prognostication.4,5 However, prospective longitudinal MRI studies of large, representative samples are needed to characterize the trajectories of brain tissue macrostructure after pediatric mTBI.2,5 Such studies have important scientific and clinical implications for determining both the diagnostic and prognostic utility of brain tissue macrostructure in pediatric mTBI.
Previous quantitative structural MRI research in pediatric mTBI is scarce and hampered by methodological shortcomings. Most studies were retrospective and/or cross-sectional and examined small samples (e.g., N ≤ 29) with restricted age ranges (e.g., 10–14 years) and biased sex ratios (e.g., 87% male), as previously reviewed.2 Nonetheless, mounting evidence indicates that pediatric mTBI can disrupt gray matter structure (thickness and volume) and that the trajectories of these changes could be dynamic across time postinjury.2,5 Cortical thickness has been studied most commonly, with abnormalities detected both postacutely (i.e., ≤1 month postinjury) and at later times (i.e., ≥3 months postinjury), although not in all studies.2,5 Studies of subcortical gray matter macrostructure in pediatric mTBI are scarcer, and findings are also inconsistent.2
In this prospective, longitudinal cohort study, we examined cortical and subcortical gray matter macrostructure in children with mTBI or mild orthopedic injury (OI). Symptoms of mTBI can differ in males and females, especially in adolescence,6 suggesting that the neurobiology of pediatric mTBI may differ by sex. Whether sex or age influences neurobiological outcomes after pediatric mTBI is largely unknown because existing studies tend to be heavily weighted to males and have sample sizes that are underpowered to examine moderation by sex or age at injury.7 Thus, we investigated sex and age at injury as possible moderators of group differences in gray matter macrostructure. Based on past research,5,8 minimal postacute (i.e., 1–2 weeks postinjury) differences in cortical thickness and subcortical volumes were expected between mTBI and mild OI groups while robust group differences were expected chronically (i.e., at 3 or 6 months postinjury). The largest differences in cortical thickness were expected in children with mTBI who demonstrated persistent symptoms (prolonged recovery) relative to children with mTBI without persistent symptoms (shorter recovery) or OI.
Methods
Study Design and Procedure
This study used data from the Advancing Concussion Assessment in Pediatrics (A-CAP) study, a prospective, concurrent cohort study of longitudinal outcomes in pediatric mTBI vs mild OI.3 The study recruited children (age 8–16.99 years) who were within 48 hours of sustaining an mTBI or OI from the emergency department (ED) of 5 children's hospitals that are members of the Pediatric Emergency Research Canada (PERC) network9: Alberta Children's Hospital (Calgary), British Columbia Children's Hospital (Vancouver), Centre Hospitalier Universitaire Sainte-Justine (Montreal), Children's Hospital of Eastern Ontario (Ottawa), and Stollery Children's Hospital (Edmonton).3 At each site, enrolled participants returned for a postacute assessment (i.e., targeted for 10 days postinjury; 2–33 days) and chronic assessments at 3 and 6 months postinjury. During the initial ED visit, acute clinical presentation was documented; mechanism of injury documentation and a demographic questionnaire were completed at the postacute follow-up.3
Standard Protocol Approvals, Registrations, and Patient Consents
At each study site, the research ethics board approved this study. Informed assent and informed consent were provided by all participants and their parents/guardians, respectively.
Data Availability
Deidentified participant data will be made available on reasonable request, subject to a signed data access agreement.
Participants
Mild TBI
Children in the mTBI group sustained a blunt head trauma resulting in at least 1 criteria, consistent with the World Health Organization (WHO) definition of mTBI10: “i) observed loss of consciousness, ii) Glasgow Coma Scale score of 13–14, or iii) at least 1 acute sign or symptom of concussion as noted by emergency department medical personnel on a standard case report form, including posttraumatic amnesia, focal neurologic deficits, vomiting, headache, dizziness, or other mental status changes. Children who demonstrated neurologic deterioration (e.g., Glasgow Coma Scale <13), required neurosurgical intervention, or had loss of consciousness >30 minutes or posttraumatic amnesia >24 hours were excluded.”3
Mild OI
Children with mild OI sustained an upper or lower extremity fracture, sprain, or strain due to blunt force trauma, associated with an Abbreviated Injury Scale (AIS) score ≤4.11 Children with head trauma, signs or symptoms of concussion at the time of recruitment, or any injury requiring surgical intervention or procedural sedation were excluded from the OI group.3
Exclusion Criteria
The following exclusion criteria applied to both groups: any injury with an AIS score >4; hypoxia, hypotension, or shock during or after the injury; a concussion within the preceding 3 months or any history of TBI requiring hospitalization; premorbid neurologic disorder or severe neurodevelopmental disability; injury resulting from nonaccidental trauma; severe psychiatric disorder requiring hospitalization within past year; or contraindications to MRI.3
Symptoms
Cognitive and somatic symptoms were measured using the Health and Behavior Inventory (HBI).12-14 Parents rated preinjury symptoms at the postacute visit, and parents and children rated postinjury symptoms weekly and at each follow-up visit.15 A reliable change index (i.e., z-score) was calculated between the total 1 month postinjury symptom scores and preinjury scores based on data from the OI group for child postinjury ratings.14 The formulas were as follows:
and parent postinjury ratings:
Based on the results, children with mTBI were classified into 2 groups using a critical z-score >1.65 (one-tailed p <0 .05): (1) mTBI with persistent symptoms (significant increase at 1 month postinjury relative to preinjury) and (2) mTBI without persistent symptoms (no significant increase at 1 month postinjury relative to preinjury).6,16
Structural MRI
All eligible participants (i.e., without MRI contraindications) completed an initial 3T MRI without sedation at the postacute assessment and were randomly assigned at that time to complete a second, chronic MRI at either the 3- or 6-month postinjury assessment. Participants included in this study successfully completed at least 1 3T MRI scan without sedation.
Data Acquisition
T1-weighted images were acquired with 0.8 mm isotropic resolution at all sites using FSPGR BRAVO TR/TE/TI = 7.9, 8.25/3.6/600 ms, 4:47 minutes (General Electric) or MPRAGE with TR/TE/TI = 1880, 2200/2.5, 2.9/948 ms, 5:28 minutes (Siemens).3
Quality Assurance
As detailed previously,17 initial visual quality assurance of raw images was conducted to identify and exclude scans that demonstrated structural abnormalities at the time of the scan, scanner artifact, incomplete acquisition, reduced FOV (i.e., cropped), or were not collected using the default scan parameters. Data that passed the initial quality checks were subsequently rated for motion by at least 2 trained analysts using a 0–2 ordinal scale, with “0” for gross artifacts, “1” for minor artifacts (i.e., acceptable), and “2” for images free from visible artifact (i.e., excellent). Only scans rated ≥1 were included in the current analyses.
Image Processing
Conversion of T1-weighted DICOM data to NIfTI format was conducted using the dcm2niix tool in MRIcron. T1-weighted images were resampled to 1 × 1 × 1 mm voxel resolution using the Convert3D Medical Image Processing Tool. Brain extraction was conducted, and total and regional brain volume and cortical thickness were derived using the open source Advanced Normalization Tools (ANTs) version 3.0.0.0.dev13-ga16cc (compiled January 18, 2019) volume-based cortical thickness estimation pipeline (antsCorticalThickness.sh; antsJointLabelFusion.sh), based on the OASIS pediatric template and priors from the MICCAI 2012 Multi Atlas Challenge.18,19 Thickness was estimated for 50 cortical regions, and volume was estimated for total brain, total white matter, and total gray matter in addition to 8 subcortical gray matter regions (eTable 1, links.lww.com/WNL/C922).
Metric Harmonization
Before statistical analysis, regional thickness and volume were harmonized for scanner differences by applying the ComBat package using R v4·0 3 in RStudio v1.1.383.20-22 Each unilateral brain region and metric (i.e., volume, thickness) was harmonized for scanner differences in separate models, without empirical Bayes (i.e., eb = FALSE). A matrix of biological covariates was included to preserve the effects of group, days postinjury, age at injury (mean centered), sex, and total brain volume (TBV) as fixed generalized additive mixed model predictors and participant as a random effect.22 Raw and harmonized brain metrics had good-to-excellent agreement, ICC ≥0.88 (mean = 0.99, SD = 0.01), within groups, assessment time, and each site. Final analyses were conducted using the harmonized cortical thickness and subcortical gray matter volume.
Statistical Analysis
Statistical analyses were computed using R v4·0 3 in RStudio v1.1.383.20,21 Sample sociodemographic and injury data were analyzed using t test and χ2 techniques for continuous and categorical variables, respectively.
The statistical analysis plan was similar to that of our previous study of white matter microstructure.23 Specifically, multiple linear mixed-effects models were computed using the lmerTest package in RStudio to investigate the relations of group (mTBI, OI), the linear and quadratic effects of time (days) postinjury (continuous, not centered), age at injury (continuous, centered), sex, and three-way interactions of group by time by age and group by time by sex and their lower order interactions on harmonized macrostructural values of each examined gray matter region separately, controlling for hemisphere, TBV, and the random effect of participant.20,21,24,25 In preliminary analyses, group differences were not moderated by hemisphere, which was therefore included only as a model covariate in final models; site (scanner) also was not a significant covariate after harmonization. TBV was included as a model covariate to account for individual differences in brain volumes.26 This statistical approach was repeated to compare gray matter metrics among symptom status groups (i.e., mTBI with persistent symptoms, mTBI without persistent symptoms, and OI). The final lmer() model formula was
 |
The false discovery rate (FDR) was applied for multiple comparisons correction (50 cortical and 7 subcortical regions).27 For significant effects involving group (corrected p < 0.05 for injury group; corrected p < 0.025 for symptom groups based on parent or child report), follow-up analyses were conducted within the context of the final model to assess the standardized effect size of group differences, using model estimates to compute Cohen d, with |0.20| ≤ d < |0.50|, |0.50| ≤ d < |0.80|, and d ≥ |0.80| defined as small, medium, and large effect sizes, respectively.28 Specifically, group (i.e., injury group or symptom groups) differences were examined at 10, 95, and 185 days postinjury (i.e., mean day postinjury of the postacute, 3 months, and 6 months assessment) for interactions involving time postinjury; at the 10th and 90th quantiles of age for interactions involving age at injury; and in males and females for interactions involving sex. Post hoc pairwise comparisons were not corrected for multiple comparisons because of the conservative criteria used for omnibus tests. However, the 95% confidence intervals (CI) of Cohen d were used to determine the robustness of group differences, which were considered robust when the 95% CI for d did not include 0; only those effects are described below.
Results
Sample
Overall, of 3,075 eligible children, 967 consented to participate, and 846 returned for at least 1 assessment (see Figure 1). Overall A-CAP study attrition rates were similar to other pediatric mTBI studies (postacute: 15%; 3 months: 25%; 6 months: 28%).29 Children who returned at follow-ups did not differ significantly from those who did not return in age, sex, race, or parental education, except at 6 months, when the children who returned had higher parental education than those who did not return. Children who returned were scheduled for a postacute MRI and randomly assigned for a second, chronic MRI at either the 3 or 6 months postinjury. Of them, a total of 671 (79%) children completed at least 1 MRI, for a total of 1,144 scans. The most common reasons that MRI was not completed were orthodontia and scheduling difficulties. Relative to children who did not complete an MRI (age M = 13–29, SD = 2.37 years; 88 male/90 female), children who completed an MRI did not differ in race and parental education but were slightly younger (M = 12.23, SD = 2.38 years; t = 5.29, p < 0.001) and more often male (402 male/266 female; χ2 = 6.22, p = 0.013). After quality checks, 1003 T1-weighted images were considered usable; 141 (12.3%; 106 mTBI/35 OI) T1-weighted images were excluded because of severe motion artifacts (9.7%; 86 mTBI/25 OI), incomplete acquisition (1.2%; 12 mTBI/2 OI), scanner artifacts (0.7%; 6 mTBI/2 OI), nontrauma-related incidental findings (0.5%; 2 mTBI/4 OI; e.g., temporal cyst, ventromegaly, hypoplastic corpus callosum), reduced FOV (<0.01%; 1 OI), or wrong acquisition parameters (<0.01%; 1 OI). An additional 8 (0.7%; mTBI/OI = 6/2) T1-weighted images failed the ANTs processing pipeline.
Figure 1. Summary of the Current Study Sample.

Overall, of 3,075 eligible children, 967 consented to participate, and 846 returned for at least 1 assessment. The study aimed to have all children complete a postacute MRI and a second, chronic MRI at 3 or 6 months postinjury, with the timing of chronic scans randomly assigned at the postacute assessment. A total of 671 children completed at least 1 MRI. After excluding 141 (12.3%; 106 mTBI/35 OI) T1-weighted scans during quality checks, 1003 T1-weighted images were considered usable. An additional 8 (0.7%; mTBI/OI = 6/2) T1-weighted scans failed the ANTs processing pipeline. Thus, final analyses were based on data from 995 (87.0% if the original 1,144) T1-weighted scans in 623 children (407 mTBI/216 OI; see Table 1). Of the 541 children who completed a high-quality postacute scan, 372 (69%) also completed a chronic scan at 3 or 6 months postinjury (i.e., completed 2 high-quality scans; see eTable 2, links.lww.com/WNL/C922), and a subset completed only 1 high-quality scan (postacute/chronic = 169/82). ANTs = advanced normalization tools.
Thus, final analyses were based on data from 995 T1-weighted images (87.0% of the original 1,144) in 623 children (407 mTBI/216 OI; see Figure 1). There were 541 children who completed a high-quality postacute scan and 454 (73%) children who completed a high-quality chronic scan. Longitudinal data was available for 372 (69%) children who completed high-quality scans both postacutely and chronically, with cross-sectional data available for a subset of children who completed only 1 high-quality scan at the postacute (n = 169) or chronic (n = 82) assessment.
Children who completed a high-quality chronic scan 3 months postinjury (mTBI/OI = 146/71) did not differ from those who completed one 6 months postinjury (mTBI/OI = 146/91) in age, sex, parental education, race, mechanism of injury, whether the injury was sport-related, preinjury, or postacute symptoms, parent symptom ratings of persistent symptoms 1 month postinjury, or motion rating (see eTable 2, links.lww.com/WNL/C922). However, children who completed an MRI 3 months postinjury reported greater symptoms 1 month postinjury and were more likely to have persistent symptoms 1 month postinjury based on child report relative to those who completed an MRI at 6 months postinjury.
Injury Groups
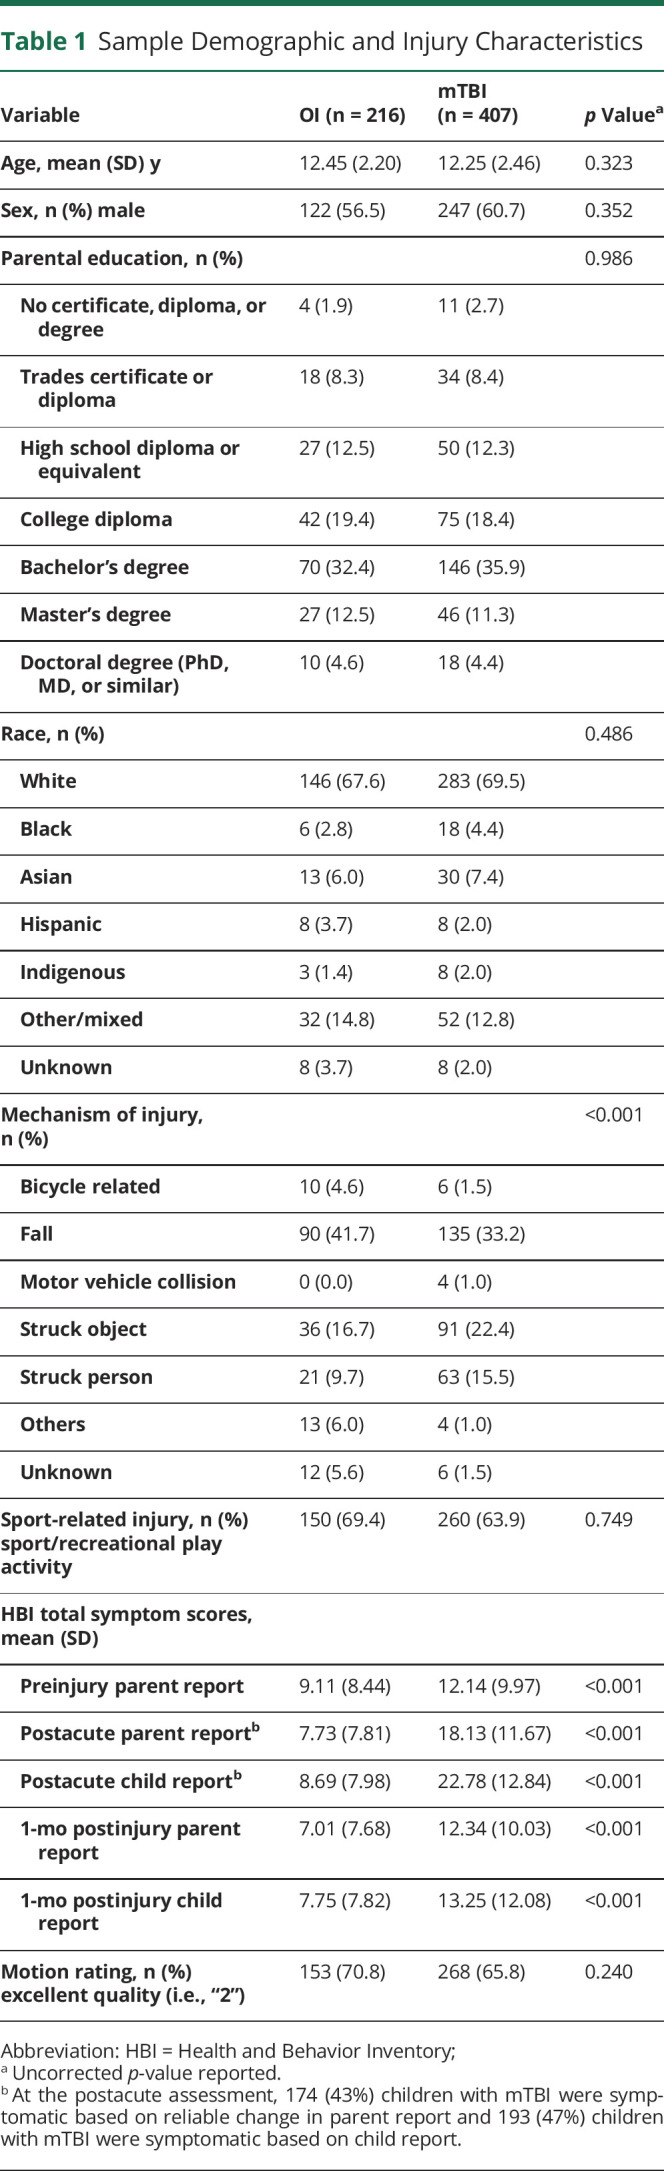
Children with mTBI and OI did not differ in age, sex, race, parental education, days postinjury for any MRI scans, motion rating, or whether the injury occurred during sport/recreational activity, but did differ in mechanism of injury (see Table 1).
Table 1.
Sample Demographic and Injury Characteristics
Gray Matter Macrostructure
Total brain, white, and gray matter volumes did not differ in mTBI relative to OI. Groups also did not differ in subcortical volume for any of the examined regions.
The model results for cortical thickness are summarized in Figure 2 (for estimated marginal means and follow-up statistics, see eFigure 1, eFigure 2, and eTable 3, links.lww.com/WNL/C922). Robust differences (i.e., FDR corrected p < 0.05; Cohen d CI did not include 0) between the injury groups for cortical thickness were apparent in several regions. Specifically, time postinjury and age at injury moderated group differences in thickness of the angular gyrus, which at 3 months postinjury was greater after mTBI relative to OI in younger children, but lower after mTBI in older children (Figure 3). Time postinjury and biological sex moderated group differences in thickness of the posterior orbital gyrus, subcallosal area, and basal forebrain, which all demonstrated reduced thickness 6 months after mTBI relative to OI in females (Figure 3).
Figure 2. Summary of Linear Mixed-Effects Model Results for Regional Cortical Thickness With Robust (i.e., FDR Corrected) Group Differences.

Three-way interactions between group, time postinjury, and age at injury (top) and between group, time, and sex (bottom) were observed for thickness in several cortical regions (indicated by color; see legend). Time and age moderated differences between the injury groups (i.e., TBI-OI; indicated by circles) for the angular gyrus and among the symptom groups based on parent (indicated by squares) and child (indicated by triangles) report for the calcarine cortex. Time and sex moderated differences between the injury groups for the posterior orbital gyrus, basal forebrain, and subcallosal area and among symptom groups based on parent report for the medial orbital gyrus, basal forebrain, calcarine cortex, gyrus rectus, and subcallosal area. Group comparisons are shown in Figure 3.
Figure 3. Group Differences in Regional Cortical Thickness Were Moderated by Time Postinjury, Age at Injury, and Biological Sex.

Graphs illustrate robust differences in cortical thickness (mm) between the groups (i.e., Cohen d 95% confidence interval excluded 0), as denoted by *. For each effect, brain regions that showed the illustrated pattern between the groups are shown in the brain image insets for each graph (see Figure 2 legend).
Persistent Symptom Groups
The demographic and injury characteristics of children with mTBI with and without persistent symptoms based on child and parent ratings are reported in eTable 4 (links.lww.com/WNL/C922). The symptom groups did not differ in race, motion rating, mechanism of injury, or injury setting (i.e., sport-related injury), but did differ in age at injury, sex, and parental education. For children with mTBI, those with persistent symptoms were older at time of injury, more likely to be female, and had parents with a higher proportion of advanced education relative to those without persistent symptoms.
The results for differences among symptom groups based on parent and child report are summarized in Figure 2 (for estimated marginal means and follow-up statistics, see eFigure 1, eFigure 2, and eTable 5, links.lww.com/WNL/C922).
Gray Matter Macrostructure
Total brain, white, and gray matter volumes did not differ among the symptom groups based on parent or child report. Symptom groups also did not differ in subcortical volume for any region.
Group differences in cortical thickness were moderated by interactions of time postinjury with age at injury and with sex (see Figure 3). Time postinjury and age at injury moderated calcarine fissure thickness differences among symptom groups based on both child and parent report, indicating that thickness was greater in mTBI without persistent symptoms relative both to OI and to mTBI with persistent symptoms in younger children, but was lower in mTBI without persistent symptoms relative to OI and mTBI with persistent symptoms in older children at 6 months postinjury. Time postinjury and biological sex moderated thickness differences among symptom groups based on parent report only for several regions. Specifically, thickness of the basal forebrain, medial orbital frontal gyrus, and subcallosal area were reduced 3 months postinjury in mTBI with persistent symptoms relative to mTBI without persistent symptoms, and thickness of the medial orbital frontal gyrus was increased in mTBI without persistent symptoms relative to OI 6 months postinjury in males. In females, thickness was reduced 6 months postinjury in mTBI with persistent symptoms for the basal forebrain and subcallosal area relative to mTBI without persistent symptoms and OI and for the gyrus rectus and medial orbital frontal gyrus relative to OI; the calcarine cortex was thinner 6 months postinjury in mTBI without persistent symptoms relative to OI.
Discussion
In this large, multisite study of pediatric mTBI, youth with pediatric mTBI had gray matter alterations in several cortical brain regions relative to youth with mild OI; alterations were moderated by symptom status at 1 month postinjury, time postinjury, biological sex, and age at injury. This is the first prospective longitudinal study to date to compare gray matter macrostructure in children with and without persistent symptoms as compared with mild OI. Postacute gray matter macrostructure did not distinguish the injury groups or predict symptom persistence 1 month after mTBI, indicating little diagnostic or prognostic utility of postacute gray matter macrostructural metrics in pediatric mTBI.5 Instead, longitudinal gray matter macrostructural changes emerged over time (i.e., between postacute and chronic periods) after mTBI, suggesting that mTBI can alter the typical course of cortical gray matter thinning30,31 up to 6 months later and that neurobiological changes can occur even after symptoms abate in most children.32 These results also indicate that collapsing across symptom status can obscure the neurobiological differences associated with discrete clinical outcomes in pediatric mTBI, consistent with diffusion imaging findings we previously reported in this sample23 and with a recent independent study of pediatric mTBI relative to typical development.8 Specifically, a less favorable clinical outcome (i.e., mTBI with persistent symptoms) was associated with cortical atrophy up to 6 months postinjury, although age at injury and biological sex moderated the differences in trajectories between the symptom groups.
Across symptom groups, younger children with mTBI demonstrated thicker cortex, whereas older children and women demonstrated thinner cortex in chronic periods. This aligns with some33 but not all previous studies.4,34 Excess thinning has been reported in several cortical regions in all 4 lobes of the brain in chronic mTBI relative to uninjured, typically developing children in cross-sectional4 and longitudinal35 studies of small samples (i.e., N ≤ 15), suggesting that pediatric mTBI can cause subtle and diffuse cortical atrophy that both emerges and persists several months postinjury.35 Persistent reduction of right rostral middle frontal cortical thickness and hippocampal volume were recently demonstrated postacutely and up to 4 months after pediatric mTBI relative to typical development in a larger sample (N = 384).8 However, cortical thickness did not differ 6 months after pediatric mTBI relative to OI in another large (N = 330) cohort of children.34 Discrepancies in findings likely reflect the use of different comparison groups, given the growing evidence that an OI comparison group provides a more conservative basis for comparisons in pediatric mTBI research than uninjured, typically developing children.17,36,37 Inconsistencies could also reflect methodological differences across known studies (e.g., age ranges, postinjury time, sex ratios, acquisition parameters, etc).2
Typical cortical gray matter structure and development is highly complex38; initial cortical thickening is followed by cortical thinning of frontotemporal regions, which could reflect increasing synaptic pruning and myelination.26 Numerous microstructural features could be affected by pediatric mTBI and subsequently influence brain tissue volume (e.g., dendrites, vasculature, and intracortical white matter).39 Increased cortical thickness could reflect swelling and cellular responses to injury, including both physical (primary) and pathophysiologic (secondary and downstream) effects of mTBI. By contrast, cortical atrophy (i.e., reduced thickness) could reflect interrelated physical (primary) and pathophysiologic (secondary) processes that occur at the time of injury because of the biomechanical forces (e.g., straining and shearing) that affect both gray and white matter in mTBI. Brain development seems to occur earlier in females than in males40 and therefore age-related and sex-related differences in cortical thickness after pediatric mTBI could relate to changes in plasticity that occur across development, whereby more mature brain tissue shows less plasticity than brain tissue that is less developed.41 Hormonal changes and differences could also contribute to the age-related and sex-related effects,42 but more research is needed, especially considering that the moderating effects of age at injury have been consistently demonstrated.8 However, the strong association of cortical macrostructure with age at injury and sex could also reflect accelerated developmental maturation of gray matter after mTBI rather than a specific neuropathology. Thus, cortical alterations after pediatric mTBI likely reflect a combination of focal and diffuse effects that must be considered within the context of typical brain development.
Our results further suggest that cortical changes are related to clinical outcomes after mTBI in children, but also differ by sex and age at injury. Cortical atrophy in regions of the inferior frontal cortex was demonstrated chronically in children who had poor recovery after mTBI (i.e., with persistent symptoms), but occurred earlier in males than females. Previous research found that cortical atrophy in inferior frontal regions related to worse symptoms in chronic pediatric mTBI.4,34 Interestingly, children with good recovery after mTBI (i.e., without persistent symptoms) also demonstrated chronic postinjury changes in the calcarine cortex that were moderated by age and sex. Specifically, thickness at 6 months postinjury was increased for younger children and males, but decreased in older children and females, who had demonstrated good recovery 1 month postinjury. This suggests that changes in cortical thickness occurred up to 6 months after mTBI even in children who were not persistently symptomatic, consistent with previous results.32
Consistent with the subtle and diffuse nature of mTBI, gray matter macrostructure was not grossly altered after mTBI in children.2 TBV and subcortical volumes did not differ between the groups in this study, consistent with some34 but not all previous research.2,35,43 Instead, most alterations were seen within regions of the inferior frontal cortex, with posterior disruptions restricted to the angular gyrus and calcarine cortex. The inferior frontal cortex is especially vulnerable to the mechanical effects of trauma because of skull and brain anatomy in that region, and alterations in brain morphology within those regions are common in pediatric mTBI.44,45 The properties of the applied force (e.g., direction and magnitude) and the microstructural properties of discrete brain regions can also influence changes in brain tissue differently among cortical gray matter and subcortical white and gray matter.46 In this sample, we previously showed increased mean diffusivity after mTBI, possibly indicative of edema, in the anterior thalamic radiations, arcuate fasciculus, and superior longitudinal fasciculus, which are all white matter pathways that connect prefrontal cortical, parietal, limbic, and thalamic regions.23,47 Additional research is needed to investigate whether the currently demonstrated alterations in cortical thickness and underlying white matter microstructure are related.
Participants were recruited from emergency departments and may not be representative of children who do not seek care or who are seen in other clinical settings, for example, primary care. Children in the study were mostly White and of higher socioeconomic status, so the findings may not generalize to the broader population. Despite our rigorous image quality assurance, motion artifacts can complicate pediatric MRI research,17,48 although we recently showed that motion artifact was similar in pediatric mTBI and OI groups in a subset of this sample,17 suggesting that current results are not likely biased by motion artifacts. Premorbid symptoms were retrospectively rated by parents at the postacute assessment, introducing possible recall bias.49 We previously reported modest agreement (ICC 0.28–0.69) between parent and child ratings on the HBI in a large, combined sample of children with OI.14 We cannot be sure how parent-child agreement influences the current findings. There is no evidence to suggest that one report is more/less valid than the other. Although preinjury ratings by parents of children in the OI group correlate more strongly with their own postinjury ratings than with their children's postinjury ratings, the latter correlation is still significant, suggesting that the parent ratings do capture meaningful differences in children's preinjury status. The primary implication of using parent ratings of preinjury symptoms for determination of reliable change is that the standard error of the estimate is larger for children's ratings than for parent's ratings, suggesting that the classification of reliable change (i.e., symptomatic status) is somewhat less precise for children's ratings than for parent's ratings. Finally, we examined persistent symptom status as a binary outcome at a single time point and did not account for specific symptoms or symptom patterns in pediatric mTBI or any change in symptom status across time. Future research examining specific symptom types and patterns over time is needed to better understand the relationship between neurobiological and clinical outcomes in pediatric mTBI.6
Cortical thickness alterations were detected chronically, suggesting that dynamic trajectories of change in gray matter macrostructure persisted up to 6 months after pediatric mTBI and were moderated by time postinjury, biological sex, age at injury, and symptom persistence.2,5 However, although metrics distinguished mTBI from OI in chronic postinjury periods, the generally small-to-moderate effect sizes, limited number of regions with differences, and moderation of effects by age at injury and biological sex suggest limited prospect for using gray matter macrostructure to distinguish mTBI from OI in individual patients. Overall, our results highlight the importance of contextualizing pediatric mTBI within a neurodevelopmental framework with particular emphasis on time postinjury, biological sex, age at injury, and symptom persistence.
Glossary
- A-CAP
Advancing Concussion Assessment in Pediatrics
- AIS
Abbreviated Injury Scale
- ANTs
Advanced Normalization Tools
- ED
emergency department
- FDR
false discovery rate
- mTBI
mild traumatic brain injury
- OI
orthopedic injury
- PERC
Pediatric Emergency Research Canada
- TBV
total brain volume
Appendix 1. Authors
Appendix 2. Authors
Study Funding
Funding provided by the Canadian Institutes of Health Research (FDN143304), Ronald and Irene Ward Chair in Pediatric Brain Injury (K.O.Y.); Canada Research Chair (C.L.); Harley N. Hotchkiss-Samuel Weiss and Killam Postdoctoral Fellowship (A.L.W.); Alberta Children's Hospital Foundation Professorship in Child Health and Wellness (S.B.F.).
Disclosure
A. L. Ware, A. Onicas, C. Lebel, N. Abdeen, M. H. Beauchamp, C. Beaulieu, B. Bjornson, W. Craig, M. Dehaes, Q. Doan, S. Deschenes, S. B. Freedman, B. G. Goodyear, J. Gravel and A.-A. Ledoux report no disclosures relevant to the manuscript; R. Zemek has received competitively funded research grants from Canadian Institutes of Health Research (CIHR), Ontario Neurotrauma Foundation (ONF), Physician Services Incorporated (PSI) Foundation, CHEO Foundation, Ontario Brain Institute (OBI), and Ontario SPOR Support Unit (OSSU), and the National Football League (NFL) Scientific Advisory Board. R. Zemek holds a Clinical Research Chair in Pediatric Concussion from University of Ottawa, and is the co-founder, Scientific Director, and a minority shareholder in 360 Concussion Care, an interdisciplinary concussion clinic; K.O. Yeates reports no disclosures relevant to the manuscript. Go to Neurology.org/N for full disclosures.
References
- 1.Gilchrist J, Thomas K, Xu L, McGuire LC, Coronado VG. Nonfatal traumatic brain injuries related to sports and recreation activities among persons aged ≤19 years—United States, 2001–2009. MMWR Morb Mortal Wkly Rep. 2011;60:1337-1342. [PubMed] [Google Scholar]
- 2.Mayer AR, Kaushal M, Dodd AB, et al. Advanced biomarkers of pediatric mild traumatic brain injury: progress and perils. Neurosci Biobehavioral Rev. 2018;94:149-165. doi: 10.1016/j.neubiorev.2018.08.002 [DOI] [PMC free article] [PubMed] [Google Scholar]
- 3.Yeates KO, Beauchamp M, Craig W, et al. Advancing Concussion Assessment in Pediatrics (A-CAP): a prospective, concurrent cohort, longitudinal study of mild traumatic brain injury in children: study protocol. BMJ Open. 2017;7:e017012. doi: 10.1136/bmjopen-2017-017012 [DOI] [PMC free article] [PubMed] [Google Scholar]
- 4.Urban KJ, Riggs L, Wells GD, et al. Cortical thickness changes and their relationship to dual-task performance following mild traumatic brain injury in youth. J Neurotrauma. 2017;34(4):816-823. doi: 10.1089/neu.2016.4502 [DOI] [PubMed] [Google Scholar]
- 5.Ware AL, Goodrich-Hunsaker NJ, Lebel C, et al. Post-acute cortical thickness in children with mild traumatic brain injury versus orthopedic injury. J Neurotrauma. 2020;37(17):1892-1901. doi: 10.1089/neu.2019.6850 [DOI] [PMC free article] [PubMed] [Google Scholar]
- 6.Ledoux A-A, Tang K, Yeates KO, et al. Natural progression of symptom change and recovery from concussion in a pediatric population. JAMA Pediatr. 2019;173(1):e183820. doi: 10.1001/jamapediatrics.2018.3820 [DOI] [PMC free article] [PubMed] [Google Scholar]
- 7.Guenette JP, Shenton ME, Koerte IK. Imaging of concussion in young athletes. Neuroimaging Clin N Am. 2018;28(1):43-53. [DOI] [PMC free article] [PubMed] [Google Scholar]
- 8.Mayer AR, Meier TB, Dodd AB, et al. Prospective study of gray matter atrophy following pediatric mild traumatic brain injury. Neurology. 2023;100(5):e516–e527. doi: 10.1212/wnl.0000000000201470 [DOI] [PMC free article] [PubMed] [Google Scholar]
- 9.Bialy L, Plint A, Zemek R, et al. Pediatric emergency research Canada: origins and evolution. Pediatr Emerg Care. 2018;34(2):138-144. doi: 10.1097/pec.0000000000001360 [DOI] [PubMed] [Google Scholar]
- 10.Carroll L, Cassidy JD, Holm L, Kraus J, Coronado V. Methodological issues and research recommendations for mild traumatic brain injury: the who collaborating centre task force on mild traumatic brain injury. J Rehabil Med. 2004;36:113-125. doi: 10.1080/16501960410023877 [DOI] [PubMed] [Google Scholar]
- 11.Committee on Injury Scaling. Abbreviated Injury Scale. Association for the Advancement of Automotive Medicine; 1998. [Google Scholar]
- 12.Adelson PD, Pineda J, Bell MJ, et al. Common data elements for pediatric traumatic brain injury: recommendations from the working group on demographics and clinical assessment. J Neurotrauma. 2012;29(4):639-653. doi: 10.1089/neu.2011.1952 [DOI] [PMC free article] [PubMed] [Google Scholar]
- 13.McCauley SR, Wilde EA, Anderson VA, et al. Recommendations for the use of common outcome measures in pediatric traumatic brain injury research. J Neurotrauma. 2012;29(4):678-705. doi: 10.1089/neu.2011.1838 [DOI] [PMC free article] [PubMed] [Google Scholar]
- 14.O'Brien H, Minich NM, Langevin LM, et al. Normative and psychometric characteristics of the health and behavior inventory among children with mild orthopedic injury presenting to the emergency department: implications for assessing postconcussive symptoms using the child sport concussion assessment tool 5th edition (Child SCAT5). Clin J Sport Med. 2021;31(5):e221-e228. doi: 10.1097/jsm.0000000000000943 [DOI] [PMC free article] [PubMed] [Google Scholar]
- 15.Ayr LK, Yeates KO, Taylor HG, Browne M. Dimensions of postconcussive symptoms in children with mild traumatic brain injuries. J Int Neuropsychol Soc. 2009;15(1):19-30. doi: 10.1017/s1355617708090188 [DOI] [PMC free article] [PubMed] [Google Scholar]
- 16.Mayer AR, Stephenson DD, Dodd AB, et al. Comparison of methods for classifying persistent post-concussive symptoms in children. J Neurotrauma. 2020;37(13):1504-1511. doi: 10.1089/neu.2019.6805 [DOI] [PMC free article] [PubMed] [Google Scholar]
- 17.Ware AL, Shukla A, Guo S, et al. Participant factors that contribute to magnetic resonance imaging motion artifacts in children with mild traumatic brain injury or orthopedic injury. Brain Imaging Behav. 2022;16(3):991-1002. doi: 10.1007/s11682-021-00582-w. [DOI] [PubMed] [Google Scholar]
- 18.Avants BB, Tustison N, Song G. Advanced Normalization Tools (ANTS):35. https://gaetanbelhomme.files.wordpress.com/2016/08/ants2.pdf
- 19.Tustison NJ, Cook PA, Klein A, et al. Large-scale evaluation of ANTs and FreeSurfer cortical thickness measurements. NeuroImage 2014;99:166-179. doi: 10.1016/j.neuroimage.2014.05.044 [DOI] [PubMed] [Google Scholar]
- 20.RStudio Team. RStudio: Integrated Development for R. RStudio, PBC; 2020. rstudio.com/ [Google Scholar]
- 21.R Core Team. R. A Language and Environment for Statistical Computing. R Foundation for Statistical Computing; 2017. R-project.org/ [Google Scholar]
- 22.Fortin J-P, Cullen N, Sheline YI, et al. Harmonization of cortical thickness measurements across scanners and sites. Neuroimage. 2018;167:104-120. doi: 10.1016/j.neuroimage.2017.11.024 [DOI] [PMC free article] [PubMed] [Google Scholar]
- 23.Ware AL, Yeates KO, Tang K, et al. Longitudinal white matter microstructural changes in pediatric mild traumatic brain injury: an A‐CAP study. Hum Brain Mapp. 2022;43(12):3809-3823. doi: 10.1002/hbm.25885 [DOI] [PMC free article] [PubMed] [Google Scholar]
- 24.Kuznetsova A, Brockhoff PB, Christensen RHB. lmerTest Package: tests in linear mixed effects models. J Stat Softw. 2017;82(13). doi: 10.18637/jss.v082.i13. Accessed August 19, 2019. jstatsoft.org/v82/i13/ [DOI] [Google Scholar]
- 25.Bates D, Mächler M, Bolker B, Walker S. Fitting linear mixed-effects models using lme4. J Stat Softw. 2015;67(1). doi: 10.18637/jss.v067.i01. Accessed August 20, 2019. jstatsoft.org/v67/i01/ [DOI] [Google Scholar]
- 26.Ducharme S, Albaugh MD, Nguyen T-V, et al. Trajectories of cortical thickness maturation in normal brain development—the importance of quality control procedures. Neuroimage. 2016;125:267-279. doi: 10.1016/j.neuroimage.2015.10.010 [DOI] [PMC free article] [PubMed] [Google Scholar]
- 27.Benjamini Y, Hochberg Y. Controlling the false discovery rate: a practical and powerful approach to multiple testing. J R Stat Soc. 1995;57(1):289-300. doi: 10.1111/j.2517-6161.1995.tb02031.x [DOI] [Google Scholar]
- 28.Cohen J. Statistical Power Analysis for the Behavioral Sciences, 2nd ed. L. Erlbaum Associates; 1988. [Google Scholar]
- 29.Taylor HG, Dietrich A, Nuss K, et al. Post-concussive symptoms in children with mild traumatic brain injury. Neuropsychology. 2010;24(2):148-159. doi: 10.1037/a0018112 [DOI] [PMC free article] [PubMed] [Google Scholar]
- 30.Sowell ER, Thompson PM, Leonard CM, Welcome SE, Kan E, Toga AW. Longitudinal mapping of cortical thickness and brain growth in normal children. J Neurosci. 2004;24(38):8223-8231. doi: 10.1523/jneurosci.1798-04.2004 [DOI] [PMC free article] [PubMed] [Google Scholar]
- 31.Giedd JN, Raznahan A, Alexander-Bloch A, Schmitt E, Gogtay N, Rapoport JL. Child psychiatry branch of the national institute of mental health longitudinal structural magnetic resonance imaging study of human brain development. Neuropsychopharmacology. 2015;40(1):43-49. doi: 10.1038/npp.2014.236 [DOI] [PMC free article] [PubMed] [Google Scholar]
- 32.Manning KY, Schranz A, Bartha R, et al. Multiparametric MRI changes persist beyond recovery in concussed adolescent hockey players. Neurology. 2017;89(21):2157-2166. doi: 10.1212/wnl.0000000000004669 [DOI] [PMC free article] [PubMed] [Google Scholar]
- 33.Albaugh MD, Orr C, Nickerson JP, et al. Postconcussion symptoms are associated with cerebral cortical thickness in healthy collegiate and preparatory school ice hockey players. J Pediatr. 2015;166(2):394-400.e1. doi: 10.1016/j.jpeds.2014.10.016 [DOI] [PubMed] [Google Scholar]
- 34.Bigler ED, Finuf C, Abildskov TJ, et al. Cortical thickness in pediatric mild traumatic brain injury including sports-related concussion. Int J Psychophysiol. 2018;132:99-104. doi: 10.1016/j.ijpsycho.2018.07.474 [DOI] [PubMed] [Google Scholar]
- 35.Mayer AR, Hanlon FM, Ling JM. Gray matter abnormalities in pediatric mild traumatic brain injury. J Neurotrauma. 2015;32(10):723-730. doi: 10.1089/neu.2014.3534 [DOI] [PubMed] [Google Scholar]
- 36.Wilde EA, Ware AL, Li X, et al. Orthopedic injured versus uninjured comparison groups for neuroimaging research in mild traumatic brain injury. J Neurotrauma. 2019;36(2):239-249. doi: 10.1089/neu.2017.5513 [DOI] [PMC free article] [PubMed] [Google Scholar]
- 37.Ware AL, Yeates KO, Geeraert B, et al. Structural connectome differences in pediatric mild traumatic brain and orthopedic injury. Hum Brain Mapp. 2022;43(3):1032-1046. doi: 10.1002/hbm.25705 [DOI] [PMC free article] [PubMed] [Google Scholar]
- 38.Zhou D, Lebel C, Treit S, Evans A, Beaulieu C. Accelerated longitudinal cortical thinning in adolescence. Neuroimage. 2015;104:138-145. doi: 10.1016/j.neuroimage.2014.10.005 [DOI] [PubMed] [Google Scholar]
- 39.Walhovd KB, Fjell AM, Giedd J, Dale AM, Brown TT. Through thick and thin: a need to reconcile contradictory results on trajectories in human cortical development. Cereb Cortex 2017;27(2):1472-1481. doi: 10.1093/cercor/bhv301 [DOI] [PMC free article] [PubMed] [Google Scholar]
- 40.Sowell ER, Peterson BS, Kan E, et al. Sex differences in cortical thickness mapped in 176 healthy individuals between 7 and 87 years of age. Cereb Cortex. 2007;17:1550-1560. doi: 10.1093/cercor/bhl066 [DOI] [PMC free article] [PubMed] [Google Scholar]
- 41.Nemati F, Kolb B. Recovery from medial prefrontal cortex injury during adolescence: implications for age-dependent plasticity. Behav Brain Res. 2012;229(1):168-175. doi: 10.1016/j.bbr.2012.01.002 [DOI] [PubMed] [Google Scholar]
- 42.Bramen JE, Hranilovich JA, Dahl RE, et al. Sex matters during adolescence: testosterone-related cortical thickness maturation differs between boys and girls. PLoS ONE. 2012;7(3):e33850. doi: 10.1371/journal.pone.0033850 [DOI] [PMC free article] [PubMed] [Google Scholar]
- 43.Mac Donald CL, Barber J, Wright J, et al. Longitudinal clinical and neuroimaging evaluation of symptomatic concussion in 10- to 14-year-old youth athletes. J Neurotrauma. 2019;36(2):264-274. doi: 10.1089/neu.2018.5629 [DOI] [PubMed] [Google Scholar]
- 44.Bigler ED. Anterior and middle cranial fossa in traumatic brain injury: relevant neuroanatomy and neuropathology in the study of neuropsychological outcome. Neuropsychology. 2007;21(5):515-531. doi: 10.1037/0894-4105.21.5.515 [DOI] [PubMed] [Google Scholar]
- 45.Wilde EA, Merkley TL, Bigler ED, et al. Longitudinal changes in cortical thickness in children after traumatic brain injury and their relation to behavioral regulation and emotional control. Int J Dev Neurosci. 2012;30(3):267-276. doi: 10.1016/j.ijdevneu.2012.01.003 [DOI] [PMC free article] [PubMed] [Google Scholar]
- 46.Chan DD, Knutsen AK, Lu Y-C, et al. Statistical characterization of human brain deformation during mild angular acceleration measured in vivo by tagged magnetic resonance imaging. J Biomechanical Eng. 2018;140(10):1010051-10100513. doi: 10.1115/1.4040230 [DOI] [PMC free article] [PubMed] [Google Scholar]
- 47.Grodd W, Kumar VJ, Schüz A, Lindig T, Scheffler K. The anterior and medial thalamic nuclei and the human limbic system: tracing the structural connectivity using diffusion-weighted imaging. Sci Rep. 2020;10(1):10957. doi: 10.1038/s41598-020-67770-4 [DOI] [PMC free article] [PubMed] [Google Scholar]
- 48.Blumenthal JD, Zijdenbos A, Molloy E, Giedd JN. Motion artifact in magnetic resonance imaging: implications for automated analysis. Neuroimage. 2002;16(1):89-92. doi: 10.1006/nimg.2002.1076 [DOI] [PubMed] [Google Scholar]
- 49.Brooks BL, Kadoura B, Turley B, Crawford S, Mikrogianakis A, Barlow KM. Perception of recovery after pediatric mild traumatic brain injury is influenced by the “Good Old Days” bias: tangible implications for clinical practice and outcomes research. Arch Clin Neuropsychol. 2014;29(2):186-193. doi: 10.1093/arclin/act083 [DOI] [PubMed] [Google Scholar]
Associated Data
This section collects any data citations, data availability statements, or supplementary materials included in this article.
Data Availability Statement
Deidentified participant data will be made available on reasonable request, subject to a signed data access agreement.