

Significance
The impact of climate on neglected tropical diseases (NTDs) has been extensively discussed, but there is a lack of mechanistic evidence establishing a direct link. In this paper, we compiled a unique dataset to investigate the factors driving the spillover dynamics of Polycystic Equinococosis (PE), a neglected zoonotic disease with high case fatality rates, in Pan-Amazonia. PE spillover occurs through complex wildlife–human interactions facilitated by hunting and wild meat manipulation. Our study demonstrates that temperature stability promotes the sylvatic circulation of PE, while El Niño-Southern Oscillation extreme events disrupt hunting patterns, thereby affecting the risk of PE spillover to humans. These findings provide evidence attributing the effects of climate to NTDs in Pan-Amazonia, with implications for similar hunting-related zoonoses.
Keywords: climate change, zoonotic spillover, modeling, zoonotic diseases, ENSO
Abstract
Polycystic Echinococcosis (PE), a neglected life-threatening zoonotic disease caused by the cestode Echinococcus vogeli, is endemic in the Amazon. Despite being treatable, PE reaches a case fatality rate of around 29% due to late or missed diagnosis. PE is sustained in Pan-Amazonia by a complex sylvatic cycle. The hunting of its infected intermediate hosts (especially the lowland paca Cuniculus paca) enables the disease to further transmit to humans, when their viscera are improperly handled. In this study, we compiled a unique dataset of host occurrences (~86000 records) and disease infections (~400 cases) covering the entire Pan-Amazonia and employed different modeling and statistical tools to unveil the spatial distribution of PE’s key animal hosts. Subsequently, we derived a set of ecological, environmental, climatic, and hunting covariates that potentially act as transmission risk factors and used them as predictors of two independent Maximum Entropy models, one for animal infections and one for human infections. Our findings indicate that temperature stability promotes the sylvatic circulation of the disease. Additionally, we show how El Niño-Southern Oscillation (ENSO) extreme events disrupt hunting patterns throughout Pan-Amazonia, ultimately affecting the probability of spillover. In a scenario where climate extremes are projected to intensify, climate change at regional level appears to be indirectly driving the spillover of E. vogeli. These results hold substantial implications for a wide range of zoonoses acquired at the wildlife-human interface for which transmission is related to the manipulation and consumption of wild meat, underscoring the pressing need for enhanced awareness and intervention strategies.
Endemic zoonoses impose an enormous disease and economic burden, particularly across tropical regions. Many of these endemic zoonoses, which are often understudied or even undiscovered, have a direct impact on human health and well-being by causing common illnesses. Additionally, they indirectly affect people's livelihoods and food security through losses in livestock production. Despite their multiple impacts, the mechanisms underlying the transmission and prevalence of most of these zoonoses are poorly understood. This lack of understanding contributes to a vicious cycle of poor health quality and poverty in tropical areas.
Food-borne zoonotic diseases—those caused by the ingestion of food contaminated by toxins, pathogens, or parasites—affect almost half of the world’s population at any given time (1). They thrive primarily in developing regions where people live close to domestic and wild animals (2). In tropical forests worldwide, wild meat, i.e., meat from wild animals excluding fish, represents a significant source of animal protein in the diet of Indigenous and rural societies (3), and it is highly commercialized in urban areas (4, 5). However, the practice of subsistence hunting and the trade of wild meat for human consumption raise the risk of acquiring food-borne zoonotic diseases among rural hunters, meat processors, and consumers by increasing human contact with wild animals, whether dead or alive (6). In the Amazon, Polycystic Echinococcosis (PE), a tropical neglected parasitic disease, is caused by one such pathogen related to the management of wild meat, namely Echinococcus vogeli (7, 8).
Human echinococcoses are a group of endemic neglected zoonoses caused by tapeworms of the genus Echinococcus (Cestoda: Taeniidae). These diseases affect over one million individuals at any given time and manifest in four different forms. Among them, cystic echinococcosis (CE), caused by a species complex centered on E. granulosus, and alveolar echinococcosis, caused by E. multilocularis, are the most significant and extensively studied, with recognized medical and public health importance (9, 10).
PE, an equally severe but understudied disease, is naturally sustained in Neotropical forests due to a sylvatic cycle that requires the presence of intermediate and definitive wild hosts, mainly the lowland paca Cuniculus paca and the wild bush dog Speothos venaticus, respectively (8). However, other wild mammals might also contribute to the circulation of PE (i.e., small rodents, the widespread nine-banded armadillo Dasypus novemcinctus as intermediate hosts, and Atelocynus microtis as final host). As far as current knowledge suggests, the disease is expected to be naturally restricted to areas where there is an overlap of the aforementioned intermediate and definitive hosts, thus allowing the parasite to complete its life cycle (8).
The consumption of the meat and viscera of key intermediate hosts infected with E. vogeli enables the transfer of the parasite from its sylvatic cycle to human settings, where an equivalent communal cycle can occur with humans acting as accidental intermediate hosts and domestic dogs as definitive hosts. Domestic dogs can become infected when eating the metacestodes or hydatid cysts present mainly in the liver of infected wild intermediate hosts. Humans, in turn, can become infected by ingesting food or water contaminated with dog excrement, which commonly occurs in rural communities due to poor hygiene and sanitation practices (11). The graphical representation of the epidemiological cycle of PE can be found in Fig. 1A.
Fig. 1.
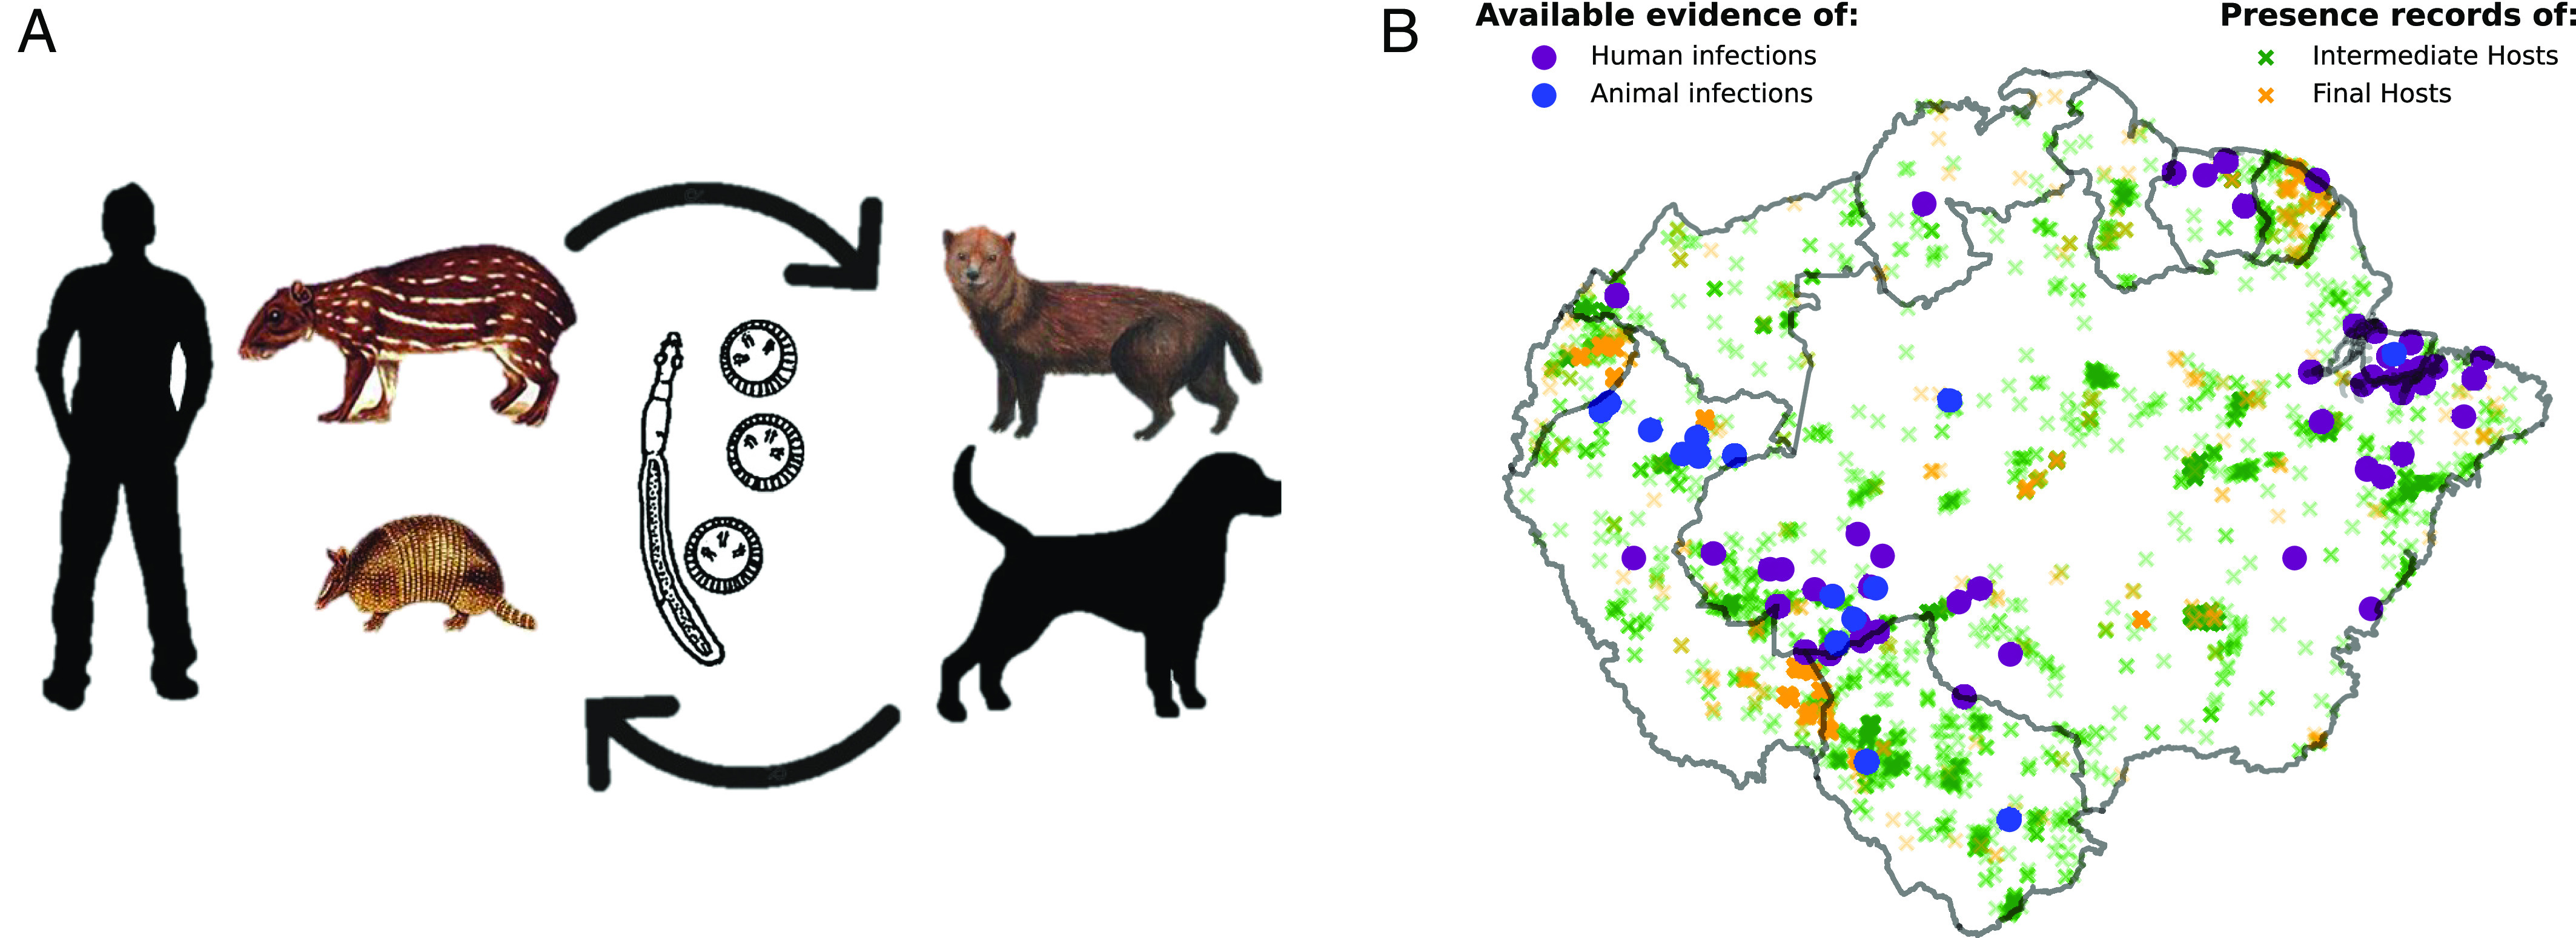
(A) Diagram illustrating the epidemiological cycle of E. vogeli. It is a two-host cycle that requires intermediate hosts (in the wild, mainly the C. Paca rodent or the Dasypus novemcinctus) and final hosts (in the wild, the dog Speothos Venaticus). Humans can also act as intermediate hosts and domestic dogs as final hosts, thus creating an alternative, communal, cycle. (B) Distribution of available evidence of E. vogeli infections. Human infections are shown in purple and animal infections in blue. The background depicts evidence of sylvatic hosts, presented as dimmed presence points.
The main intermediate host responsible for introducing this parasite into the human population is the well-known lowland paca, a large (~8 kg) rodent of the suborder Hystricomorpha found abundantly throughout Latin America, from southeastern Mexico to southern Brazil. Pacas are solitary, nocturnal, and elusive animals that construct elaborate underground shelters, primarily under roots and fallen trunks (12). They have a small home range of about 2.5 ha (13) and are found in areas with high canopy density and the presence of water bodies, near which they construct their shelters (14). The meat of C. paca is highly valued for its taste and nutritional content, making it a heavily hunted animal and a regular part of the diet in Indigenous, rural, and even urban populations in Pan-Amazonia (15).
PE is a Neglected Tropical Disease (NTD) that, when diagnosed early, has a relatively favorable prognosis (10). However, due to insufficient evidence, treatment for PE can be expensive and complex, often requiring extensive surgery and/or prolonged drug therapy (10). In addition, given that PE affects isolated communities in the Pan-Amazonia region with limited or no access to medical care, diagnosis often occurs at a late stage, posing a threat to human life and resulting in a case fatality rate of around 29% (7).
Agricultural intensification, deforestation, and climate variability and change are factors that have been shown to influence the eco-epidemiological behavior of diseases. However, the real magnitude of these factors on the occurrence of diseases is usually only approximated and direct links are lacking in the vast majority of cases (16). For endemic NTDs, such attribution remains even more elusive and key questions persist regarding the driving effects of such covariates. While some studies have examined the influence of climatic and environmental factors on CE (17–19), this topic remains unexplored for PE. The scientific literature only contains general assumptions suggesting that flooding from rains may enhance the spread of taeniid cestodes by transporting eggs to new locations (20).
This study addresses key knowledge gaps in the epidemiological cycle of PE and evaluates how climate may modulate the risks and threats it poses to human health in the Amazon rainforest. More specifically, we 1) identify the main E. vogeli transmission hotspots and 2) improve the understanding of how different ecological, environmental, and climatic covariates interplay to drive E. vogeli transmission. By doing so, this study tackles crucial unanswered questions regarding the role of land use and climate forcing in shaping the spatiotemporal dynamics of endemic diseases in Pan-Amazonia.
1. Available Data
To date, there have only been around 200 reported cases of PE in humans from 12 countries in Central and South America (8, 21). Fig. 1B. shows all the available evidence of E. vogeli infections in both animals and humans, totaling around 400 cases. These data were obtained by the authors of this study (through biological collection or histopathological diagnosis) and through an exhaustive literature review. All such data can be consulted at https://gitlab.com/asanjopl/evogeli/-/blob/main/input/EvogeliData/E_vogeli_infection_data.xlsx.
It is important to stress that, regarding the data from the literature, we searched for geolocalized evidence of cases of PE. When available, we used the geographic coordinates provided in the articles. In the cases where only a municipality was mentioned, we georeferenced the case to the centroid of the municipality’s polygon. PE is predominantly a rural disease, and most of these municipalities are small. However, there might be a slight discrepancy between the reported and true location of infection, mainly due to delayed diagnosis (see SI Appendix, Appendix 1 for extensive details regarding data acquisition). We acknowledge the possibility of minor biases in some of these data, which could affect the results of low spatially autocorrelated covariates. To account for this, we paid them special attention and closely examined their behavior, an issue further addressed in the results.
2. Modeling Approach
In order to both uncover the disease drivers and their main sources of variability, and to understand and better anticipate E. vogeli transmission risk, we employed maximum entropy models (MaxEnt) (22) trained with the database of PE infections in Pan-Amazonia. The restricted temporal information in the data limited the use of other time-aware statistical approaches. Given the complexity of the transmission process, and the available infection data, we ran two separate MaxEnt models: one focused on wild animal infections (referred to as the sylvatic E. vogeli circulation model) and the other on human infections (referred to as the E. vogeli human spillover model). We first assessed the silent sylvatic circulation of the disease in wild animals and the effect of different disease drivers on the animal compartment of the transmission process. Despite the inherent challenge posed by the scarcity of data on the prevalence of infectious diseases in wild animals, we successfully addressed this limitation by leveraging a comprehensive Amazon Subsistence Hunting database meticulously compiled by the authors of this study (please refer to SI Appendix, Appendix 1 for extensive details). We then studied the spillover to humans along with its drivers. This dual analysis allowed us to discern how certain factors affect the animal and cross-species transmission differently. Therefore, this comprehensive approach enables a deeper understanding of the disease dynamics and the complex interplay among various drivers across different stages of transmission.
To ensure accurate results from the MaxEnt models, we corrected the geographical bias in the disease presence data and performed a thorough hyperparameter tuning (of the regularization term and the feature classes) (23). We calculated the skill of differently tuned submodels by computing omission rates (at the threshold maximizing specificity plus sensitivity) and area-under-the-curve (AUC) averaging results of a fivefold cross-validation and selected the best-performing submodels. More information on the methodology, including background manipulation and hyperparameter tuning, can be found in SI Appendix, Appendix 2.
Regarding explanatory covariates, the distribution of E. vogeli cases in humans should be mostly determined by the presence of intermediate and final hosts, as well as by the presence of humans. Regarding animal hosts, special attention should be paid to the hunting of lowland paca, as this is a key element for the sylvatic cycle to become domestic. Furthermore, as global ecological and environmental changes (e.g., land-use change, climate change impacts) have been linked to increased spillover risk (24, 25), they were added as covariates in both models. See Table 1 for a summary of covariates and their sources.
Table 1.
MaxEnt covariates: Sources and procedures
| Covariates | Procedure | Source | |
|---|---|---|---|
| Retrieved | Population distribution | Downloaded at 30-s (1 km) resolution. Mean population counts from available data throughout the studied period (2000, 2005, 2010, 2015, and 2020). | Gridded Population of the World V4 (https://sedac.ciesin.columbia.edu/data/collection/gpw-v4) |
| Land-use | Downloaded at 30-m resolution. Modal value throughout studied period 1991 to 2020. | Mapbiomas Amazonia v3.0 (https://mapbiomas.org/). | |
| Built | Disease natural suitability | ENMs were run for the four animals implicated in the sylvatic cycle. Suitability maps were then grouped by epidemiological role and a geometric mean between intermediate and final hosts suitability maps was performed to derive desired output. | Presence records were retrieved from public repositories (GBIF, SpeciesLink), open datasets like (26–29) and primary data from hunting registries and interviews. |
| Hunting pressure of intermediate hosts | Kriging with an exponential function was performed to the hunting records. | Primary data from hunting records. | |
| Last 30-y climate variability and change impacts | Monthly mean temperature (at 2 m), sea level pressure, total precipitation, and dew point temperature data were retrieved for the period 1991 to 2020. AH time series were built from the downloaded covariates. Two nested SSA were run to decompose the 30-y time series into trend, QB and QQ interannual modes, seasonality and noise. | ERA5 Reanalysis data from the CDS. |
Population distribution data are available from the Gridded Population of the World (30), and land-use categories were obtained from Mapbiomas (https://mapbiomas.org/). The remaining covariates had to be derived. Consequently, before running the models, we 1) built the key wild hosts habitat suitability maps, 2) built the map on C. paca’s hunting pressure, and 3) developed a series of variables summarizing the last 30-y climate variability and change impacts. The habitat maps of wild hosts were combined to generate an E. vogeli transmission suitability map, referred to as E. vogeli natural suitability. Fig. 2 graphically summarizes the covariates construction process, for which we provide more detail in the Methods.
Fig. 2.
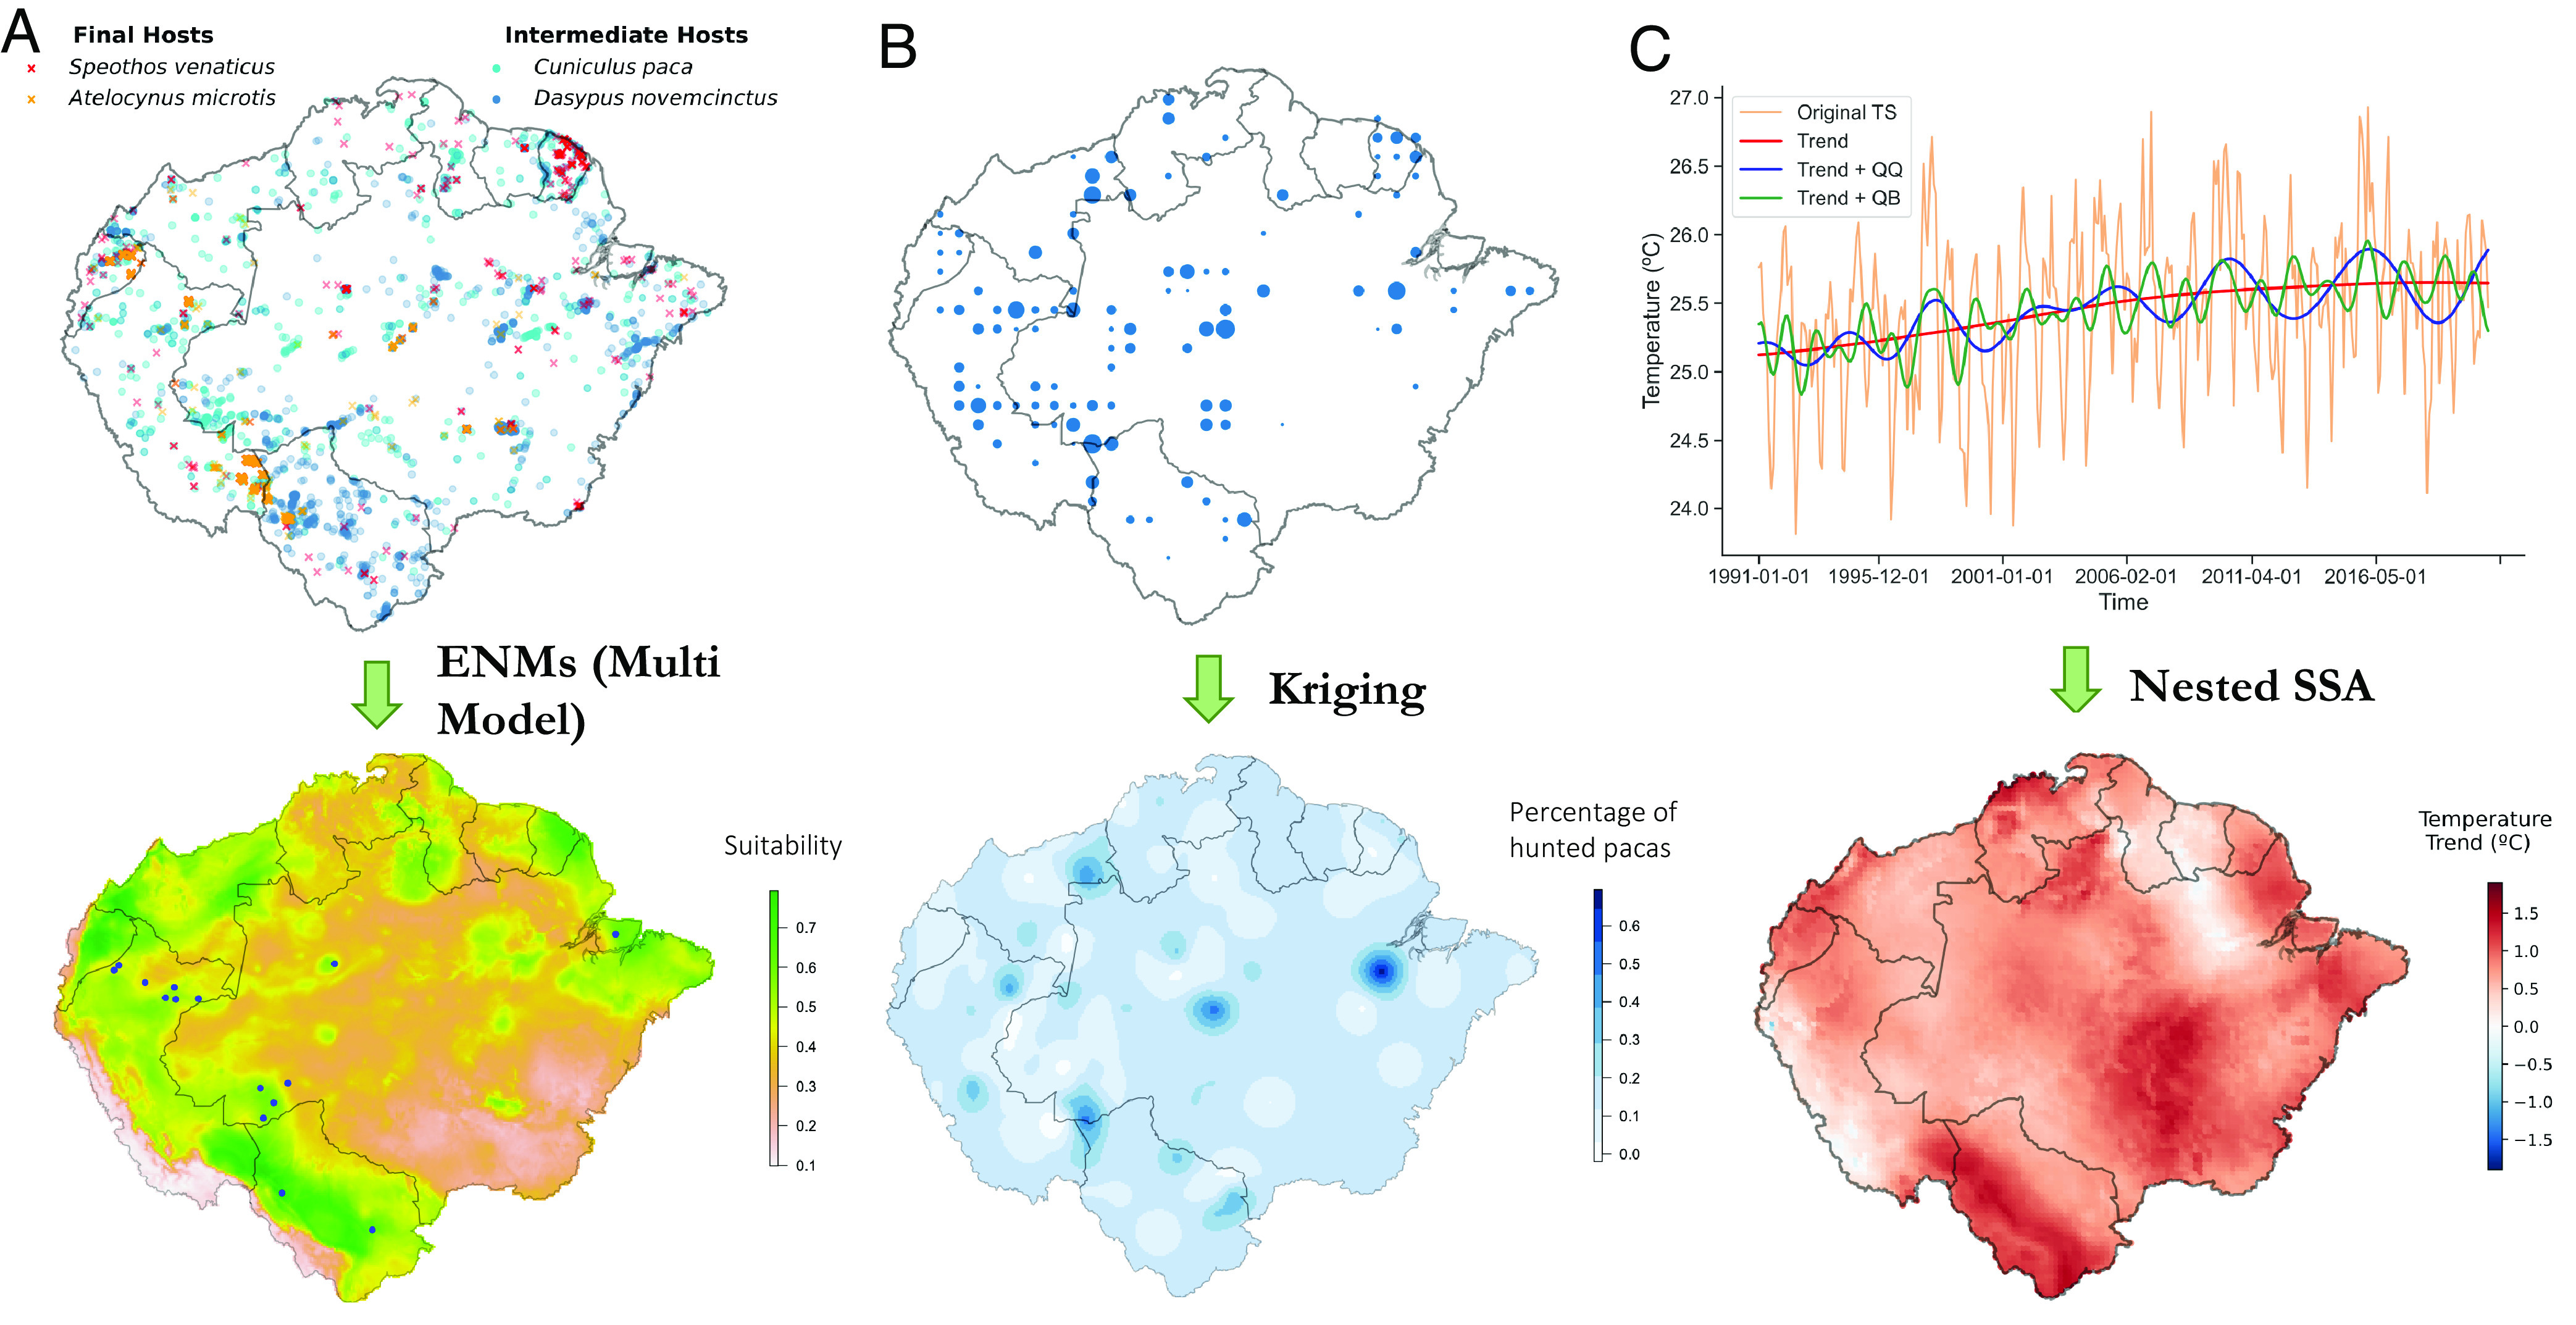
Graphical summary of the covariate construction process. (A) Construction of key wild hosts habitat suitability maps: (Up) Presence records of the four main wild animals involved in the sylvatic circulation of PE. (Down) Derived map of E. vogeli natural suitability, which accounts for the common presence of intermediate and final hosts and thus shows which places are more suitable for the parasite to complete its lifecycle. Overlaid in blue are animal infection records, which are seen to align with the high suitable (green) areas. The natural suitability map was generated using Ecological Niche Models run on the shown presence records. (B) Construction of C. paca’s hunting pressure map. (Up) Available information on paca’s hunting pressure, assembled by the authors of this study (Down) Continuous regional C. paca’s hunting pressure across Pan-Amazonia obtained through a kriging algorithm (C) Construction of climate variability and climate change variables. (Up) Monthly temperature data in the Peruvian amazon (longitude -70, latitude -3) spanning from 1991 to 2021. A Singular Spectrum Analysis (SSA) decomposition into trend, QB and QQ is shown on top. (Down) Temperature trend of the last 30y across Pan-Amazonia obtained with an SSA decomposition run for all pixels in the region. This was performed for both Temperature and for Absolute Humidity and a map of trend, QB and QQ was derived for each.
3. Maximum Entropy Models Results
3.1. Sylvatic Circulation Model.
After conducting the hyperparameter tuning for the Sylvatic Circulation model, it was determined that the submodel with linear and quadratic features and a betamultiplier of 3.5 achieved the best performance. This submodel had an omission rate of 0.13 and an AUC of 0.72. However, to ensure robustness, the results from the top five submodels were analyzed together. Fig. 3 illustrates the final results of these submodels for the sylvatic circulation. A strong consensus is evident among them concerning both the crucial features and their corresponding response curves. (Fig. 3 B and C).
Fig. 3.
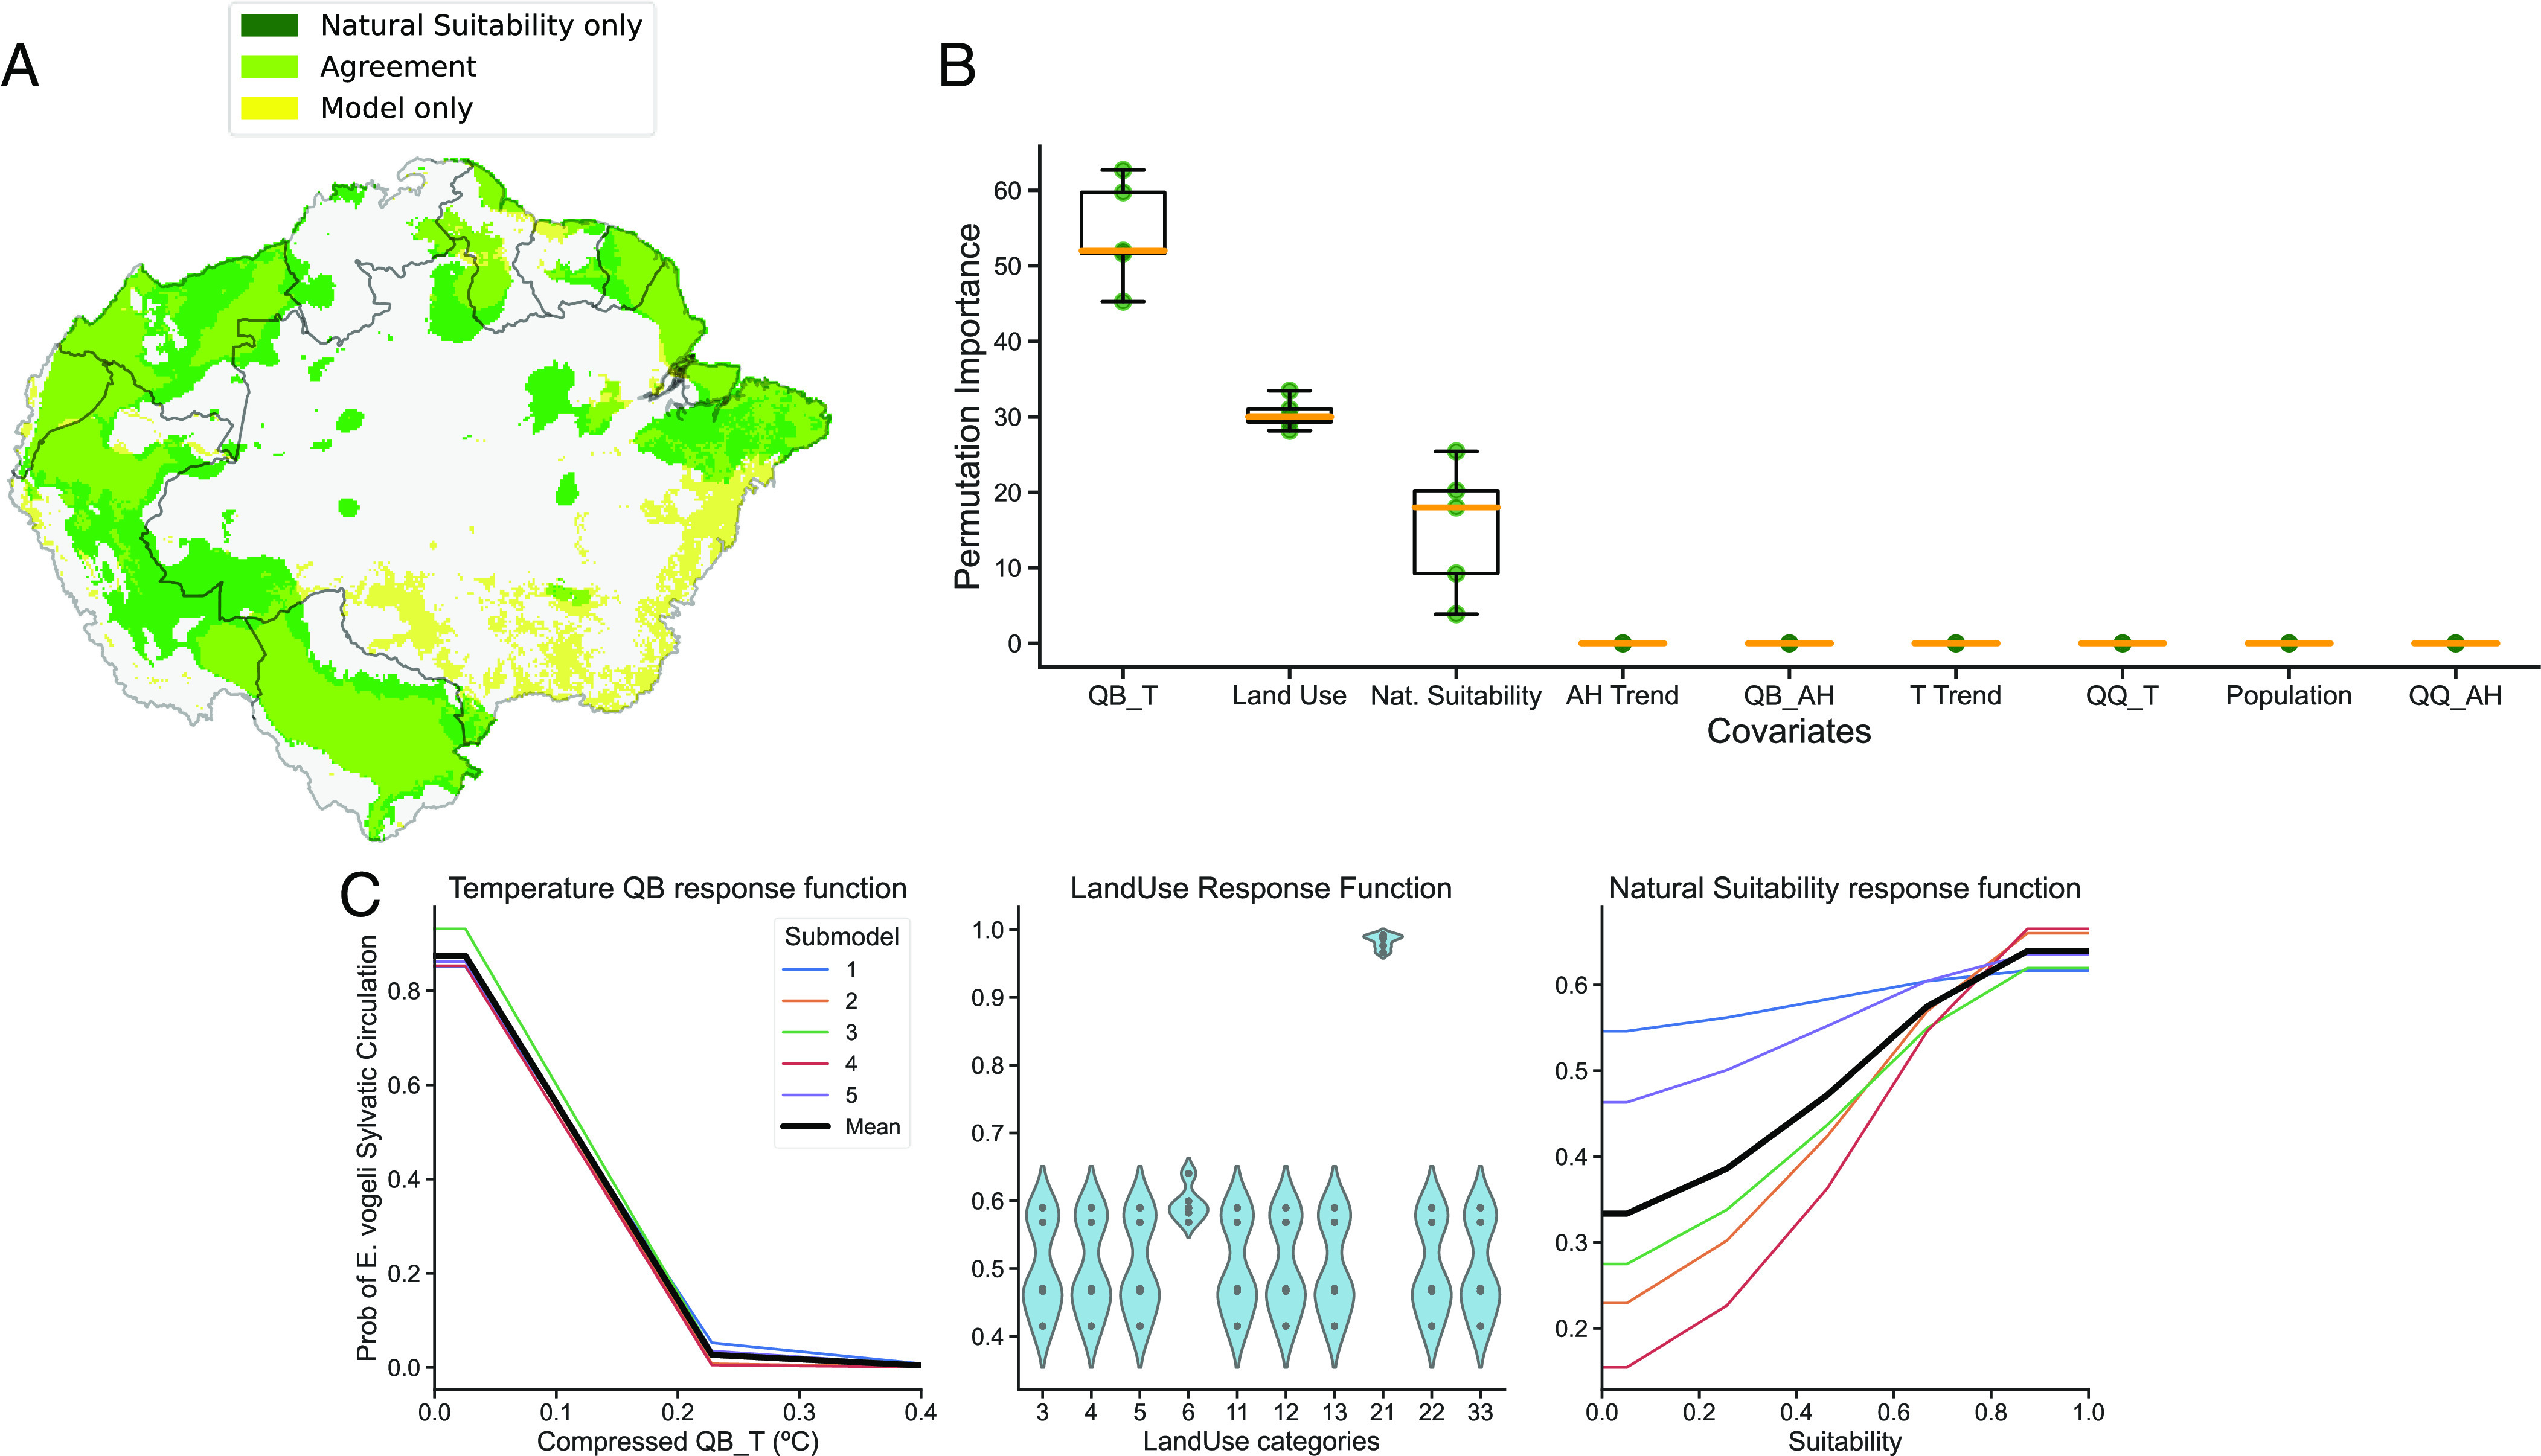
Animal model results averaging results of the five best-performing sub-models. (A) Model predictions overlaid on the Natural Suitability map. Most of the areas selected by the sylvatic circulation model coincide with the suitable areas (shown in light green). The dark green areas represent locations with the highest risk of E. vogeli expansion, as they harbor the appropriate conditions for its circulation and thus require special attention. Some areas in southeastern Amazon are selected by the sylvatic circulation model but are not part of the main suitable areas for the disease's circulation (indicated in yellow) (B) Variable importance derived from a permutation test. (C) Response functions that illustrate the variation in model predictions as we sweep through the full range of values of the variable under study while keeping the rest at their mean or modal value.
The variable with the highest explanatory power is the quasibiennial mode of temperature (QB_T) which exhibits a preference for low values. The second most important variable is land use, with two categories being especially associated with the sylvatic circulation of the disease: Mosaic of Agriculture and Grass and Flooded forest. The last selected variable is disease natural suitability, which accounts for the common presence of intermediate and final hosts. All other six covariates are deemed unimportant by all submodels.
In Fig. 3A, the results of the sylvatic circulation model are compared to the previously derived Natural Suitability map for E. vogeli circulation. This allows for a comparison between the areas where the parasite is actually present and the areas where it could potentially be present as they harbor both intermediate and final hosts. As expected, most of the areas selected by the sylvatic circulation model coincide with the suitable areas, but there are also some differences. In fact, such discrepancies allow us to identify the regions with the highest risk of E. vogeli expansion (refer to the Fig. 3A legend), which require special attention. Also, some areas in southeastern Amazon are selected by the sylvatic circulation model but are not part of the main suitable areas for the disease's circulation. This pattern is primarily driven by the widespread presence of agricultural land-use categories following extensive deforestation in these regions of Brazil. The model associates E. vogeli circulation with these specific land-use categories in western Amazonia and extrapolates them to the southeast. Further details and information can be found in the associated notebook:
https://gitlab.com/asanjopl/evogeli/-/blob/main/7.1MaxEntSylvaticModel.ipynb.
3.2. Human Spillover Model.
The hyperparameter tuning for the human spillover model determined that the model with linear features and betamultiplier 1 was the best-performing sub-model, with an omission rate of 0.20 and an AUC 0.79. As done in the animal model, the results from the top five submodels were analyzed altogether (see the five top-ranked models in Fig. 4). The permutation test for assessing variables' importance ranked the distribution of population as the most important variable, in sharp contrast to the animal model where this variable was completely insignificant. In particular, we found that rural areas with small to medium-sized populations were more highly associated with the disease. Next in importance was the quasiquadrennial mode of temperature (QQ_T), with higher values associated with the spillover of E. vogeli. From here, with lower ranks, the same variables that shaped the animal model (the quasibiennial mode of temperature (QB_T), land use, and the natural suitability of the disease) showed extremely similar response functions in the human model. Finally, the model selected both the temperature and the absolute humidity (AH) trends of the last 30 y, with low values of T trend and high values of AH trend being associated with the disease. Unexpectedly, hunting of C. paca was deemed a superfluous variable by all submodels. We refer the reader to the notebook with model comparisons in case of interest:
Fig. 4.
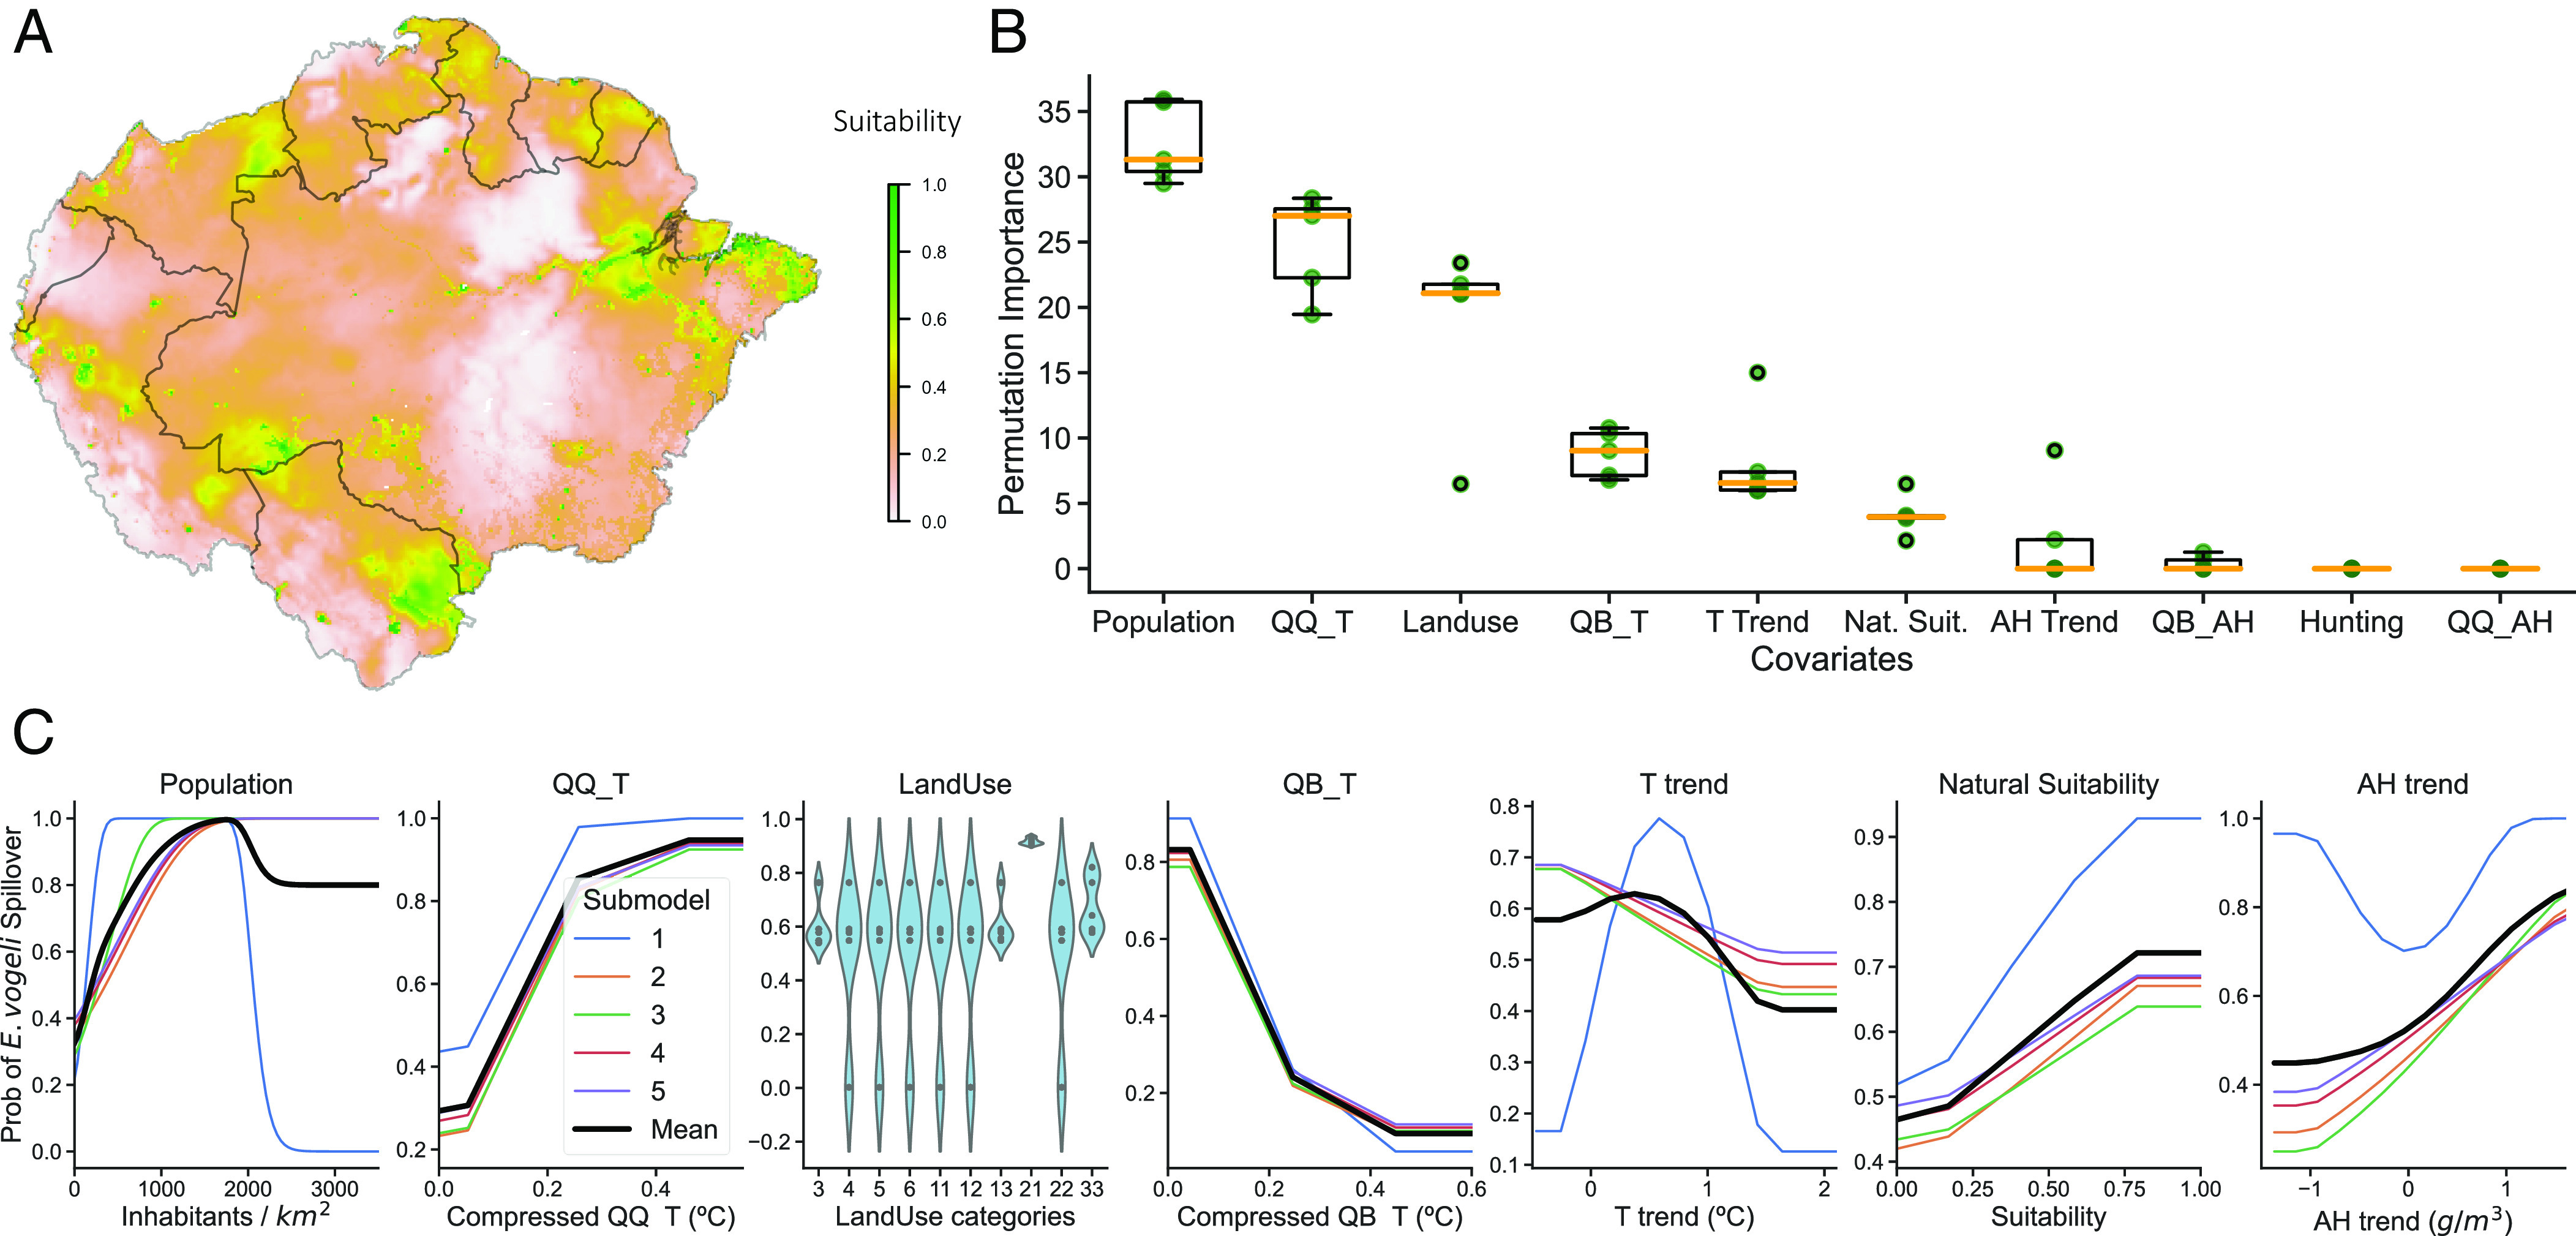
Human model results averaging the results of the five best-performing submodels. (A) Model predictions (B) Variable importance derived from a permutation test. (C) Response functions illustrate the variation in model predictions as we sweep through the full range of values of the variable under study while keeping the rest at their mean or modal value.
https://gitlab.com/asanjopl/evogeli/-/blob/main/7.2MaxEntSpilloverModel.ipynb.
4. Climate Drivers of Transmission
Given that both the quasibiennial (QB_T) and the quasiquadrennial (QQ_T) modes of temperature stood out among the most important variables, we further analyzed them to assess their effects on Pan-Amazonian climate and their possible impacts on hunting practices. The QB_T mode exhibits a dipole pattern (Fig. 5A), with the highest values observed in the Guiana Shield and the lowest values in western Pan-Amazonia (Peruvian Amazon, Acre, Rondonia, and the Bolivian Amazon). Temperature in the Guiana Shield displays a strong 2-y cycle and peaks subsequently generate rainfall after a short lag. In the other pole, instead, temperature and precipitation are very stable and such a cycle is almost absent (See SI Appendix, Fig. S1). MaxEnt results associate the wild circulation of E. vogeli with places with no (or very little) presence of such biennial temperature cycle, therefore places with a more stable climate in terms of temperature and precipitation.
Fig. 5.
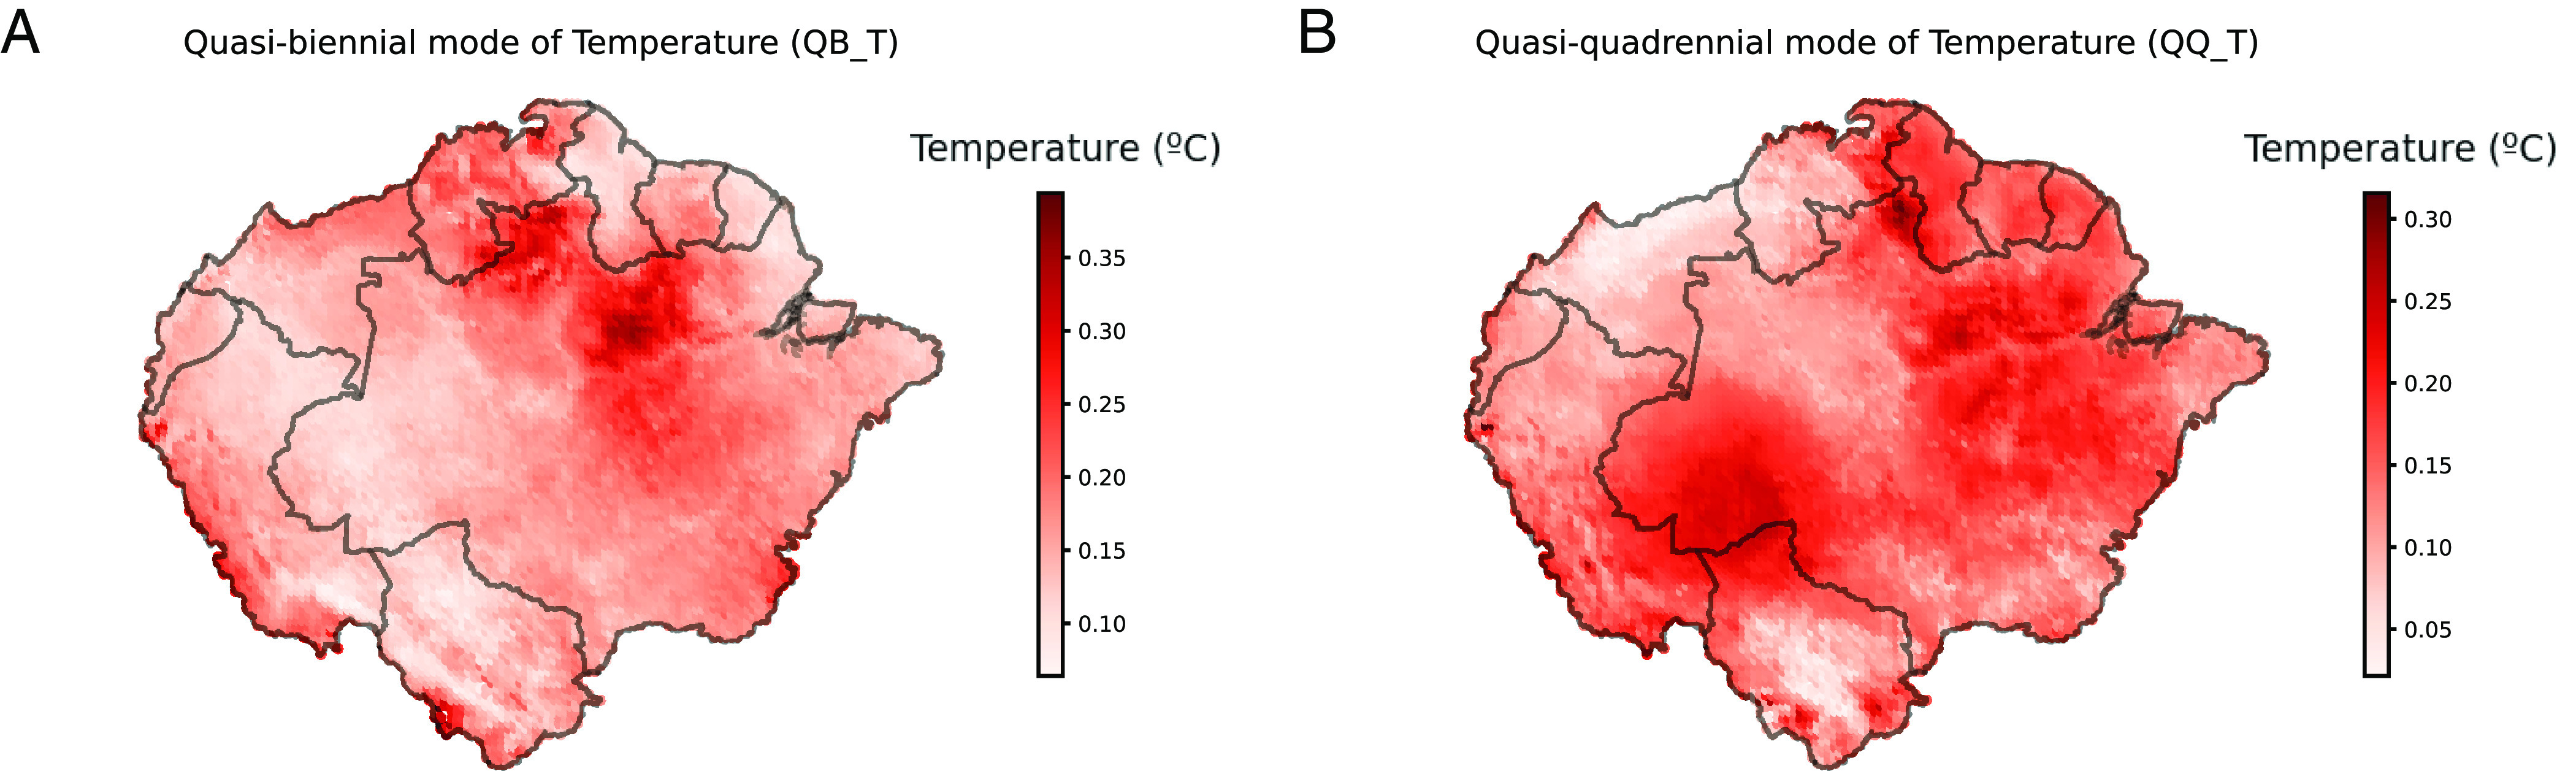
Compressed quasibiennial (QB_T) and quasiquadrennial (QQ_T) modes of temperature. Each pixel represents the sum of the absolute value of the quasibiennial (A) and quasiquadrennial (B) modes of temperature throughout the period 1991 to 2020.
The quasiquadrennial (QQ_T) mode primarily determines the occurrence of El Niño Southern Oscillation (ENSO) events. With its lower frequency, its peaks and lows denote the warm and cold ENSO events and appear at those times synchronized with the QB_T mode. The QQ_T exhibits maximum values in the south of Pan-Amazonia, with a major hotspot in the west, as well as in the east (Fig. 5B). As the QQ_T mode was deemed unimportant in the animal submodels, its effect in the disease system may be possibly related to human–animal contact or human behavioral patterns. To investigate this connection, we analyzed the massive hunting dataset assembled by the authors of this study (already used in the first Ecological niche models (ENMs) as presence points for the intermediate and final hosts), which allowed us to inspect if the QQ_T affects hunting patterns throughout Pan-Amazonia. In order to assess this connection, we used the primary hunting dataset—the only dataset containing full temporal information—which is composed of 12 independent hunting monitoring or survey initiatives led by our work group that mainly cover the western Amazon. In order to build a hunting Pan-Amazonian aggregated time series, we made an average of the results from the different initiatives (and not a sum as not all initiatives were working for the whole period 1990-present). This also allowed us to avoid biases toward better-surveyed areas and enabled us to have a more comprehensive time series of Pan-Amazonian hunting. The final hunting time series can be seen in Fig. 6A. A cross-correlation analysis with the full low-frequency components of the two time series [identified with a Singular Spectrum Analysis (SSA)] (31, 32) showed a notable degree of anticorrelation (Spearman’s ρ = −0.5, P_value < 0.01) between the series at a 10 mo lag. A nuanced Scale Dependent Correlation Analysis (33, 34) then showed consistent and very strong 3 y-window anticorrelations (of up to ρ ~ −1) at lags of around 10 mo for the two time series and in particular for the main ENSO warm and cold events (Fig. 6 B and C). This suggests that ENSO events likely disrupt hunting patterns in Pan-Amazonia.
Fig. 6.
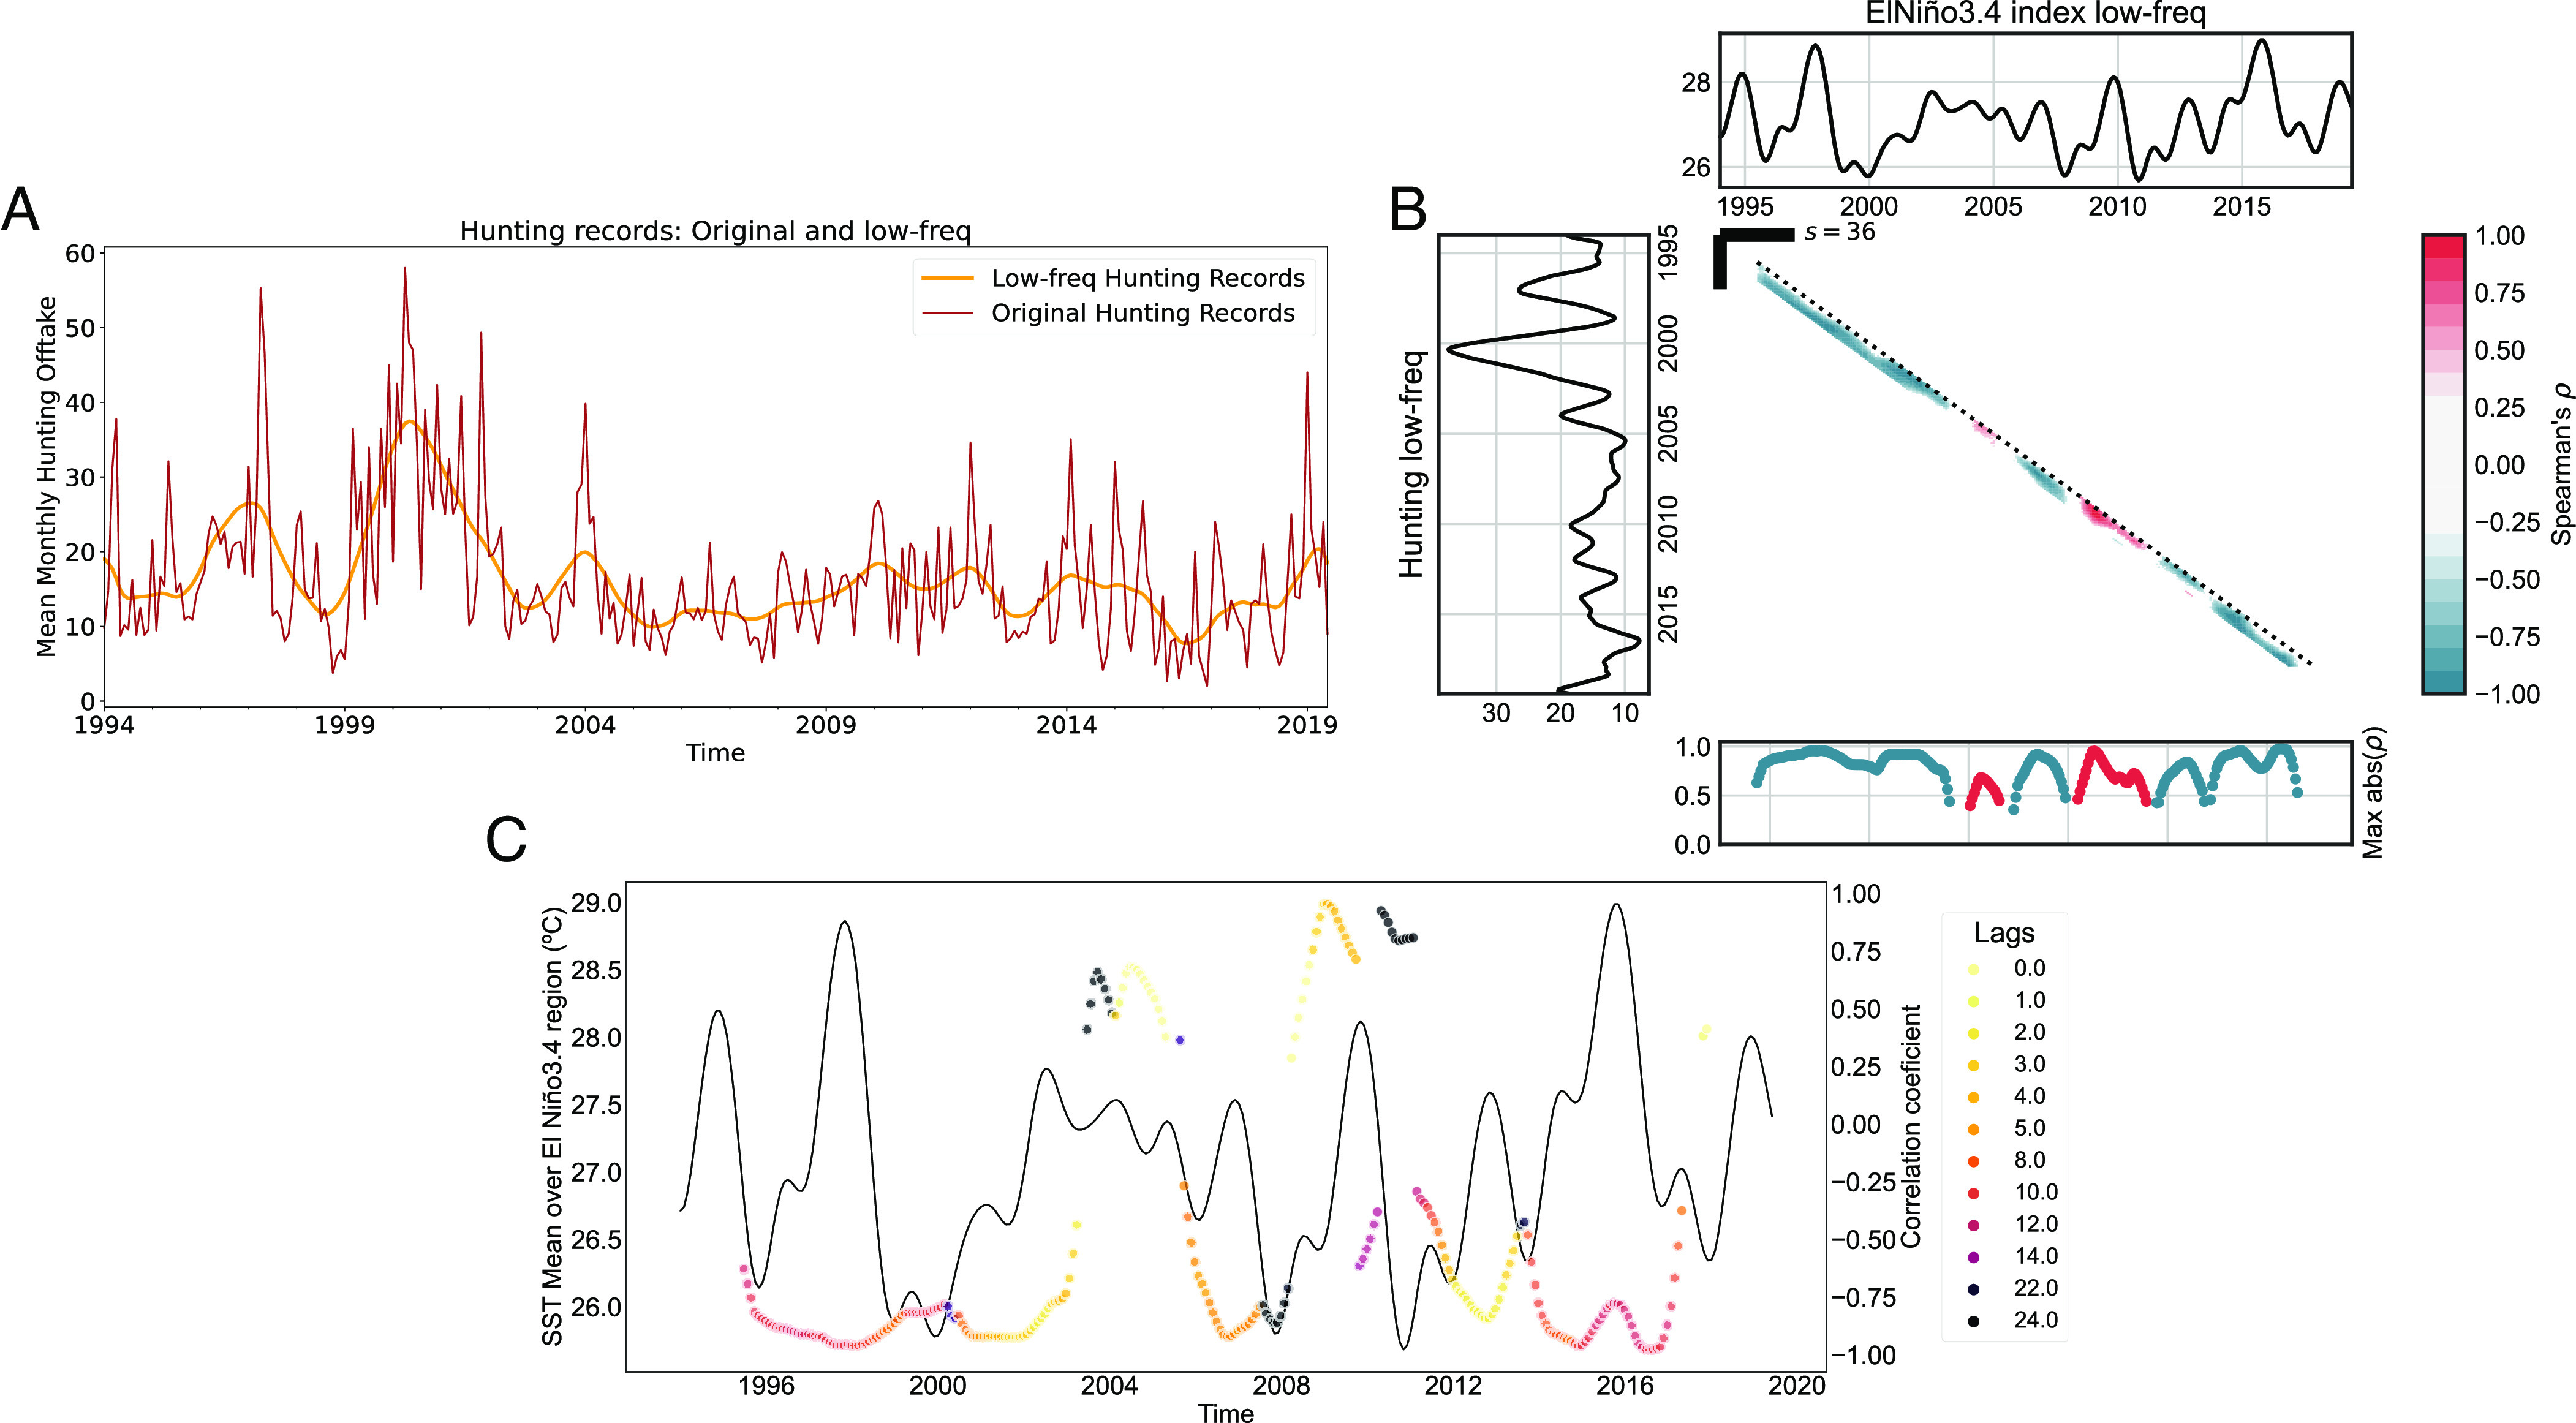
ENSO effect on hunting practices across Pan-Amazonia. (A) Mean monthly hunting offtake across studied sites: Original time-series and low-frequency component identified using SSA. (B) Scale-dependent correlation analysis between the low-frequency component of the hunting records and the ENSO3.4 index. Consistent strong couplings (with a correlation coefficient of approximately −1) are observed during the main ENSO extreme events (both warm and cold), as indicated by the blue diagonal. Analyses are performed using windows of 3 y. (C) Lags at which the maximum absolute correlation is achieved in the 3-y windows. The coupling during the main ENSO events shows maximum values at lags of around 8 to 10 mo. Notice that the 2009-2010 was a Modoki-type EN (a central-pacific EN) and therefore yields different lags and correlation coefficients in the analyses.
5. Discussion
In this study, we utilized a unique dataset that allowed us to run two independent models to investigate the different impacts of ecological, environmental, and climatic drivers on the sylvatic circulation of E. vogeli and its spillover to humans. The results from the human spillover model were found to effectively incorporate the findings from the sylvatic model, which was expected since humans become infected through contact with infected animals. We found the same QB_T and Natural Suitability response functions and almost the same land-use categories (Mosaic of Agriculture and Grass) in both models. This consistency between the models adds credibility to the results obtained. Regarding the additional variables that the human model selects, we assume that they might affect either the contact rate between humans and animals, or be related to some specific human behavior.
The population and natural suitability response functions are self-explanatory and do not need further analysis. Regarding land use, the sylvatic circulation model pointed to two categories specially linked to sylvatic circulation of E. vogeli: Flooded forest and Mosaic of Agriculture and Grass (a category also selected by the human spillover model). Both findings can be easily linked to PE, since lowland pacas, the main intermediate host of E. vogeli, tend to live near water bodies in flood-prone areas (35), and are also attracted to crops, which are accessible sources of food and places in which they interact with humans and domestic dogs.
Despite concerns on how small localization errors could bias our results for low spatially autocorrelated variables, it is important to acknowledge that the land use findings are logical and are in line with previous literature on the disease. Our findings link PE to the presence of both pacas and humans, which reinforces the reliability of our results. It should also be mentioned that the human population distribution was found to be irrelevant in explaining the sylvatic circulation of the disease. This is a reasonable finding as well, but one that minor errors in the geolocation could have compromised.
In terms of the temperature covariates, it is worth noting that Pan-Amazonia is one of the most stable ecosystems on earth and is characterized by extremely small temperature variability. This stability is precisely what allowed a species like E. vogeli to adapt to tropical humid forests, where it only requires to manage a narrow temperature range safe from dangerous (large seasonal and interannual) variations that could have compromised its survival and decreased its fitness. However, even within Pan-Amazonia, some places exhibit higher temperature variability than others, and we precisely found that E. vogeli thrives in those with less QB_T amplitude, a result we hypothesize to respond to this same rationale and to show E. vogeli’s preference for climatic stability.
The importance of climate stability for E. vogeli’s sylvatic circulation can be multilayered and affect different parts of the epidemiological cycle. One direct effect relates to the parasite itself. During its egg life-cycle stage, when the parasite is waiting to be ingested by an intermediate host, appropriate levels of humidity are essential for its development. Droughts or excessive humidity can disrupt or even kill the parasite at this stage (36). Additionally, the stability of temperature and precipitation can have indirect effects on the animal hosts involved in the transmission cycle of E. vogeli. Strong variations in climatic conditions may influence the behavior, distribution, and abundance of the intermediate and final hosts (37), affecting their susceptibility to infection and the overall transmission dynamics of the disease.
Regarding the role of QQ _T in the spillover model, seemingly linking a large amplitude of the QQ_T mode to an increased spillover risk, we illustrated how ENSO events disrupt hunting patterns in Pan-Amazonia, a fact that in turn probably entails changes in spillover risk of E. vogeli. The Amazon experiences seasonal changes in food sources, with fishing being dominant during dry seasons when rivers are low and fish are abundant and hunting becoming more prevalent during humid seasons when water levels are high and fishing becomes more challenging (38) (such seasonality of hunting can be seen in Fig. 6A). Warm ENSO events, which lead to drier conditions in southern Pan-Amazonia, favor fishing as the main food source, resulting in a decrease in hunting activities and likely lowering the spillover risk of E. vogeli to humans. Conversely, during La Niña events characterized by increased rainfall, hunting intensifies, potentially leading to higher rates of E. vogeli spillover. The MaxEnt spillover model identified stronger ENSO cycles and greater interannual dry–wet differences in the hotspots of E. vogeli transmission to humans. This suggests that ENSO-driven hunting peaks may contribute to outbreaks of E. vogeli spillover. This mechanistic hypothesis provides insight into how climate influences the transmission of E. vogeli and can potentially be generalized to other zoonotic diseases associated with hunting practices in Pan-Amazonia. In fact, a growing body of evidence supports the notion that ENSO extreme events are currently intensifying and are projected to further intensify due to global warming (39–41). Consequently, it can be inferred that climate change is indirectly driving the spillover of E. vogeli by amplifying ENSO variability.
Despite this apparent importance of hunting, which is also stressed by PE experts, the temporally flattened and spatially interpolated C. paca’s hunting pressure variable introduced in the MaxEnt models was surprisingly deemed unimportant by all models. The amount of hunting records used in this study is extensive but still insufficient to properly cover the whole area of Pan-Amazonia, a gap that interpolation procedures alone cannot correct. In addition, it is important to emphasize that one of the most important factors favoring E. vogeli spillover is precisely the hunter's behavior regarding the handling of lowland paca viscera. As a rule, the viscera that are not consumed by hunters and their families are discarded at the hunting site or in the rivers or forests near the community, but if infected viscera are given to dogs (or they manage to eat it) transmission risk largely increases. Such crucial behavioral information was not available and could not be incorporated in our models. Clearly, this is important information to be explored in future studies if such data become available.
One of the main limitations of this study was data scarcity and data reporting problems. PE is a truly neglected zoonotic disease and very few cases are documented both in wild hosts and humans. Furthermore, data quality could not be assessed as most of E. vogeli infection data (especially for humans) were not directly obtained by the authors of this study. The models used in the study heavily rely on the available data and any biases or limitations in the data can potentially result in biased results. Indeed, the data used in this study primarily consisted of passively diagnosed E. vogeli infections, which may only reflect the diagnosed cases and not the true extent of spillover risk.
Another limitation stemmed from the impossibility to retrieve the dates of infections, thus making analysis on the temporal domain impossible. However, given that some of the driving covariates had temporal information (climate, hunting), we could indeed explore their temporal patterns and identify some of the potential mechanisms underlying our findings, thus complementing the static results provided by MaxEnt. Overall, this study shows how attribution can be performed in a relatively low n scenario, with incomplete temporal information but with rich and detailed covariates and infection databases covering a large and diverse geographic area.
In this regard, this study introduces methodological modifications that could benefit the Ecological Niche Modeling (ENM) community. Most ENM users rely on WorldClim (42) as the main source of climatic data source, but never has climate variability and its changing trends been incorporated in an ecological niche model, despite time being very relevant in all spillover models. Traditionally, ENMs struggle with temporal integration due to their reliance on static input covariates. Previous attempts to address ENMs time-unspecificity include splitting species occurrence and climate data into seasonal components (43, 44), but in the end, this still meant working with mean and modal values, now across seasons instead of across years. In contrast, this study developed static variables that explicitly represent temporal changes, providing a different approach to incorporate time-dependent covariates into ENMs. Our approach serves as a preliminary step toward improving the integration of time-dependent covariates in ENMs, offering a starting point for future advancements in this area.
6. Conclusions
This study represents a significant advancement in the understanding and mapping of PE transmission hotspots, which has important implications for future interventions and control measures. By providing detailed maps of these hotspots, this study can guide targeted efforts to prevent and mitigate the transmission of the parasite, ultimately reducing the morbidity, mortality, and economic burden associated with the disease in the Pan-Amazonia region. On a larger scale and more conceptually, this study contributes to the broader understanding of the environmental and climatic factors driving PE transmission. It demonstrates that PE is a climate-modulated zoonotic disease in Pan-Amazonia in a seminal example of attribution. Additionally, our study reveals the influence of ENSO extreme events on hunting practices in the area, which has implications not only for PE but also for other hunting-related diseases. The changing nature and ongoing intensification of ENSO extreme events, although still subject to debate, are clearly prominent in current CMIP6 global warming projections. This enables a connection to be established between climate change and the spillover of E. vogeli. Consequently, our findings in this study provide one of the initial attributions of climate change effects on endemic NTDs in Pan-Amazonia.
These results also properly set the basis for the development of an early-warning system for PE. With the incorporation of land-use and climate projections, which we have identified as influential factors in shaping the disease dynamics, it becomes feasible to make informed extrapolations for future scenarios and should be the focus of further research. Overall, the findings presented in this study provide a solid basis for future research endeavors and data-driven approaches aimed at enhancing our understanding of the intricate pathways through which climate variability, climate change, and human activities intersect and impact zoonotic diseases in the Pan-Amazonia region and beyond.
7. Methods
7.1. Construction of Key Wild Hosts Habitat Suitability Maps.
Among the various animal species that can serve as intermediate hosts for E. vogeli, particular attention should be given to species that are regularly hunted, as they represent the interface through which E. vogeli can be transmitted to humans. This justifies our focus on studying the heavily hunted C. paca and, to a lesser extent, Dasypus novemcinctus as the key intermediate hosts. These two species are also the only wild intermediate hosts in which natural E. vogeli infections have been reported, likely due to their greater interaction with humans, which may introduce a positive bias in E. vogeli detection. It is important to note that in certain regions of the Pan-Amazonia, the disease may be sustained by other rodent intermediate hosts, something we are unable to capture and thus our final sylvatic circulation map is likely to be conservative. As for the final hosts, we will focus on both Speothos venaticus and Atelocynus microtis, the only known species capable of fulfilling this role.
To assess the habitat suitability of each key wild animal host involved in the sylvatic cycle of PE, we employed a series of correlative ENMs. Our approach aimed to obtain the most accurate estimate of their habitat suitability across the entire Pan-Amazonia. Rather than relying on a single algorithm, we employed an ensemble model consisting of six different algorithms (45). This is the best strategy when good model performance is primed. This strategy provides better results and is common practice in ENM studies and climate science (46, 47). The analyses were conducted using the R package dismo version 1.3.3 (48).
The covariates used in the ENMs included the WorldClim bioclimatic indicators (42) and elevation data, both at a resolution of 30 s (approximately 1 km at the equator). Initially, attempts were made to incorporate additional covariates such as biomass, canopy height, and forest cover. However, the resulting models did not show a significant improvement in predictive skill (refer to SI Appendix, Appendix 3 for detailed information). As a result, these covariates were ultimately excluded for the sake of simplicity. To address potential collinearity issues that can adversely affect model performance, a principal component analysis (PCA) was conducted and the covariate space was dimensionally reduced (49). For each animal species, the PCA was performed, and the minimum number of principal components necessary to explain 98% or more of the original variance was selected. (e.g., around five or six principal components for each animal species).
The presence records to run the ENMs were retrieved from a variety of sources, including public repositories like the Global Biodiversity Information Facility (GBIF) (https://www.gbif.org/) and SpeciesLink (https://specieslink.net/), as well as open datasets (26–29) and primary data obtained from hunting offtake records and interviews (SI Appendix, Figs. S2 and S3 and Appendix 1). To generate pseudoabsences, the dispersal range of each species (50) was used to create a buffer around the presence points. Pseudoabsences were then randomly selected within the remaining space, ensuring that they were not too far (<2° circle) from the presence points to better capture the inherent spatial bias in the presence records (51). The number of pseudoabsences was chosen to match the number of presence locations.
Given the potential arbitrariness of these decisions and the inherent uncertainties associated with pseudoabsences that affect all ENM studies, a careful selection of models was made to diversify both data requirements (we selected two presence-only models, one presence-background model, and three presence-pseudoabsence models) and algorithms (two climate envelope models, one linear model, and three machine learning models). For a comprehensive summary of all the models used and their characteristics, please refer to SI Appendix, Table S1.
To assess the performance of the submodels, 80% of the data was used for training them, while the remaining 20% was reserved for evaluating their out-of-fit behavior. All submodels were weighted based on their skill [using the formula (AUC-0.5)2 as long as AUC > 0.5, otherwise discarded] to finally derive the final model configuration for each species.
Given that C. paca and D. novemcinctus, on the one hand, as well as the wild dogs S. venaticus and A. microtis, on the other hand, fulfill, respectively, similar roles in the E. vogeli epidemiological cycle, we grouped them together by averaging their habitat suitability maps. The multimodel ensemble results for each specific species can be accessed in SI Appendix, Fig. S4. Using these results, we created a suitability map of the sylvatic circulation of E. vogeli, considering the parasite can only complete its life cycle where both intermediate and final hosts are present. To account for this common presence, we computed the geometric mean between intermediate hosts and final hosts, thus deriving the natural suitability of the disease (Fig. 2 A, Bottom). This variable will be utilized in the sylvatic and spillover maximum entropy models. Green areas in the map correspond to areas in which the parasite, if present, could circulate and establish a sylvatic cycle and therefore these results represent the natural boundaries (ecological and environmental) of the disease. Notably, the locations of animal infections with E. vogeli (which were not used in the construction of the maps) align closely with the selected areas on the map (indicated by blue points). For further details, please refer to the repository: https://gitlab.com/asanjopl/evogeli (Notebooks 1, 2, 3.1, 3.2, 3.3, and 3.4).
7.2. Construction of a Map Showing C. paca’s Hunting Pressure.
To incorporate the hunting pressure on key intermediate hosts, we used kriging to interpolate the hunting records, specifically the percentage of hunted intermediate hosts. As C. paca is the most commonly infected and hunted intermediate host according to available evidence (SI Appendix, Table S1), our analysis focused on this species. We grouped hunting studies that lasted for more than a year into 1 × 1° grids and calculated the overall ratio of C. paca hunted relative to the total hunt. This metric enabled us to compare the hunting pressure on C. paca across Pan-Amazonia regardless of variations in hunting efforts. Kriging was performed using an exponential function, which provided the best fit to the empirical semivariogram. Further details can be found in the repository, specifically in Notebook 4 and Fig. 2B for the final results.
7.3. Construction of Static Climate-Change Impact Variables.
As former studies suggest that climate variability and change can impact both disease emergence and spread (25), we created a set of layers capturing the last 30-y evolution and variability of temperature and AH in Pan-Amazonia. While climate variables have been commonly used as predictors in ENMs, most studies rely on WorldClim data, which represent 30-y averages and provide a snapshot of climatic stability and modal values (42). Instead, climate variability and the changing climate trends are precisely what are expected to affect pathogen spillover. Our study derives and incorporates such measures of our evolving climate into ENMs.
To do so, we obtained meteorological data from ERA5 reanalysis through API requests to the Copernicus Climate Data Store (CDS) and derived the last 30-y temperature and AH time series in Pan-Amazonia at a 0.25 × 0.25 resolution. SSA (31, 32) was performed in each grid cell to the 30-y time series to decompose them into trend, interannual variability, seasonal, and subseasonal variability components and noise. Given that the interannual variability was seen to be basically ENSO-driven (please refer to SI Appendix, Appendix 5 for extensive details), we proceeded to decompose it into its quasibiennial (QB) and a quasiquadrennial (QQ) modes (52). SSA is a two-stage process: First, it decomposes the original series into elementary separate orthogonal temporal components and then it groups them to derive the noise-free desired interpretable components. The whole procedure depends on two parameters, the embedding dimension and the elementary components’ grouping algorithm. We refer the reader to SI Appendix, Appendix 4 for details regarding the nuances of such methodological approach and the different choices performed and sensitivity analysis carried out.
Once decomposed, static values were retrieved for each grid cell for each variable in order to be used in the maximum entropy models: the total increase (trend[−1]-trend[0]) and the cumulative sum of the absolute value of the QB and QQ modes. Fig. 2C bottom shows final results for temperature trend. The remaining results can be checked in SI Appendix, Figs. S7 and S8.
Supplementary Material
Appendix 01 (PDF)
Acknowledgments
We acknowledge the Parc Amazonien de Guyane for conducting a large part of the hunting surveys in southern French Guiana. We also acknowledge Dr. Rémy Pignoux, Infectious Disease/Public Health specialist, for providing the E. vogeli infection evidence from French Guiana. A.S.-J. was supported by a fellowship from “la Caixa” Foundation, Spain (ID 100010434, fellowship code LCF/BQ/DR19/11740017). A.S.-J., B.C., and X.R. acknowledge the support from the grant CEX2018-000806-S funded by MCIN/AEI/10.13039/501100011033 and support from the Generalitat de Catalunya through the CERCA Program. M.A.O. was supported by Coordenação de Aperfeiçoamento de Pessoal de Nível Superior—Brasil for PNPD (88887.717863/2022-00). A.V.N. was supported by the Conselho Nacional de Desenvolvimento Científico e Tecnológico - CNPq (grant numbers 150102/2023-2).
Author contributions
A.S.-J., P.M., B.C., H.R.E.B., and X.R. conceptualized; A.S.-J., B.C., and X.R. modeling; A.S.-J., B.C., and X.R. formal analysis; P.M. and H-R.E.B. Secondary Data obtention; P.M., H.R.E.B., A.P.A., M.A.C., R.A., R.E.B., J.P.B., E.A.R.C., J.V.C.-S., P.A.L.C., M.J.d.P., A.L.J.D., T.F., L.A.G.-P., S.B.K., G.L., T.Q.M., L.M., G.F.M., D.P.M., A.V.N., P.P., M.A.O., J.C.B.P., C.R.-H., G.S., J.V., E.M.v.M., and J.B. Primary Data obtention; P.M. and J.B. Biological collection; L.A.G.-P. Histopathological diagnosis; and All authors are writing and editing the review.
Competing interests
The authors declare no competing interest.
Footnotes
Although PNAS asks authors to adhere to United Nations naming conventions for maps (https://www.un.org/geospatial/mapsgeo), our policy is to publish maps as provided by the authors.
This article is a PNAS Direct Submission.
Contributor Information
Adrià San-José, Email: adria.sanjose@isglobal.org.
Xavier Rodó, Email: xavier.rodo@isglobal.org.
Data, Materials, and Software Availability
All the code behind all the results and figures shown can be accessed in the following repository: https://gitlab.com/asanjopl/evogeli (53). PE infections data have been deposited in https://gitlab.com/asanjopl/evogeli/-/blob/main/input/EvogeliData/E_vogeli_infection_data.xlsx (54).
Supporting Information
References
- 1.Maudlin I., Eisler M. C., Welburn S. C., Neglected and endemic zoonoses. Philos. Trans. R. Soc. B Biol. Sci. 364, 2777–2787 (2009). [DOI] [PMC free article] [PubMed] [Google Scholar]
- 2.Halliday J. E. B., et al. , Endemic zoonoses in the tropics: A public health problem hiding in plain sight. Vet. Rec. 176, 220–225 (2015). [DOI] [PMC free article] [PubMed] [Google Scholar]
- 3.Carignano TORRES P., et al. , Landscape correlates of bushmeat consumption and hunting in a post-frontier Amazonian region. Environ. Conserv. 45, 315–323 (2018). [Google Scholar]
- 4.El Bizri H. R., et al. , Urban wild meat consumption and trade in central Amazonia. Conservation Biol. 34, 438–448 (2020). [DOI] [PubMed] [Google Scholar]
- 5.Mayor P., et al. , Wild meat trade over the last 45 years in the Peruvian Amazon. Conservation Biol. 36, e13801 (2022). [DOI] [PubMed] [Google Scholar]
- 6.Van Vliet N., et al. , Bushmeat and human health: Assessing the Evidence in tropical and sub-tropical forests. Ethnobiol. Conserv. (2017), 10.15451/ec2017-04-6.3-1-45. [DOI]
- 7.D’Alessandro A., Hidatidosis poliquística tropical por Echinococcus vogeli. Rev. Asoc. Méd. Argent 123, 16–23 (2010). [Google Scholar]
- 8.D’Alessandro A., Rausch R. L., New Aspects of Neotropical Polycystic ( Echinococcus vogeli) and Unicystic ( Echinococcus oligarthrus) Echinococcosis. Clin. Microbiol. Rev. 21, 380–401 (2008). [DOI] [PMC free article] [PubMed] [Google Scholar]
- 9.Piseddu T., et al. , The disease burden of human cystic echinococcosis based on HDRs from 2001 to 2014 in Italy. PLoS Negl. Trop. Dis. 11, e0005771 (2017). [DOI] [PMC free article] [PubMed] [Google Scholar]
- 10.WHO, Echinococcosis. https://www.who.int/news-room/fact-sheets/detail/echinococcosis.
- 11.Mayor P., et al. , Polycystic Echinococcosis in Pacas, Amazon Region, Peru. Emerg. Infect. Dis. 21, 456–459 (2015). [DOI] [PMC free article] [PubMed] [Google Scholar]
- 12.Deyber R. M. G. P. E., AQUINO, Tipos y formas de ambientes de dormir de majás (Cuniculus paca) en la cuenca alta del río Itaya. Rev. Peru Biol. 19, 27–34 (2012). [Google Scholar]
- 13.Beck-King H., von Helversen O., Beck-King R., Home range, population density, and food resources of Agouti Paca (Rodentia: Agoutidae) in Costa Rica: A study using alternative methods1. Biotropica 31, 675–685 (1999). [Google Scholar]
- 14.Figueroa-de León A., Naranjo E. J., Perales H., Santos-Moreno A., Lorenzo C., Availability and characterization of cavities used by pacas (Cuniculus paca) in the Lacandon Rainforest, Chiapas, Mexico. Rev. Mex. Biodivers. 87, 1062–1068 (2016). [Google Scholar]
- 15.Peres C. A., Effects of subsistence hunting on vertebrate community structure in Amazonian forests. Conserv. Biol. 14, 240–253 (2000). [Google Scholar]
- 16.Carlson C. J., et al. , Climate change increases cross-species viral transmission risk. Nature 607, 555–562 (2022). [DOI] [PubMed] [Google Scholar]
- 17.Martinez P., Canals M., Alvarado S., Cáceres D. D., Contribution of Anthropogenic Factors and Climate Variables to Human Cystic Echinococcosis Mortality in Chile (2001–2011). Vector-Borne and Zoonotic Dis. 20, 773–781 (2020). [DOI] [PubMed] [Google Scholar]
- 18.Cadavid Restrepo A. M., et al. , The landscape epidemiology of echinococcoses. Infect Dis Poverty 5, 13 (2016). [DOI] [PMC free article] [PubMed] [Google Scholar]
- 19.Gordon C. A., McManus D. P., Jones M. K., Gray D. J., Gobert G. N., The increase of exotic zoonotic helminth infections. Adv. Parasitol. 91, 311–397 (2016). [DOI] [PubMed] [Google Scholar]
- 20.Wardrop N. A., et al. , The influence of socio-economic, behavioural and environmental factors on Taenia spp. transmission in western Kenya: Evidence from a cross-sectional survey in humans and pigs. PLoS Negl. Trop. Dis. 9, e0004223 (2015). [DOI] [PMC free article] [PubMed] [Google Scholar]
- 21.Vizcaychipi K. A., et al. , Primera identificación de Echinococcus vogeli en una paca en la provincia de Misiones, Argentina. Rev. Argent Microbiol. 45, 169–173 (2013). [DOI] [PubMed] [Google Scholar]
- 22.Phillips S. J., Anderson R. P., Schapire R. E., Maximum entropy modeling of species geographic distributions. Ecol. Modell. 190, 231–259 (2006). [Google Scholar]
- 23.Merow C., Smith M. J., Silander J. A., A practical guide to MaxEnt for modeling species’ distributions: What it does, and why inputs and settings matter. Ecography 36, 1058–1069 (2013). [Google Scholar]
- 24.Romanello M., et al. , The 2021 report of the Lancet Countdown on health and climate change: Code red for a healthy future. The Lancet 398, 1619–1662 (2021). [DOI] [PMC free article] [PubMed] [Google Scholar]
- 25.Mora C., et al. , Over half of known human pathogenic diseases can be aggravated by climate change. Nat. Clim. Chang 12, 869–875 (2022). [DOI] [PMC free article] [PubMed] [Google Scholar]
- 26.Souza Y., et al. , ATLANTIC MAMMALS: A data set of assemblages of medium- and large-sized mammals of the Atlantic Forest of South America. Ecology 100, e02785 (2019). [DOI] [PubMed] [Google Scholar]
- 27.Nagy-Reis M., et al. , NEOTROPICAL CARNIVORES: A data set on carnivore distribution in the Neotropics. Ecology 101, e03128 (2020). [DOI] [PubMed] [Google Scholar]
- 28.Santos P. M., et al. , NEOTROPICAL XENARTHRANS: A data set of occurrence of xenarthran species in the Neotropics. Ecology 100, e02663 (2019). [DOI] [PubMed] [Google Scholar]
- 29.Grilo C., et al. , BRAZIL ROAD-KILL: A data set of wildlife terrestrial vertebrate road-kills. Ecology 99, 2625–2625 (2018). [DOI] [PubMed] [Google Scholar]
- 30.Doxsey-Whitfield E., et al. , Taking advantage of the improved availability of census data: A first look at the gridded population of the world, version 4. Papers. Appl. Geogr. 1, 226–234 (2015). [Google Scholar]
- 31.Golyandina N., Korobeynikov A., Zhigljavsky A., Singular Spectrum Analysis with R (Springer, Berlin Heidelberg, 2018). [Google Scholar]
- 32.Ghil M., et al. , Advanced spectral methods for climatic time series. Rev. Geophys. 40, 3-1-3–41 (2002). [Google Scholar]
- 33.Rodó X., Rodríguez-Arias M. -À., A new method to detect transitory signatures and local time/space variability structures in the climate system: The scale-dependent correlation analysis. Clim. Dyn. 27, 441–458 (2006). [Google Scholar]
- 34.Fontal A., Rodó X., Scale Dependent Correlation in Python (SDCPy). 10.5281/zenodo.8017203. Accessed 27 June 2023. [DOI]
- 35.Paredes O. S. L., Norris D., de Oliveira T. G., Michalski F., Water availability not fruitfall modulates the dry season distribution of frugivorous terrestrial vertebrates in a lowland Amazon forest. PLoS One 12, e0174049 (2017). [DOI] [PMC free article] [PubMed] [Google Scholar]
- 36.Lawson J. R., Gemmell M. A., Hydatidosis and cysticercosis: The dynamics of transmission. Adv. Parasitol. 22, 261–308 (1983). [DOI] [PubMed] [Google Scholar]
- 37.Bodmer R., et al. , Major shifts in Amazon wildlife populations from recent intensification of floods and drought. Conserv. Biol. 32, 333–344 (2018). [DOI] [PubMed] [Google Scholar]
- 38.Endo W., Peres C. A., Haugaasen T., Flood pulse dynamics affects exploitation of both aquatic and terrestrial prey by Amazonian floodplain settlements. Biol. Conserv. 201, 129–136 (2016). [Google Scholar]
- 39.Santoso A., et al. , Late-twentieth-century emergence of the El Niño propagation asymmetry and future projections. Nature 504, 126–130 (2013). [DOI] [PubMed] [Google Scholar]
- 40.Cai W., et al. , Increasing frequency of extreme El Niño events due to greenhouse warming. Nat. Clim. Chang 4, 111–116 (2014). [Google Scholar]
- 41.Latif M., Semenov V. A., Park W., Super El Niños in response to global warming in a climate model. Clim. Change 132, 489–500 (2015). [Google Scholar]
- 42.Fick S. E., Hijmans R. J., WorldClim 2: New 1-km spatial resolution climate surfaces for global land areas. Int. J. Climatol. 37, 4302–4315 (2017). [Google Scholar]
- 43.Ingenloff K., Peterson A. T., Incorporating time into the traditional correlational distributional modelling framework: A proof-of-concept using the Wood Thrush Hylocichla mustelina. Methods Ecol. Evol. 12, 311–321 (2021). [Google Scholar]
- 44.Soberon J., Peterson A. T., Interpretation of models of fundamental ecological niches and species’ distributional areas. Biodiv. Inform. 2 (2005). [Google Scholar]
- 45.Tebaldi C., Knutti R., The use of the multi-model ensemble in probabilistic climate projections. Philos. Trans. R. Soc. A Math. Phys. Eng. Sci. 365, 2053–2075 (2007). [DOI] [PubMed] [Google Scholar]
- 46.Valavi R., Guillera-Arroita G., Lahoz-Monfort J. J., Elith J., Predictive performance of presence-only species distribution models: A benchmark study with reproducible code. Ecol. Monogr. 92, e01486 (2022). [Google Scholar]
- 47.Qiao H., Soberón J., Peterson A. T., No silver bullets in correlative ecological niche modelling: Insights from testing among many potential algorithms for niche estimation. Methods Ecol. Evol. 6, 1126–1136 (2015). [Google Scholar]
- 48.Hijmans R. J., Phillips S., Leathwick J., Elith J., Package “dismo”. Circles 9, 1–68 (2017). [Google Scholar]
- 49.Dormann C. F., et al. , Collinearity: A review of methods to deal with it and a simulation study evaluating their performance. Ecography 36, 27–46 (2013). [Google Scholar]
- 50.Schloss C. A., Nuñez T. A., Lawler J. J., Dispersal will limit ability of mammals to track climate change in the Western Hemisphere. Proc. Natl. Acad. Sci. U.S.A. 109, 8606–8611 (2012). [DOI] [PMC free article] [PubMed] [Google Scholar]
- 51.Barbet-Massin M., Jiguet F., Albert C. H., Thuiller W., Selecting pseudo-absences for species distribution models: How, where and how many? Methods Ecol. Evol. 3, 327–338 (2012). [Google Scholar]
- 52.Jiang N., Neelin J. D., Ghil M., Quasi-quadrennial and quasi-biennial variability in the equatorial Pacific. Clim. Dyn. 12, 101–112 (1995). [Google Scholar]
- 53.San José A., Codes behind the paper. E vogeli Gitlab repository. https://gitlab.com/asanjopl/evogeli. Accessed 12 July 2023.
- 54.Mayor P., Bizri H., E vogeli available evidence. E vogeli evidence in humans and wild animals. https://gitlab.com/asanjopl/evogeli/-/blob/main/input/EvogeliData/E_vogeli_infection_data.xlsx. Accessed 12 July 2023.
Associated Data
This section collects any data citations, data availability statements, or supplementary materials included in this article.
Supplementary Materials
Appendix 01 (PDF)
Data Availability Statement
All the code behind all the results and figures shown can be accessed in the following repository: https://gitlab.com/asanjopl/evogeli (53). PE infections data have been deposited in https://gitlab.com/asanjopl/evogeli/-/blob/main/input/EvogeliData/E_vogeli_infection_data.xlsx (54).