

Abstract
Background & objectives:
Screening of individuals for early detection and identification of undiagnosed diabetes can help in reducing the burden of diabetic complications. This study aimed to evaluate the performance of Madras Diabetes Research Foundation (MDRF)-Indian Diabetes Risk Score (IDRS) to screen for undiagnosed type 2 diabetes in a large representative population in India.
Methods:
Data were acquired from the Indian Council of Medical Research–INdia DIABetes (ICMR–INDIAB) study, a large national survey that included both urban and rural populations from 30 states/union territories in India. Stratified multistage design was followed to obtain a sample of 113,043 individuals (94.2% response rate). MDRF-IDRS used four simple parameters, viz. age, waist circumference, family history of diabetes and physical activity to detect undiagnosed diabetes. Receiver operating characteristic (ROC) with area under the curve (AUC) was used to assess the performance of MDRF-IDRS.
Results:
We identified that 32.4, 52.7 and 14.9 per cent of the general population were under high-, moderate- and low-risk category of diabetes. Among the newly diagnosed individuals with diabetes [diagnosed by oral glucose tolerance test (OGTT)], 60.2, 35.9 and 3.9 per cent were identified under high-, moderate- and low-risk categories of IDRS. The ROC-AUC for the identification of diabetes was 0.697 (95% confidence interval: 0.684-0.709) for urban population and 0.694 (0.684-0.704) for rural, as well as 0.693 (0.682-0.705) for males and 0.707 (0.697-0.718) for females. MDRF-IDRS performed well when the population were sub-categorized by state or by regions.
Interpretation & conclusions:
Performance of MDRF-IDRS is evaluated across the nation and is found to be suitable for easy and effective screening of diabetes in Asian Indians.
Keywords: Asian Indians, high-risk group, Indian Diabetes Risk Score, screening, type 2 diabetes, undiagnosed diabetes
List of ICMR–INDIAB Investigators
ICMR-INDIAB Project National Coordinators, Investigators and Key Staff: Project Coordination (Madras Diabetes Research Foundation, Chennai, India): Drs Viswanathan Mohan (National Study Coordinator & Principal Investigator); Ranjit Mohan Anjana, Ranjit Unnikrishnan, Rajendra Pradeepa, Mohan Deepa, Ms Vasudev Sudha (National Co-Principal Investigator); Shri Elangovan Nirmal (Project Coordinator); Ms Radhakrishnan Subashini, Shri Ulagamathesan Venkatesan (Biostatistician).
ICMR–INDIAB Expert Group (in alphabetical order of place): Drs Jagadish Mahanta (Regional Medical Research Centre, Dibrugarh), L.M. Nath (Consultant in Community Medicine, New Delhi), R. Lakshmy, Nikhil Tandon (All India Institute of Medical Sciences, New Delhi), Arvind Pandey, R.S. Dhaliwal, Tanvir Kaur (Indian Council of Medical Research, New Delhi), Sri Venkata Madhu (University College of Medical Sciences & GTB Hospital, New Delhi), Ashok Kumar Das (Pondicherry Institute of Medical Sciences, Puducherry, India).
ICMR–INDIAB State Principal Investigators and Co-Investigators (in alphabetical order of State): Andhra Pradesh: Drs P.V. Rao, Nizam's Institute of Medical Sciences, Hyderabad (State PI), Modugu Nageswara Rao (State Co-PI); Arunachal Pradesh: Lobsang Jampa, Directorate of Health Services, Naharlagun, Government of Arunachal Pradesh (State PI), T. Kaki (State Co-PI); Assam: H.K. Das, Regional Medical Research Centre, Dibrugarh (State PI), P.K. Borah (State Co-PI); Bihar: Ajay Kumar, Diabetes Care & Research Centre, Kankerbagh, Patna (State PI), Smita Sharma (State Co-PI); Chhattisgarh: Kalpana Dash, Apollo Hospitals, Bilaspur (State PI), Vijay Kumar Shrivas (State Co-PI); Delhi: Nikhil Tandon, All India Institute of Medical Sciences, New Delhi (State PI), Anand Krishnan (State Co-PI); Goa: Ankush Desai, Goa Medical College, Bambolim (State PI), Dr Amit Dias (State Co-PI); Gujarat: Banshi Saboo, DIACARE, Ahmedabad (State PI), Jayendrasinh M. Padhiyar (State Co-PI); Haryana: Sanjay Kalra, Bharti Hospital, Karnal (State PI), Bharti Kalra (State Co-PI); Himachal Pradesh: Jatinder Kumar Moktha, Indira Gandhi Medical College, Shimla (State PI), Ramesh Gulepa (State Co-PI); Jharkhand: Dr V.K. Dhandhania, Diabetes Care Centre, Ranchi (State PI); Karnataka: Prabha Adhikari, Kasturba Medical College, Mangalore (State PI), B.Sathish Rao (State Co-PI); Kerala: P.K. Jabbar, Government Medical College, Trivandrum (State PI), C. Jayakumari (State Co-PI); Madhya Pradesh: Sunil M. Jain, TOTALL Diabetes Thyroid Hormone Research Institute Pvt Ltd. Indore (State PI), Gaurav Gupta (State Co-PI); Maharashtra: Shashank Joshi, Department of Diabetology & Endocrinology, Lilavati Hospital & Research Centre, Mumbai; Chittaranjan Yajnik, KEM Hospital, Pune & Prashant P. Joshi, Government Medical College, Nagpur (State PI); Manipur: Somorjit Ningombam, Loklaobung, Moirangkhom, Imphal (State PI), Th. Bhubhonchandra Singh (State Co-PI); Meghalaya: R.O. Budnah, Office of the Director of Health Services, Shillong (State PI), M.R. Basaiawmoit (State Co-PI); Mizoram: Rosangluaia, Civil Hospital, Aizawl (State PI), P.C. Lalramenga (State Co-PI); Nagaland: Vizolie Suokhrie, Directorate of Health & Family Welfare, Government of Nagaland, Kohima (State PI), Sao Tunyi (State Co-PI); Odisha: Saroj Kumar Tripathy, S.C.B. Medical College & Hospital, Cuttack (State PI), Nirmal Chandra Sahu (State Co-PI); Puducherry: Anil J. Purty, Pondicherry Institute of Medical Sciences, Kalapet (State PI), Ashok Kumar Das (State Co-PI); Punjab: Anil Bhansali, Postgraduate Institute of Medical Education & Research, Chandigarh (State PI), Mary John (State Co-PI); Rajasthan: Arvind Gupta, Jaipur Diabetes Research Centre, Jaipur (State PI), B. Lal Gupta & Sandeep K. Shrivastava (State Co-PIs); Sikkim: Karma Jigme Tobgay, Department of Healthcare, Human Services & Family Welfare, Government of Sikkim, Gangtok (State PI), Tempo Tsewang Kaleon (State Co-PI); Tamil Nadu: Viswanathan Mohan, Madras Diabetes Research Foundation, Chennai (National Co-ordinator & State PI), Ranjit Mohan Anjana, Rajendra Pradeepa, Mohan Deepa & Ms Vasudevan Sudha (State Co-PIs); Tripura: Taranga Reang, Government Medical College, Agartala (State PI), Swapan Kumar Das (State Co-PI); Uttar Pradesh: Sarita Bajaj, M.L.N. Medical College, Prayagraj (State PI), Manoj Kumar Mathur (State Co-PI); Uttarakhand: Sagar Modi, Himalayan Institute of Medical Sciences, Dehradun (State PI), Rakesh Kakkar (State Co-PI); West Bengal: Subhankar Chowdhury, Institute of Post Graduate Medical Education & Research & SSKM Hospital, Kolkata (State PI), Dr Sujoy Ghosh (State Co-PI).
Introduction
Diabetes mellitus affects more than 463 million people worldwide, with an estimated 4.2 million people dying each year from it due to complications1. While India accounts for one sixth of the world’s population with diabetes (77 million)1, with considerable occurence at younger age (45-64 yr), a significant proportion of the diabetic population experience complications at their productive years with serious economic and social burden. Early identification of individuals with undiagnosed diabetes is therefore critical in reducing the burden of diabetic complications. Several intervention studies have unequivocally demonstrated that type 2 diabetes can be effectively prevented by lifestyle changes in high-risk individuals2,3. The major task for public health administrations is to identify these high-risk individuals who would benefit from intensive lifestyle modification. However, ‘universal screening’, i.e. screening the entire population, is cumbersome and thus a cost-effective tool to selectively screen the high-risk groups would be necessary.
Development of the Indian Diabetes Risk Score (IDRS) developed by Madras Diabetes Research Foundation (MDRF), was a simple tool to aid early detection of undiagnosed diabetes in the community4. The MDRF-IDRS has also been shown to have additional multiple applications5, including predicting incident diabetes6, metabolic syndrome7, coronary artery disease8, non-alcoholic fatty liver disease9, sleep disorders10 and diabetic complications, such as peripheral vascular disease and neuropathy11, and help distinguish type 2 from non-type 2 diabetes12. The MDRF-IDRS has also been validated in several other populations13-25. However, it has not been validated in a large representative population in India. The Indian Council of Medical Research (ICMR)-INdia DIABetes (INDIAB) study provided an opportunity to evaluate the risk score in a large representative population and thereby help detect undiagnosed type 2 diabetes in the community.
Material & Methods
The ICMR-INDIAB study is a cross-sectional, population-based survey of adults aged 20 yr and above26,27. The methodological details of the study have been published elsewhere26. In brief, the study sampled urban and rural residents of all the 30 states/union territories (UTs) of the country such that the total estimated sample of 120,000 individuals was representative of the entire population. The study was conducted in a phased manner. In Phase I, four regions representing the south (Tamil Nadu), north (Chandigarh), east (Jharkhand) and west (Maharashtra) of the country were studied during 2008 to 2010. Between 2011 and 2020, the remaining states were surveyed as follows; Phase II covered Andhra Pradesh (undivided), Bihar, Gujarat, Karnataka and Punjab (survey period, 2012-2013), Phase III included Delhi, Madhya Pradesh, Rajasthan and Uttar Pradesh (survey period, 2017-2018), Phase IV included Kerala, Goa, Puducherry, Haryana and Chhattisgarh (survey period, 2018-2019), North East Phase included Assam, Arunachal Pradesh, Manipur, Meghalaya, Mizoram, Nagaland, Sikkim and Tripura (survey period, 2011-2017) and Phase V included Himachal Pradesh, Uttarakhand, Odisha and West Bengal (survey period, 2019-2020).
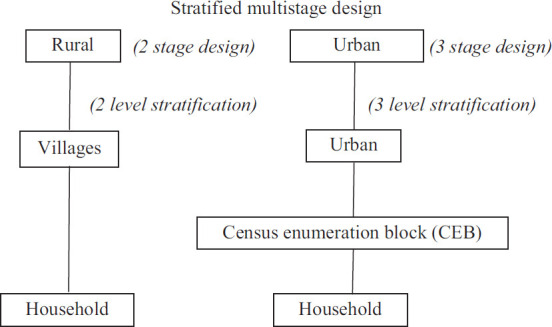
A stratified multistage sampling design was followed26, wherein a three-level stratification based on geography, population size, and socio-economic status of each state was done to obtain a truly representative sample of the population from different strata. The primary sampling units were villages in rural areas and census enumeration blocks in urban areas. The ultimate stage units were households in both areas. From each household, one individual was randomly selected using the World Health Organization KISH method28, thereby avoiding selection bias with respect to gender and age.
The calculated sample size of 4000 people (2800 rural + 1200 urban) provided 80 per cent power and a 5 per cent alpha error in each state, assuming a type 2 diabetes prevalence of 10 per cent in urban areas and 4 per cent in rural areas, with a 20 per cent non-response rate26. As a result, the overall sample size for the 30 states/UT was 120,000 people (4000×30); 113,043 individuals responded (94.2% response rate).
The analysis was conducted after excluding individuals with self-reported diabetes) on the pooled data of all the States/UTs (n=98,454), which included 28,150 urban residents and 70,304 rural residents. For the sub-analysis, the States/UTs were divided into six geographical regions as follows: North: Chandigarh, Delhi, Haryana, Himachal Pradesh, Punjab and Rajasthan; South: Andhra Pradesh (undivided), Karnataka, Kerala, Puducherry and Tamil Nadu; East: Bihar, Jharkhand, Odisha and West Bengal; West: Goa, Gujarat and Maharashtra; Central: Chhattisgarh, Madhya Pradesh, Uttar Pradesh and Uttaranchal and the North East: Arunachal Pradesh, Assam, Manipur, Meghalaya, Mizoram, Nagaland, Sikkim and Tripura.
A standardized, structured questionnaire was used to collect information on demographic and socio-economic characteristics, physical activity, smoking, alcohol, medical history and family history of diabetes. Fasting capillary blood glucose was determined using a glucose meter (One Touch Ultra, Lifescan Johnson & Johnson, Milpitas, California, USA) after ensuring at least eight hours of overnight fasting. In subjects with self-reported diabetes, only the fasting glucose was measured and was excluded from the current analysis. Equipment with same specifications was used throughout the study as a measure of quality assurance.
The study and the respective sites was approved by the Institutional Ethics Committee of the Madras Diabetes Research Foundation (MDRF), Chennai, Tamil Nadu, India, and written informed consent was obtained from all the participants.
Definitions: Self-reported/known diabetes was defined by a physician diagnosis of type 2 diabetes and current use of medications for diabetes (insulin or oral hypoglycaemic agents) and were excluded from the analysis. The MDRF-IDRS was developed using multiple logistic regression model based on four simple parameters, namely age, abdominal obesity, family history of diabetes and physical activity as described elsewhere4. The information for these risk factors was obtained based on four questions (Table I) and one anthropometric measurement, namely the waist circumference. Subjects with an MDRF-IDRS value of <30 was categorized as low risk, those between 30 and 50 as moderate risk and those with ≥60 as high risk for diabetes.
Table I.
Madras Diabetes Research Foundation-Indian Diabetes Risk Score (MDRF-IDRS)
| MDRF-IDRS | |
|---|---|
|
| |
| Particulars | Score |
| Age (yr) | |
| <35 | 0 |
| 35-49 | 20 |
| ≥50 | 30 |
| Waist circumference | |
| Waist <80 cm (female), <90 cm (male) | 0 |
| Waist ≥80-89 cm (female), ≥90-99 cm (male) | 10 |
| Waist ≥90 cm (female), ≥100 cm (male) | 20 |
| Physical activity | |
| Vigorous exercise (regular) or strenuous (manual) work at home/work | 0 |
| Moderate exercise (regular) or moderate physical activity at home/work | 10 |
| Mild exercise (regular) or mild physical activity at home/work | 20 |
| No exercise and sedentary activities at home/work | 30 |
| Family history of diabetes | |
| No diabetes in parents | 0 |
| One parent is diabetic | 10 |
| Both parents are diabetic | 20 |
| Total score | 100 |
IDRS score: ≥60 denotes high risk of having diabetes; 30-50 denotes moderate risk and <30 denotes that the risk of having diabetes is probably low
Statistical analysis: All statistical analysis was performed using SAS Statistical Package (version 9.4; SAS Institute, Inc., Cary, NC, USA). Estimates were expressed as mean±standard deviation or proportions. Linear regression and Cochran trend test were used used to find the trend across IDRS groups for continuous and categorical variables, respectively. Student’s t test was used to compare continuous variables and χ2 tests for differences in proportions. Receiver operating characteristic (ROC) with area under the curve (AUC) was used to assess the performance of MDRF-IDRS to diagnose diabetes; P<0.05 was considered significant.
Results
Table II presents the characteristics of the study population based on the MDRF-IDRS risk scoring as low, moderate and high for developing type 2 diabetes. The results show that females were more likely to have high-risk score for diabetes based on MDRF-IDRS than males, in both urban and rural areas. Individuals with high MDRF-IDRS were older, had significantly higher waist circumference, higher systolic and diastolic blood pressure, were less formally educated, had stronger family history of diabetes, were less physically active and had fewer proportion of smokers and alcohol users. A similar trend was seen when stratified in urban and rural areas.
Table II.
Characteristics of the study population stratified based on the MDRF-IDRS risk scoringa (30 states pooled)
| Variables | Urban | Rural | ||||||
|---|---|---|---|---|---|---|---|---|
|
|
|
|||||||
| Low IDRS score | Moderate IDRS score | High IDRS score | P for trend | Low IDRS score | Moderate IDRS score | High IDRS score | P for trend | |
| n | 2750 | 14,262 | 11,138 | 11,897 | 37,621 | 20,786 | ||
| Male, n (%) | 1409 (51.2) | 6744 (47.3) | 4603 (41.3) | <0.001 | 6807 (57.2) | 18,517 (49.2) | 8225 (39.6) | <0.001 |
| Age (yr) | 28.4±5.5 | 36.2±11.3 | 52.5±12.5 | <0.001 | 29.5±6.5 | 40±12.8 | 55.5±12.7 | <0.001 |
| BMI (kg/m2) | 21.7±3.6 | 22.8±4.2 | 25.5±4.9 | <0.001 | 20.9±3.1 | 21.7±3.9 | 23.6±4.8 | <0.001 |
| Waist circumference (cm) | ||||||||
| Male | 78.9±9.1 | 82.1±10.3 | 90.9±12.2 | <0.001 | 76.4±8.6 | 79.9±10.8 | 86±13.4 | <0.001 |
| Female | 73.8±8.6 | 78.5±11.3 | 88.6±11.8 | <0.001 | 71.5±8.5 | 75.2±11.1 | 84.3±12.9 | <0.001 |
| Systolic blood pressure (mmHg) | 121.4±14.4 | 124.8±17.5 | 134.9±21 | <0.001 | 122.9±13.9 | 126.2±17.1 | 134.8±21.1 | <0.001 |
| Diastolic blood pressure (mmHg) | 77.9±10.7 | 80.1±11.1 | 84±11.8 | <0.001 | 77.7±9.9 | 80.1±10.6 | 83.3±11.4 | <0.001 |
| Current smoking, n (%) | 362 (13.2) | 1749 (12.3) | 1065 (9.6) | <0.001 | 1884 (15.8) | 5977 (15.9) | 2814 (13.5) | <0.001 |
| Current alcohol users, n (%) | 431 (15.7) | 1894 (13.3) | 1060 (9.5) | <0.001 | 2129 (17.9) | 5507 (14.6) | 2074 (10.0) | <0.001 |
| Education, n (%) | ||||||||
| No formal schooling | 367 (13.4) | 1944 (13.6) | 2162 (19.4) | <0.001 | 2733 (23) | 11,018 (29.3) | 8279 (39.9) | <0.001 |
| Primary/high/higher secondary school | 1912 (69.6) | 9370 (65.8) | 6808 (61.2) | <0.001 | 8352 (70.3) | 23,303 (62.0) | 11,142 (53.6) | <0.001 |
| Technical/UG/PG education | 467 (17.0) | 2936 (20.6) | 2152 (19.3) | 0.476 | 799 (6.7) | 3264 (8.7) | 1348 (6.5) | 0.004 |
| Physical activity, n (%) | ||||||||
| Vigorous | 557 (20.3) | 356 (2.5) | 5 (0.04) | <0.001 | 4034 (33.9) | 2495 (6.6) | 8 (0.04) | <0.001 |
| Moderate | 2193 (79.7) | 4461 (31.3) | 639 (5.7) | <0.001 | 7863 (66.1) | 15,900 (42.3) | 974 (4.7) | <0.001 |
| Sedentary | 0 (0) | 9445 (66.2) | 10,494 (94.2) | <0.001 | 0 (0) | 19,226 (51.1) | 19,804 (95.3) | <0.001 |
| Family history of diabetes, n (%) | ||||||||
| One parent | 215 (7.8) | 1341 (9.4) | 1909 (17.2) | <0.001 | 417 (3.5) | 1783 (4.7) | 2019 (9.7) | <0.001 |
| Both parent | 2 (0.1) | 112 (0.8) | 320 (2.9) | <0.001 | 12 (0.1) | 109 (0.3) | 287 (1.4) | <0.001 |
Values are presented as number of subjects (percentage) or mean±SD as appropriate. aMDRF-IDRS risk score: <30 denotes that the risk of having diabetes is probably low; 30-50 denotes moderate risk and ≥60 denotes high risk of having diabetes. SD, standard deviation; BMI, body mass index
Table IIIa shows the MDRF-IDRS risk stratification by different regions of the nation. In the overall population, 14.9 per cent were in the low-risk category of MDRF-IDRS, 52.7 per cent in the moderate-risk category and 32.4 per cent in the high-risk category. It varied by regions, with the southern (38.9%) and the northern (38.3%) region having highest proportion of individuals with high MDRF-IDRS and eastern (25.4%) region having the lowest proportion of individuals with high MDRF-IDRS. A similar trend was observed when the regions were stratified as urban and rural areas (Table IIIb).
Table IIIa.
MDRF-IDRSa in the study population by regions
| MDRF-IDRS classification | North | South | East | West | Central | North East | Overall |
|---|---|---|---|---|---|---|---|
| n | 22,950 | 15,047 | 11,197 | 13,577 | 7011 | 28,672 | 98,454 |
| Low risk, n(%) | 2572 (11.2) | 1923 (12.8) | 2104 (18.8) | 1688 (12.4) | 1329 (19.0) | 5031 (17.5) | 14,647 (14.9) |
| Moderate risk, n(%) | 11,590 (50.5) | 7277 (48.4) | 6246 (55.8) | 7081 (52.2) | 3780 (53.9) | 15,909 (55.5) | 51,883 (52.7) |
| High risk, n(%) | 8788 (38.3) | 5847 (38.9) | 2847 (25.4) | 4808 (35.4) | 1902 (27.1) | 7732 (27.0) | 31,924 (32.4) |
aMDRF-IDRS risk score: <30 denotes that the risk of having diabetes is probably low; 30-50 denotes moderate risk and ≥60 denotes high risk of having diabetes. North: Chandigarh, Delhi, Haryana, Himachal Pradesh, Punjab, Uttarakhand and Uttar Pradesh; South: Andhra Pradesh (undivided), Karnataka, Kerala, Puducherry and Tamil Nadu; East, Bihar, Orissa, Jharkhand and West Bengal; West: Rajasthan, Gujarat, Goa and Maharashtra; Central: Madhya Pradesh and Chhattisgarh; North East: Assam, Sikkim, Nagaland, Meghalaya, Manipur, Mizoram, Tripura and Arunachal Pradesh
Table IIIb.
MDRF-IDRSa in the study population by regions - urban versus rural
| MDRF-IDRS classification | Urban | Rural | ||||||||||||
|---|---|---|---|---|---|---|---|---|---|---|---|---|---|---|
|
|
|
|||||||||||||
| North (n=6567) | South (n=4290) | East (n=3151) | West (n=3990) | Central (n=1948) | North East (n=8204) | Total (n=28,150) | North (n=16,383) | South (n=10,757) | East (n=8046) | West (n=9587) | Central (n=5063) | North East (n=20,468) | Total (n=70,304) | |
| (100) | ||||||||||||||
| Low risk | 517 (7.9) | 355 (8.3) | 450 (14.3) | 343 (8.6) | 221 (11.3) | 864 (10.5) | 2750 (9.8) | 2055 (12.5) | 1568 (14.6) | 1654 (20.6) | 1345 (14.0) | 1108 (21.9) | 4167 (20.4) | 11,897 (16.9) |
| Moderate risk | 3149 (48.0) | 2023 (47.2) | 1585 (50.3) | 2013 (50.5) | 1004 (51.5) | 4488 (54.7) | 14,262 (50.7) | 8441 (51.5) | 5254 (48.8) | 4661 (57.9) | 5068 (52.9) | 2776 (54.8) | 11,421 (55.8) | 37,621 (53.5) |
| High risk | 2901 (44.2) | 1912 (44.6) | 1116 (35.4) | 1634 (41.0) | 723 (37.1) | 2852 (34.8) | 11,138 (39.6) | 5887 (35.9) | 3935 (36.6) | 1731 (21.5) | 3174 (33.1) | 1179 (23.3) | 4880 (23.8) | 20,786 (29.6) |
Values are presented as n (%). aMDRF-IDRS risk score: <30 denotes that the risk of having diabetes is probably low; 30-50 denotes moderate risk and ≥60 denotes high risk of having diabetes. North: Chandigarh, Delhi, Haryana, Himachal Pradesh, Punjab, Uttarakhand and Uttar Pradesh; South: Andhra Pradesh (undivided), Karnataka, Kerala, Puducherry and Tamil Nadu; East, Bihar, Orissa, Jharkhand and West Bengal; West: Rajasthan, Gujarat, Goa and Maharashtra; Central: Madhya Pradesh and Chhattisgarh; North East: Assam, Sikkim, Nagaland, Meghalaya, Manipur, Mizoram, Tripura and Arunachal Pradesh
The ROC curve showing the performance of MDRF-IDRS in diagnosing diabetes among the urban and rural population and by gender is presented in Figures 1 and 2. The ROC-AUC of the MDRF-IDRS for identification of diabetes was 0.697 (95% confidence interval: 0.684-0.709) for urban and 0.694 (0.684-0.704) for rural, as well as 0.693 (0.682-0.705) for males and 0.707 (0.697-0.718) for females.
Fig. 1.
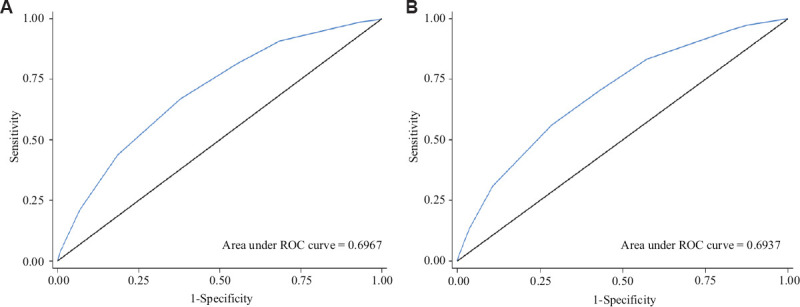
ROC curve showing the performance of MDRF-IDRS among the (A) urban and (B) rural population in diagnosing diabetes. ROC, receiver operating characteristic; MDRF-IDRS, Madras Diabetes Research Foundation-Indian Diabetes Risk Score.
Fig. 2.

ROC curve showing the performance of MDRF-IDRS among (A) male and (B) female population in diagnosing diabetes. ROC, receiver operating characteristic; MDRF-IDRS, Madras Diabetes Research Foundation-Indian Diabetes Risk Score.
An attempt was made to determine how many of the newly diagnosed diabetic subjects found in the study using OGTT were correctly identified by MDRF-IDRS (Table IV). Of all the newly diagnosed individuals with diabetes (by OGTT), 60.2 per cent were identified as having high risk, 35.9 per cent as having moderate risk and 3.9 per cent as having low risk by the MDRF-IDRS. Over 96 per cent of all newly diagnosed diabetic subjects were identified as having either moderate or high risk by MDRF-IDRS. The values ranged from 92.1 per cent in the central region to 97.8 per cent in the southern region. In the overall population, MDRF-IDRS has a sensitivity of 60.2 per cent, specificity of 68.8 per cent, positive predictive value of 8.1 per cent, negative predictive value of 97.4 per cent and accuracy of 68.5 per cent in identifying diabetes. A similar analysis was performed among individuals with self-reported diabetes, where 98.9 per cent of them were categorized by MDRF-IDRS as moderate/high-risk group (Supplementary Table I). Of the individuals with pre-diabetes (diagnosed by OGTT), 45.6 per cent were identified as having high risk, 45.7 per cent as having moderate risk and 8.7 per cent as having low risk for pre-diabetes by MDRF-IDRS. Overall, 91.3 per cent of all individuals with pre-diabetes were identified as having either moderate/high risk by MDRF-IDRS (Supplementary Table II).
Table IV.
Proportion of diabetic subjects identified by the MDRF-IDRSa in the study population – by regions
| MDRF-IDRS classification and test performance | North | South | East | West | Central | North East | Total |
|---|---|---|---|---|---|---|---|
| Newly diagnosed diabetes, n | 1090 | 851 | 471 | 661 | 279 | 951 | 4303 |
| Low risk, n (%) | 33 (3.0) | 19 (2.2) | 30 (6.4) | 24 (3.6) | 22 (7.9) | 39 (4.1) | 167 (3.9) |
| Moderate risk, n (%) | 342 (31.4) | 264 (31.0) | 201 (42.7) | 230 (34.8) | 114 (40.9) | 396 (41.6) | 1547 (35.9) |
| High risk, n (%) | 715 (65.6) | 568 (66.7) | 240 (51.0) | 407 (61.6) | 143 (51.3) | 516 (54.3) | 2589 (60.2) |
| Combined moderate/high risk, n (%) | 1057 (97.0) | 832 (97.8) | 441 (93.6) | 637 (96.4) | 257 (92.1) | 912 (95.9) | 4136 (96.1) |
| Sensitivity, per cent | 65.60 | 66.75 | 50.96 | 61.57 | 66.97 | 54.26 | 60.17 |
| Specificity, per cent | 63.07 | 62.81 | 75.69 | 65.93 | 64.65 | 73.97 | 68.84 |
| Positive predictive value, per cent | 8.14 | 9.71 | 8.43 | 8.47 | 10.10 | 6.67 | 8.11 |
| Negative predictive value, per cent | 97.35 | 96.92 | 97.23 | 97.10 | 97.06 | 97.92 | 97.42 |
| Accuracy, per cent | 63.19 | 63.04 | 74.65 | 65.71 | 72.97 | 73.32 | 68.46 |
aMDRF-IDRS risk score: <30 denotes that the risk of having diabetes is probably low; 30-50 denotes moderate risk and ≥60 denotes high risk of having diabetes. North: Chandigarh, Delhi, Haryana, Himachal Pradesh, Punjab, Uttarakhand and Uttar Pradesh; South: Andhra Pradesh (undivided), Karnataka, Kerala, Puducherry and Tamil Nadu; East: Bihar, Orissa, Jharkhand and West Bengal; West: Rajasthan, Gujarat, Goa and Maharashtra; Central, Madhya Pradesh and Chhattisgarh; North East: Assam, Sikkim, Nagaland, Meghalaya, Manipur, Mizoram, Tripura and Arunachal Pradesh
Supplementary Table I.
Proportion of self-reported individuals with diabetes identified by the Madras Diabetes Research Foundation-Indian Diabetes Risk Score (MDRF-IDRS)a in the study population – by regions
| MDRF-IDRS classification and test performance | North | South | East | West | Central | North East | Total |
|---|---|---|---|---|---|---|---|
| Self-reported diabetes, n | 1271 | 1606 | 541 | 951 | 270 | 1073 | 5712 |
| Low risk, n (%) | 11 (0.9) | 11 (0.7) | 12 (2.2) | 9 (0.9) | 5 (1.9) | 15 (1.4) | 63 (1.1) |
| Moderate risk, n (%) | 221 (17.4) | 328 (20.4) | 160 (29.6) | 126 (13.2) | 71 (26.3) | 310 (28.9) | 1216 (21.3) |
| High risk, n (%) | 1039 (81.7) | 1267 (78.9) | 369 (68.2) | 816 (85.8) | 194 (71.9) | 748 (69.7) | 4433 (77.6) |
| Combined moderate/high risk, n (%) | 1260 (99.1) | 1595 (99.3) | 529 (97.8) | 942 (99.1) | 265 (98.1) | 1058 (98.6) | 5649 (98.9) |
| Sensitivity, % | 81.75 | 78.89 | 68.21 | 85.80 | 83.54 | 69.71 | 77.61 |
| Specificity, % | 63.07 | 62.81 | 75.69 | 65.93 | 64.65 | 73.97 | 68.84 |
| Positive predictive value, % | 11.40 | 19.36 | 12.40 | 15.64 | 16.88 | 9.39 | 13.13 |
| Negative predictive value, % | 98.35 | 96.34 | 97.93 | 98.44 | 97.86 | 98.44 | 98.06 |
| Accuracy, per cent | 64.10 | 64.45 | 75.34 | 67.29 | 73.79 | 73.81 | 69.34 |
aMDRF-IDRS risk score: <30 denotes that the risk of having diabetes is probably low; 30-50 denotes moderate risk and ≥60 denotes high risk of having diabetes. North: Chandigarh, Delhi, Haryana, Himachal Pradesh, Punjab, Uttarakhand and Uttar Pradesh; South: Andhra Pradesh (undivided), Karnataka, Kerala, Puducherry and Tamil Nadu; East: Bihar, Orissa, Jharkhand and West Bengal; West: Rajasthan, Gujarat, Goa and Maharashtra; Central: Madhya Pradesh and Chhattisgarh; North East: Assam, Sikkim, Nagaland, Meghalaya, Manipur, Mizoram, Tripura and Arunachal Pradesh
Supplementary Table II.
Proportion of individuals with pre-diabetes identified by the MDRF-IDRSa in the study population by regions
| MDRF-IDRS classification and test performance | North | South | East | West | Central | North East | Total |
|---|---|---|---|---|---|---|---|
| Pre-diabetes, n | 3733 | 2631 | 1586 | 2152 | 1436 | 3958 | 15496 |
| Low risk, n (%) | 266 (7.2) | 130 (5.2) | 154 (9.8) | 146 (6.8) | 215 (15.1) | 416 (10.6) | 1327 (8.7) |
| Moderate risk, n (%) | 1646 (44.8) | 982 (39.3) | 777 (49.5) | 898 (42) | 715 (50.2) | 1933 (49.3) | 6951 (45.7) |
| High risk, n (%) | 1761 (47.9) | 1384 (55.4) | 639 (40.7) | 1093 (51.1) | 494 (34.7) | 1571 (40.1) | 6942 (45.6) |
| Combined moderate/high risk, n (%) | 3407 (92.8) | 2366 (94.8) | 1416 (90.2) | 1991 (93.2) | 1209 (84.9) | 3504 (89.4) | 13,893 (91.3) |
| Sensitivity, % | 47.94 | 55.45 | 40.70 | 51.15 | 34.69 | 40.08 | 45.61 |
| Specificity, % | 65.29 | 66.71 | 78.51 | 69.31 | 76.17 | 76.28 | 71.63 |
| Positive predictive value, % | 21.81 | 26.22 | 24.51 | 24.84 | 28.08 | 21.77 | 23.66 |
| Negative predictive value, % | 86.13 | 87.53 | 88.53 | 87.74 | 81.30 | 88.54 | 87.23 |
| Accuracy, % | 61.05 | 62.95 | 71.97 | 64.95 | 66.65 | 70.32 | 66.22 |
aMDRF-IDRS risk score: <30 denotes that the risk of having diabetes is probably low; 30-50 denotes moderate risk and ≥60 denotes high risk of having diabetes. North: Chandigarh, Delhi, Haryana, Himachal Pradesh, Punjab, Uttarakhand and Uttar Pradesh; South: Andhra Pradesh (undivided), Karnataka, Kerala, Puducherry and Tamil Nadu; East, Bihar, Orissa, Jharkhand and West Bengal; West: Rajasthan, Gujarat, Goa and Maharashtra; Central: Madhya Pradesh and Chhattisgarh; North East: Assam, Sikkim, Nagaland, Meghalaya, Manipur, Mizoram, Tripura and Arunachal Pradesh
Supplementary Table III presents the proportion of newly diagnosed diabetic subjects identified by MDRF-IDRS in the study population by individual states. MDRF-IDRS performed well in all states and did extremely well in the state of Goa where 100 per cent of the individuals, diagnosed as diabetes by OGTT, were categorized as either at high or moderate risk by MDRF-IDRS. MDRF-IDRS performed least in the state of Jharkhand where it identified 85.4 per cent of the cases as high/moderate risk. When stratified as urban or rural areas, MDRF-IDRS identifies 100 per cent of all subjects with diabetes as high/moderate risk in many urban areas of the states, including Andhra Pradesh (undivided), Assam, Goa, Haryana, Manipur, Mizoram, Nagaland, Odisha, Punjab, Sikkim and Tripura, and a few rural areas of the states, such as Goa and Rajasthan.
Supplementary Table III.
Proportion of individuals with diabetes identified by the MDRF-IDRSa in the study population (state wise)
| States/Union Territories | Urban | Rural | Overall | |||||||||
|---|---|---|---|---|---|---|---|---|---|---|---|---|
|
|
|
|
||||||||||
| n | Low | Moderate | High | n | Low | Moderate | High | n | Low | Moderate | High | |
| Andhra Pradesh (undivided) | 29 | 0 (0) | 4 (13.8) | 25 (86.2) | 41 | 1 (2.4) | 13 (31.7) | 27 (65.9) | 70 | 1 (1.4) | 17 (24.3) | 52 (74.3) |
| Arunachal Pradesh | 46 | 2 (4.3) | 22 (47.8) | 22 (47.8) | 82 | 11 (13.4) | 38 (46.3) | 33 (40.2) | 128 | 13 (10.2) | 60 (46.9) | 55 (43.0) |
| Assam | 40 | 0 (0) | 14 (35.0) | 26 (65.0) | 54 | 1 (1.9) | 31 (57.4) | 22 (40.7) | 94 | 1 (1.1) | 45 (47.9) | 48 (51.1) |
| Bihar | 61 | 2 (3.3) | 22 (36.1) | 37 (60.7) | 48 | 2 (4.2) | 22 (45.8) | 24 (50.0) | 109 | 4 (3.7) | 44 (40.4) | 61 (56.0) |
| Chandigarh | 64 | 1 (1.6) | 20 (31.3) | 43 (67.2) | 115 | 9 (7.8) | 47 (40.9) | 59 (51.3) | 179 | 10 (5.6) | 67 (37.4) | 102 (57.0) |
| Chhattisgarh | 53 | 2 (3.8) | 19 (35.8) | 32 (60.4) | 112 | 10 (8.9) | 55 (49.1) | 47 (42.0) | 165 | 12 (7.3) | 74 (44.8) | 79 (47.9) |
| Delhi | 59 | 1 (1.7) | 15 (25.4) | 43 (72.9) | 128 | 5 (3.9) | 43 (33.6) | 80 (62.5) | 187 | 6 (3.2) | 58 (31.0) | 123 (65.8) |
| Goa | 103 | 0 (0) | 22 (21.4) | 81 (78.6) | 174 | 0 (0) | 45 (25.9) | 129 (74.1) | 277 | 0 (0) | 67 (24.2) | 210 (75.8) |
| Gujarat | 37 | 5 (13.5) | 4 (10.8) | 28 (75.7) | 56 | 4 (7.1) | 33 (58.9) | 19 (33.9) | 93 | 9 (9.7) | 37 (39.8) | 47 (50.5) |
| Haryana | 84 | 0 (0) | 22 (26.2) | 62 (73.8) | 133 | 3 (2.3) | 31 (23.3) | 99 (74.4) | 217 | 3 (1.4) | 53 (24.4) | 161 (74.2) |
| Himachal Pradesh | 58 | 2 (3.4) | 15 (25.9) | 41 (70.7) | 139 | 1 (0.7) | 45 (32.4) | 93 (66.9) | 197 | 3 (1.5) | 60 (30.5) | 134 (68.0) |
| Jharkhand | 42 | 4 (9.5) | 18 (42.9) | 20 (47.6) | 47 | 9 (19.1) | 28 (59.6) | 10 (21.3) | 89 | 13 (14.6) | 46 (51.7) | 30 (33.7) |
| Karnataka | 52 | 2 (3.8) | 17 (32.7) | 33 (63.5) | 81 | 3 (3.7) | 29 (35.8) | 49 (60.5) | 133 | 5 (3.8) | 46 (34.6) | 82 (61.7) |
| Kerala | 71 | 2 (2.8) | 9 (12.7) | 60 (84.5) | 146 | 1 (0.7) | 29 (19.9) | 116 (79.5) | 217 | 3 (1.4) | 38 (17.5) | 176 (81.1) |
| Madhya Pradesh | 56 | 1 (1.8) | 14 (25.0) | 41 (73.2) | 58 | 9 (15.5) | 26 (44.8) | 23 (39.7) | 114 | 10 (8.8) | 40 (35.1) | 64 (56.1) |
| Maharashtra | 73 | 2 (2.7) | 33 (45.2) | 38 (52.1) | 112 | 11 (9.8) | 54 (48.2) | 47 (42.0) | 185 | 13 (7.0) | 87 (47.0) | 85 (45.9) |
| Manipur | 32 | 0 (0) | 12 (37.5) | 20 (62.5) | 45 | 2 (4.4) | 22 (48.9) | 21 (46.7) | 77 | 2 (2.6) | 34 (44.2) | 41 (53.2) |
| Meghalaya | 32 | 1 (3.1) | 13 (40.6) | 18 (56.3) | 51 | 4 (7.8) | 24 (47.1) | 23 (45.1) | 83 | 5 (6.0) | 37 (44.6) | 41 (49.4) |
| Mizoram | 42 | 0 (0) | 14 (33.3) | 28 (66.7) | 63 | 1 (1.6) | 25 (39.7) | 37 (58.7) | 105 | 1 (1.0) | 39 (37.1) | 65 (61.9) |
| Nagaland | 36 | 0 (0) | 7 (19.4) | 29 (80.6) | 46 | 2 (4.3) | 12 (26.1) | 32 (69.6) | 82 | 2 (2.4) | 19 (23.2) | 61 (74.4) |
| Odisha | 38 | 0 (0) | 21 (55.3) | 17 (44.7) | 63 | 7 (11.1) | 31 (49.2) | 25 (39.7) | 101 | 7 (6.9) | 52 (51.5) | 42 (41.6) |
| Puducherry | 92 | 3 (3.3) | 23 (25.0) | 66 (71.7) | 190 | 3 (1.6) | 72 (37.9) | 115 (60.5) | 282 | 6 (2.1) | 95 (33.7) | 181 (64.2) |
| Punjab | 40 | 0 (0) | 9 (22.5) | 31 (77.5) | 101 | 6 (5.9) | 38 (37.6) | 57 (56.4) | 141 | 6 (4.3) | 47 (33.3) | 88 (62.4) |
| Rajasthan | 46 | 2 (4.3) | 15 (32.6) | 29 (63.0) | 60 | 0 (0) | 24 (40.0) | 36 (60.0) | 106 | 2 (1.9) | 39 (36.8) | 65 (61.3) |
| Sikkim | 70 | 0 (0) | 26 (37.1) | 44 (62.9) | 138 | 7 (5.1) | 54 (39.1) | 77 (55.8) | 208 | 7 (3.4) | 80 (38.5) | 121 (58.2) |
| Tamil Nadu | 53 | 3 (5.7) | 19 (35.8) | 31 (58.5) | 96 | 1 (1.0) | 49 (51.0) | 46 (47.9) | 149 | 4 (2.7) | 68 (45.6) | 77 (51.7) |
| Tripura | 70 | 0 (0) | 30 (42.9) | 40 (57.1) | 104 | 8 (7.7) | 52 (50.0) | 44 (42.3) | 174 | 8 (4.6) | 82 (47.1) | 84 (48.3) |
| Uttar Pradesh | 19 | 2 (10.5) | 6 (31.6) | 11 (57.9) | 31 | 1 (3.2) | 11 (35.5) | 19 (61.3) | 50 | 3 (6.0) | 17 (34.0) | 30 (60.0) |
| Uttaranchal | 49 | 1 (2) | 11 (22.4) | 37 (75.5) | 70 | 1 (1.4) | 29 (41.4) | 40 (57.1) | 119 | 2 (1.7) | 40 (33.6) | 77 (64.7) |
| West Bengal | 67 | 2 (3) | 18 (26.9) | 47 (70.1) | 105 | 4 (3.8) | 41 (39.0) | 60 (57.1) | 172 | 6 (3.5) | 59 (34.3) | 107 (62.2) |
| Overall | 1614 | 40 (2.5) | 494 (30.6) | 1080 (66.9) | 2689 | 127 (4.7) | 1053 (39.2) | 1509 (56.1) | 4303 | 167 (3.9) | 1547 (36.0) | 2589 (60.2) |
Values are presented as number of subjects (%). aMDRF-IDRS risk score: <30 denotes that the risk of having diabetes is probably low; 30-50 denotes moderate risk and ≥60 denotes high risk of having diabetes
Discussion
The key findings of the study include the following: (i) based on the MDRF-IDRS, 32.4 per cent of the general population in India falls under high-risk category of developing type 2 diabetes; (ii) of all the newly diagnosed individuals with diabetes (diagnosed by OGTT), MDRF-IDRS identified 96.1 per cent of the population as having high/moderate risk and 3.9 per cent as having low risk for diabetes; (iii) MDRF-IDRS also performed well in urban and rural strata and also in state/ regions.
Diabetes risk scores are risk assessment tools use a combination of demographic and clinical information. Although globally several such risk scores exist29-38, their applicability to other populations is uncertain in different ethnic groups and sociocultural settings. The IDRS developed by MDRF4 used routinely collected, minimal information making the risk score simple, fast and more importantly, non-invasive. The variables included in MDRF-IDRS are age, waist circumference, physical activity levels and family history of diabetes. Through this approach, targeted screening with non-invasive test is done for the identification of high risk groups, followed by glucose testing only in high risk individuals.
Although several risk scores available, there is no consensus on the gold-standard tools that should be used in practice. Each of these risk scores uses varying combinations of risk factors. Diabetes risk scores have also been used to predict diabetes in various populations, such as Finnish Diabetes Risk Score (FINDRISC), Finland29, Danish Diabetes Risk Score, Denmark30, Data from the Epidemiological Study on the Insulin Resistance Syndrome, France31, American Atherosclerosis Risk in Communities (ARIC), four US communities32 and Cambridge Risk Score (CRS), England33 among others34,35. The sensitivity and specificity of these scores varied widely: FINDRISC29 (78% sensitivity and 77% specificity in the 1987 cohort and 81% sensitivity and 76% specificity in the 1992 cohort), DANISH30 (76% sensitivity and 72% specificity), ARIC32 (52% sensitivity and 86% specificity) and CRS33 (77% sensitivity and 72% specificity). The variables included in the risk scores are age, sex, ethnicity, body mass index (BMI), waist circumference, history of antihypertensive drug treatment, use of corticosteroids, hypertension, physical activity, family history of diabetes, smoking status, daily consumption of fruits, berries or vegetables29-35.
Risk scores developed in one population may not perform well when applied to other population. There are a few other diabetes risk scores specific for Indian population. The diabetes risk score by Ramachandran et al36 included age, BMI, waist circumference, physical activity levels and history of diabetes and yielded sensitivity of around 70 per cent and specificity of around 60 per cent in three tested cohorts in Chennai, Tamil Nadu. Chaturvedi et al37 included age, waist circumference, blood pressure and family history of diabetes, which had 73 per cent sensitivity but only 56 per cent specificity. Oommen et al38 included age, waist circumference and family history of diabetes and reported 59.5 per cent sensitivity and 60.5 per cent specificity. The applicability of the risk score to a different population is uncertain given the differences in risk factor distribution, such as varying degrees of obesity, lifestyle factors and other cultural differences. As cited above, all the risk scores had similar sensitivity and specificity and used similar clinical characteristics.
The applicability of MDRF-IDRS has also been extensively validated in several Indian populations13-25 (Supplementary Table IV). Some studies16,21 reported that the MDRF-IDRS had good predictive value for detecting undiagnosed diabetes in the community and also suggested alternative score for MDRF-IDRS, with better sensitivity and specificity. Some studies14,15,17-20,25 used MDRF-IDRS in classifying the study population at risk as low, moderate and high. Despite such studies validating the applicability of MDRF-IDRS, a number of issues limit their utility, such as small sample size, lack of representative sample questioning the generalizability of the results to the larger population, differences in study design/methodology used, lack of external validation and referral bias. The ICMR-INDIAB study, by using standardized protocol and uniform data collection procedures, provided precise details on the variation in the sensitivity in different regions of India – with the highest sensitivity being recorded in central India (67%) and lowest in eastern region (51%). Apart from the differences in the characteristics of the population studied in the different regions/states, the modest performance of the MDRF-IDRS risk score in the INDIAB population could be attributed to the data quality on the variable, ‘family history of diabetes’. Although it is known that the knowledge of family history of diabetes may influence lifestyle behaviours of the individual, the reliability of the family history data is unclear. The level of awareness of individual’s family history is unknown in our population, which is one of the limitations of this study.
Supplementary Table IV.
Validation of MDRF-IDRS in various studies
| Author, yr | Place of study | Study population | Sample size | Findings |
|---|---|---|---|---|
| Adhikari et al13, 2010 | Mangalore, coastal Karnataka | Boloor locality | 551 | MDRF-IDRS ≥60: Sensitivity - 62.2 %; Specificity - 73.7 % |
| Bhadoria et al21, 2015 | Madhya Pradesh | Jabalpur district | 911 | MDRF-IDRS ≥40: Sensitivity - 60.4 %; Specificity - 70.7 % MDRF-IDRS ≥60: Sensitivity - 26.4 %; Specificity - 91.7 % |
| Nagarathna et al16, 2020 | Nationwide diabetes screening | Nationwide diabetes screening | 240,000 | MDRF-IDRS ≥50: Sensitivity - 78.1 %; Specificity - 63.0 % MDRF-IDRS ≥60: Sensitivity - 61 %; Specificity - 77 % |
Modifications to the risk variables included in the MDRF-IDRS were also tested. In a recent study by Venkatrao et al23, the MDRF-IDRS score was tested by replacing the waist circumference component of the score with both BMI and a composite of BMI and waist circumference using data from a randomized cluster sample survey including 7496 adults at high risk for type 2 diabetes. It was reported that MDRF-IDRS using waist circumference, BMI and both BMI and waist circumference had high sensitivity (87, 88 and 82%, respectively) in detecting diabetes and use of both BMI and waist circumference in MDRF-IDRS improved its specificity. In the ICMR-INDIAB study and earlier investigations on MDRF-IDRS, waist circumference was preferred over BMI, as Indian population express Asian Indian phenotype, including increased insulin resistance and greater abdominal adiposity, i.e. increased waist circumference despite having a lower BMI compared to other ethnic groups.
In a country like India with a population of 1.4 billion, where more than 50 per cent of the people with type 2 diabetes remain undiagnosed, if no risk score is used, we have to screen the entire population. The logistics of such an exercise and cost can well be imagined. Hence, adding a preliminary step of using a screening score to identify at-risk individuals would have the potential to make such programs more cost-effective.
Our study has several strengths; it included states and union territories in India, and a represented both urban and rural areas. Moreover, a representative sampling frame and robust methodology were used utilizing OGTT for identification of diabetes in a large sample of 113,043 individuals with a response rate of 94.2 per cent. The high-level quality control measures implemented in the field survey ensured data reliability, allowing results to be generalized at the country level. However, there were also some limitations to our study. First, the cross-sectional nature of the study did not allow for inferences of causality to be made and the validation of the score with incident diabetes was not performed. Although cross-sectional data are adequate for detecting undiagnosed diabetes using risk score, prospective data would provide additional useful insight. Second, some of the differences could be attributed to the time lag in data collection between various phases of the study, which, however, is inevitable when sampling a country as big as India. However, as the objective of this current study was to evaluate the use of MDRF-IDRS in different parts of the country and the country as a whole, this time lag in the survey period does not affect the results. Our results also do not provide information on the prevalence of diabetes in individuals younger than 20 yr because this was beyond the scope of the study. Finally, our study methodology did not allow differentiating between type 2 diabetes and type 1 diabetes, latent autoimmune diabetes of adults (LADA) and maturity onset diabetes of the young (MODY) .
In conclusion, validation of MDRF-IDRS in Indian population has clinical implications. Through this study, the performance of MDRF-IDRS was evaluated across the nation. The study findings underscore the needs for using this validated score-tool in diabetes prevention intervention programmes. Such an approach may aid in an economic way of screening, conducted at the individual as well as the healthcare provider level. As the score can be self-assessed, it provides an inexpensive, easy and secure way to comprehend risk factors and empower the high-risk population for screening appropriate help. In addition, as the predictors included in the score keep changing with time and changes in lifestyle, periodic usage of the score in the same population will add value. Thus, identifying the high-risk group for diabetes will pave the way for effective intervention programmes, which is a desirable goal in public health policy and clinical practice.
Financial support and sponsorship
The study was financially supported by the Indian Council of Medical Research and Department of Health Research, Ministry of Health and Family Welfare, Government of India, New Delhi.
Conflicts of interest
None.
Acknowledgment:
Authors acknowledge the ICMR-INDIAB Expert Group for their valuable suggestions and scientific inputs. Authors acknowledge the ICMR-INDIAB Quality Managers, Quality Supervisors and the field team for smooth conduct of the study, and the participants for their cooperation.
Appendix. Sampling and weightage analysis – The Indian Council of Medical Research–INdia DIABetes study
APPENDIX - INDEX.
| Contents | Page no. |
|---|---|
| Sampling and weightage analysis – The Indian Council of Medical Research–INdia DIABetes (ICMR–INDIAB) Study | |
| Sampling | 1 |
| i. Sample size calculation | 1 |
| Table SI. Sample size calculation for Phase II of the ICMR- INDIAB study | |
| ii. Sampling design | 1 |
| Fig. S1. ICMR-INDIAB sampling strategy | 2 |
| iii. Example of sample selection in rural areas | 2 |
| Table SII. Stratification I – Regions and districts in Tamil Nadu (Based on the National Family Health Survey-3 methodology) | 2 |
| Table SIII. Stratification II – Based on the village population size | 2 |
| Table SIV. Stratification III – Based on the female literacy rate | 3 |
| Table SV. Region-wise selection of number of villages in the state | 3 |
| Table SVI. Stratification II and III for region 1 in rural Tamil Nadu | 3 |
| Table SVII. Number of villages selected for the study (Region 1) | 4 |
| Fig. S2. ICMR–INDIAB sampling framework in rural areas | 4 |
| iv Example of sample selection in urban areas | |
| Table SVIII. Stratification II – Based on the town population size | 5 |
| Table SIX. Stratification III – Based on the female literacy rate | 5 |
| Table SX. Region wise selection of number of wards in Tamil Nadu state | 5 |
| Table SXI. Stratification II and III for region I in urban Tamil Nadu | 6 |
| Table SXII. List of wards selected for the study (Region 1) | 6 |
| Fig. S3. ICMR-INDIAB sampling framework in urban areas | 6 |
| v. Estimation procedure adopted to arrive at the weights | 7 |
| Table SXIII. Example of weight calculation for Tamil Nadu state | |
| Table SXIV. Example of weight calculation for Tamil Nadu state – Rural | 8 |
| Table SXV. Example of weight calculation for Tamil Nadu state – Urban | 8 |
| vi. Survey periods in ICMR-INDIAB study | 9 |
| 10 | |
| 10 | |
| 11 |
Sampling
Sample size calculation: The sample size was calculated separately for urban and rural areas (Table SI), as previous studies have shown large variations in urban and rural prevalence of type 2 diabetes mellitus. Assuming a prevalence of 10 per cent in urban areas and four per cent in rural areas, allowing for margin of error of 20 per cent, a non-response rate of 20 per cent and level of significance of five per cent, the sample size was estimated to be 1200 in urban areas and 2800 in rural areas in each of the states studied, with a total of 4000 individuals per state.
Sampling design: A stratified multi-stage sampling design [similar to the one employed in the National Family Health Survey - 3 (NFHS-3)] was adopted for this study (Fig. S1). A two-stage design (village-household) was used in rural areas, while a three-stage design [wards-census enumeration blocks (CEBs)-household] was adopted in urban areas. In both urban and rural areas, three-level stratification was done based on geographical distribution, population size and female literacy rate [as a surrogate of socio-economic status (SES)] so as to provide a sample of individuals that was truly representative of the population of the state under study.
The first level of stratification was based on geographic distribution with each state/union territory (UT) being divided into contiguous districts. This was based on the NFHS-3 sampling methodology. The second level of stratification was based on population size to ensure that there was no bias in the study and that all villages/wards, big and small, were represented in the sample studied proportionate to their contribution to the total rural/urban population of a state. The probability proportional to population size method was used to achieve this. The third level of stratification was based on the rural/urban female literacy rate, which was used as a surrogate of SES, to ensure that the sample of villages/wards selected was truly representative of the state studied. The primary sampling units (PSUs) were villages in rural areas and CEBs in urban areas. The ultimate stage units were households in both areas. Households were selected by systematic sampling with a random start. From each urban and rural PSU, 24 and 56 households were selected, respectively. In both rural and urban areas, only one individual was selected within each household using the World Health Organization (WHO) ‘Kish method’ (STEPwise approach to surveillance WHO, http://www.who.int/chp/steps/en/).
Example of sample selection in rural areas: In rural areas, the 2001 Census list of villages served as the sampling frame. To ensure that the villages included in the study were representative of the rural population of the state under study, three levels of stratification were used in each state. The first level of stratification was geographic, with the state being divided into contiguous regions. This stratification was adopted from the NFHS-3. Table SII shows the stratification of regions for Tamil Nadu state.
The second level of stratification was based on the village population size (Table SIII). This variable was included to ensure that there was no bias in the study and that all villages, big and small, were represented in the sample studied proportionate to their contribution to the total rural population. Arbitrary cut-offs were chosen as shown in Table SIII.
The third and final level of stratification was done based on female literacy rate (Table SIV). This variable was chosen as a crude predictor of the SES of the state. The female literacy rate for each state will be studied, and then, median cut-offs will be made to ensure equal and even stratification.
All the variables used for stratification have been used in NFHS-3 design as well. For the purpose of simplicity, we have chosen only one state (Tamil Nadu) to illustrate the details of the methodology used in the study.
After the first level of stratification, Tamil Nadu state was divided into five regions (as shown in Table SII). Table SV shows the rural population in each region of Tamil Nadu and the number of villages in each of these regions. Thus, in Tamil Nadu, the number of villages in each region was calculated as shown in Table SV.
Table SVI shows Stratification II and III done for Region 1 in rural Tamil Nadu for selecting the nine villages. Table SVII shows the list of villages selected in Region 1 along with their district codes. Fig. S2 shows the sampling framework in rural areas.
Example of sample selection in urban areas: For Stratification I, the Tamil Nadu state was divided into regions similar to the rural areas as shown in Table SII. In the next level of stratification, all urban towns in the given region were stratified accordingly to population size. Table SVIII shows the second level of stratification used for urban areas.
The third level of stratification was done using female literacy rate. Just as in the rural areas, the median of literacy was used for the stratification. Table SIX shows stratification III in urban areas.
Table SX shows the region-wise selection of wards in urban Tamil Nadu. Just as for villages in rural areas, it was decided to study 50 wards in each state.
Table SXI shows Stratification II and III done in urban Tamil Nadu, and Table SXII shows the list of wards that were selected in region 1. Fig. S3 shows the sampling framework in urban areas.
Estimation procedure adopted to arrive at the weights
Weights: Weighting was done for urban and rural areas separately for each state.
The development of weights for the Indian Council of Medical Research–INdia DIABetes (ICMR–INDIAB) study involved three steps:
Step 1 - The base weight (BW) or design weight or the ratio of probability of selection to probability of selection in the domain.

Step 2 - An adjustment for non-response of individuals eligible for the survey. Non-response adjustment is done at the individual level. In each state/UT household level non-response is considered separately in urban and rural areas.

where

Step 3 - After adjustment for non-response, the weights are normalized so that the total number of weighted cases is equal to the total number of unweighted cases. This is done by multiplying the final weight by the number of responders.
Normalization of weight is done using the following formulae:
Normalizedweight(NW)=ABW×Numberofresponders
Then, developing weights pooling across urban and rural:

Ultimately, the final weight (W) for an individual respondent was computed as the product of the NWs (separately in each geographical region within rural/urban area) and domain weight (urban and rural separately). The final weights were used in all analyses to produce estimates of population parameters. An example for weight calculation for the state of Tamil Nadu is provided in Tables SXIII-SXV.
Survey periods in The Indian Council of Medical Research–INdia DIABetes (ICMR–INDIAB) study: In Phase I, four regions representing the south (Tamil Nadu), north (Chandigarh), east (Jharkhand) and west (Maharashtra) of the country were studied from 2008 to 2010. Between 2011 and 2020, the remaining states were surveyed as follows: Phase II consisted of undivided Andhra Pradesh (subsequently divided into Andhra Pradesh and Telangana), Bihar, Gujarat, Karnataka and Punjab (survey period, 2012-2013), Phase III included Delhi, Madhya Pradesh, Rajasthan and Uttar Pradesh (survey period, 2017-2018), Phase IV included Kerala, Goa, Puducherry, Haryana and Chhattisgarh (survey period, 2018-2019), North East Phase included Assam, Arunachal Pradesh, Manipur, Meghalaya, Mizoram, Nagaland, Sikkim and Tripura (survey period, 2011-2017) and Phase V included Himachal Pradesh, Uttarakhand, Odisha and West Bengal (survey period, 2019-2020).
Fig. S1.
The Indian Council of Medical Research–INdia DIABetes sampling strategy. Source26. ICMR–INDIAB, Indian Council of Medical Research–INdia DIABetes.
Fig. S2.

The Indian Council of Medical Research–INdia DIABetes sampling framework in rural areas. Source26. ICMR–INDIAB, Indian Council of Medical Research–INdia DIABetes; UT, union territory; PPS, probability proportional to population size.
Fig. S3.

The Indian Council of Medical Research–INdia DIABetes sampling framework in urban areas. Source26. ICMR–INDIAB, Indian Council of Medical Research–INdia DIABetes; UT, union territory.
Table SI.
Sample size calculation for phase II of the Indian Council of Medical Research-INdia DIABetes study
| Sample size calculation ICMR–INDIAB | Prevalence (p) | q=(1−p) | Margin of error (d)=20 per cent of P | Sample size per state (n) | ||
|---|---|---|---|---|---|---|
|
| ||||||

|
Accounting for non-responders (20%) | Rounded off to | ||||
| Rural | Diabetes=0.04 | 0.96 | 0.008 |
 2305 |
 2305+461=2766 |
2800 |
| Urban | Diabetes=0.10 | 0.90 | 0.02 |
 865 |
 865+173=1038 |
1200 |
Formula: Sample size  Z=Z statistic for a level of confidence. For the level of confidence of 95 per cent, the conventional Z value is 1.96 {2 SD}; P=Prevalence or proportion of the aspect being studied in the population; q=(1−p); d=Margin of error of the estimated prevalence
Table SII.
Stratification I – Regions and districts in Tamil Nadu (based on the National Family Health Survey-3 methodology)
| Regions | Districts |
|---|---|
| 1 | Coimbatore, Dindigul, Madurai, Theni, Erode, Nilgiri |
| 2 | Vellore, Dharmapuri, Krishnagiri, Tiruvannamalai, Salem, Namakkal, Tiruchirappalli, Karur, Perambalur, Ariyalur |
| 3 | Kanyakumari |
| 4 | Kanchipuram, Tiruvallur, Cuddalore, Villupuram, Thanjavur, Nagapattinam, Tiruvarur, Chennai |
| 5 | Pudukkottai, Sivaganga, Virudhunagar, Ramanathapuram, Thoothukudi, Tirunelveli |
NFHS, National Family Health Survey
Table SIII.
Stratification II - Based on the village population size
| Stratification II (village population size) |
|---|
| <1000 |
| 1000-3000 |
| >3000 |
Table SIV.
Stratification III - Based on the female literacy rate
| Stratification III (female literacy) |
|---|
| Below median |
| Above median |
Table SV.
Region-wise selection of number of villages in the state
| Region | Rural population (a) | Number of villages | Villages selected for the present study# |
|---|---|---|---|
| 1 | 6,032,618 | 1844 | 9 |
| 2 | 11,864,028 | 4775 | 17 |
| 3 | 582,107 | 69 | 3 |
| 4 | 10,220,031 | 5705 | 15 |
| 5 | 6,222,897 | 3007 | 9 |
| Total | 34,921,681 (b) | 15,400 | 53 |
Number of villages to be selected for the study=100 per state. #a/b × total number of villages to be selected per state (i.e. n=100)
Table SVI.
Stratification II and III for region 1 in rural Tamil Nadu
| Female literacy rate | Population | Number of villages | Per cent total population | Per cent of villages | Number of villages to be selected |
|---|---|---|---|---|---|
|
| |||||
| Population size <1000 | |||||
| <46.95 | 108,149 | 206 | 1.79 | 0.16 | 1 |
| ≥46.95 | 86,183 | 161 | 1.43 | 0.13 | 1 |
| Population size 1000-3000 | |||||
|
| |||||
| <46.95 | 876,122 | 461 | 14.52 | 1.30 | 1 |
| ≥46.95 | 482,504 | 256 | 8.0 | 0.72 | 1 |
| Population size >3000 | |||||
|
| |||||
| <46.95 | 2,031,918 | 382 | 33.68 | 2.03 | 2 |
| ≥46.95 | 2,447,742 | 378 | 40.58 | 3.45 | 3 |
| Total | 9 | ||||
Table SVII.
Number of villages selected for the study (Region 1)
| Population size (n) | Female literacy (%) | Total population | Number of villages | Number of villages selected | Village name | District code | Sub-district code |
|---|---|---|---|---|---|---|---|
| <1000 | <46.95 | 108,149 | 206 | 1 | Sirupattii | 24 | 0004 |
| ≥46.95 | 86,183 | 161 | 1 | Idayanathan | 24 | 0006 | |
| 1000-3000 | <46.95 | 876,122 | 461 | 1 | Sengattampatti | 13 | 0007 |
| ≥46.95 | 482,504 | 256 | 1 | Sellappampalayam | 12 | 0008 | |
| >3000 | <46.95 | 2,031,918 | 382 | 2 | Kadamalaikundu | 25 | 0005 |
| Thullukkuttinayakkanur | 24 | 0005 | |||||
| ≥46.95 | 2,447,742 | 378 | 3 | Cherangode | 11 | 0001 | |
| T. Meenakshipuram | 25 | 0004 | |||||
| Kandiankoil | 12 | 0003 |
Table SVIII.
Stratification II - Based on the town population size
| Stratification III (town population size) |
|---|
| <20,000 |
| 20,000-100,000 |
| >100,000 |
Table SIX.
Stratification III - Based on the Female literacy rate
| Stratification III (female literacy) |
|---|
| Below median |
| Above median |
Table SX.
Region wise selection of number of wards in Tamil Nadu state
| Region | Urban population (a) | Number of wards | Wards selected for the present study# |
|---|---|---|---|
| 1 | 7,178,044 | 4095 | 13 |
| 2 | 5,708,744 | 3482 | 11 |
| 3 | 1,093,927 | 1029 | 2 |
| 4 | 9,876,057 | 3295 | 18 |
| 5 | 3,627,226 | 2382 | 8 |
| Total | 27,483,998 (b) | 14,283 | 52 |
Number of wards to be selected for the study=50 per state. #a/b × Total number of wards to be selected per state (i.e. n=50)
Table SXI.
Stratification II and III for region I in urban Tamil Nadu
| Female literacy rate | Population | Number of towns | Number of wards | Per cent of wards | Number of wards to be selected |
|---|---|---|---|---|---|
| Population size <20,000 | |||||
|
| |||||
| <65.31 | 16,937 | 30 | 0.24 | 0.03 | 1 |
| ≥65.31 | 0 | 0 | 0 | 0 | 0 |
| Population size 20,000-100,000 | |||||
|
| |||||
| <65.31 | 782,355 | 656 | 10.90 | 1.42 | 1 |
| ≥65.31 | 160,543 | 126 | 2.24 | 0.29 | 1 |
| Population size >100,000 | |||||
|
| |||||
| <65.31 | 2,659,331 | 1991 | 37.05 | 4.41 | 4 |
| ≥65.31 | 3,558,878 | 1292 | 49.58 | 6.44 | 6 |
| Total | 13 | ||||
Total number of wards selected in region 1=13
Table SXII.
List of wards selected for the study (Region 1)
| Population size (n) | Female literacy (%) | Total population | Number of towns | Number of wards selected | Town (ward number) | District code | Sub-district code |
|---|---|---|---|---|---|---|---|
| <20,000 | <65.31 | 16937 | 30 | 1 | Andipalayam (CT) - Ward number 2 | 12 | 0003 |
| ≥65.31 | 0 | 0 | 1 | - | 12 | 0005 | |
| 20,000-100,000 | <65.31 | 782,355 | 656 | 1 | O’ Valley (TP) - Ward number 7 | 11 | 0002 |
| ≥65.31 | 160,543 | 126 | 4 | Theni Allinagaram (M) - Ward number 27 | 25 | 0003 | |
| Theni Allinagaram (M) - Ward number 23 | 25 | 0003 | |||||
| Kotagiri (TP) - Ward number 7 | 11 | 0004 | |||||
| Periyanaickenpalayam (TP) - Ward number 13 | 12 | 0005 | |||||
| >100,000 | <65.31 | 2,659,331 | 1991 | 0 | - | - | - |
| ≥65.31 | 3,558,878 | 1292 | 6 | Coimbatore (M.Corp.) - Ward number 54 | 12 | 0006 | |
| Coimbatore (M.Corp. - Ward number 19 | 12 | 0006 | |||||
| Coimbatore (M.Corp.) - Ward number 53 | 12 | 0006 | |||||
| Madurai (M.Corp.) - Ward number 25 | 24 | 0007 | |||||
| Coimbatore (M.Corp.) - Ward number 32 | 12 | 0006 | |||||
| Erode (M) - Ward number 19 | 10 | 0005 |
Table SXIII.
Example of weight calculation used for Tamil Nadu state (as an example)
| Tamil Nadu State (A) | Details (B) | Urban (C) | Rural (D) | Total (E) | Cell number 1 |
|---|---|---|---|---|---|
| 2 | |||||
| Population | Total population | 27,483,998 | 34,921,681 | 62,405,679 | 3 |
| Sample size | Total sample size | 1248 | 2968 | 4,216 | 4 |
| Probability of selection (fi) | C4/C3 (for urban) D4/D3 (for rural) | 0.00005 | 0.00008 | 0.0000676 | 5 |
| Number screened | 1076 | 2588 | 3664 | 6 | |
| RR | C6/C4 (for urban) D6/D4 (for rural) | 0.86217 | 0.87196 | 0.86907 | 7 |
| Design weight (ratio of probability of selection and probability of selection in the domain) | E5/C5 (for urban) E5/D5 (for rural) | 1.48779 | 0.79489 | 8 | |
| Weight adjusted for RR (design weight/RR) | C8/C7 (for urban) D8/D7 (for rural) | 1.7256 | 0.91 | 9 | |
| Normalization of weight | C9×C6 (for urban) D9×D6 (for rural) | 1856.76268 | 2359.23732 | 4216 | 10 |
| Final weight | C9×(E4/C10+D10) (for urban) D9×(E4/D10+C10) (for rural) | 1.49968 | 0.79224 | 0.86907 | 11 |
| Weighted number of cases | C6×C11 (for urban) D6×D11 (for rural) | 1613.65713 | 2050.34287 | 3664 | 12 |
RR, response rate
Table SXIV.
Example of weight calculation used for Tamil Nadu state - rural (as an example)
| Rural Tamil Nadu | Region 1 | Region 2 | Region 3 | Region 4 | Region 5 | Total |
|---|---|---|---|---|---|---|
| Population | 6,032,618 | 11,864,028 | 582,107 | 10,220,031 | 6,222,897 | 34,921,681 |
| Sample | 504 | 952 | 168 | 784 | 560 | 2968 |
| Actual tests | 448 | 824 | 149 | 716 | 451 | 2588 |
| RR | 0.88888 | 0.86554 | 0.88690 | 0.91326 | 0.80535 | 0.87196 |
| Probability of selection | 0.000083 | 0.000080 | 0.00028 | 0.000076 | 0.000089 | 0.000084 |
| Design weight | 1.01728 | 1.05916 | 0.29448 | 1.10791 | 0.94443 | |
| Weight adjusted for RR | 1.14444 | 1.22369 | 0.33203 | 1.21313 | 1.17269 | |
| Number of cases | 512.71 | 1008.33 | 49.47 | 868.60 | 528.89 | 2968.00 |
| Normalized weight | 0.99792 | 1.06702 | 0.28952 | 1.05781 | 1.02255 | |
| Number of cases | 447.06941 | 879.22756 | 43.13918 | 757.39309 | 461.17073 | 2588.00 |
| Weights for overall rural | 0.79224 | 0.79224 | 0.79224 | 0.79224 | 0.79224 | |
| Final weights | 0.79060 | 0.84534 | 0.22937 | 0.83805 | 0.81011 |
RR, response rate
Table SXV.
Example of weight calculation used for Tamil Nadu state – Urban (as an example)
| Urban-Tamil Nadu | Region 1 | Region 2 | Region 3 | Region 4 | Region 5 | Total |
|---|---|---|---|---|---|---|
| Population | 7,178,044 | 5,708,744 | 1,093,927 | 9,876,057 | 3,627,226 | 27,483,998 |
| Sample | 312 | 264 | 48 | 432 | 192 | 1248 |
| Actual tests | 266 | 222 | 42 | 383 | 163 | 1076 |
| RR | 0.85256 | 0.84090 | 0.87500 | 0.88657 | 0.84895 | 0.86217 |
| Probability of selection | 0.000043 | 0.000046 | 0.000043 | 0.000043 | 0.000052 | 0.000045 |
| Design weight | 1.04468 | 0.98190 | 1.03486 | 1.03808 | 0.85784 | 1 |
| Weight adjusted for RR | 1.22534 | 1.16767 | 1.18269 | 1.17089 | 1.01046 | |
| Number of cases | 325.94 | 259.22 | 49.67 | 448.45 | 164.71 | 1248.00 |
| Normalized weight | 1.05646 | 1.00674 | 1.01969 | 1.00955 | 0.87120 | |
| Number of cases | 281.02080 | 223.49763 | 42.82730 | 386.64816 | 142.00609 | 1076.00 |
| Weights for overall rural | 1.49968 | 1.49968 | 1.49968 | 1.49968 | 1.49968 | |
| Final weights | 1.58436 | 1.50979 | 1.52922 | 1.51396 | 1.30652 |
Similar weighting was done for all the 30 states of India. RR, response rate
References
- 1.International Diabetes Federation. IDF diabetes atlas ninth edition. 2019. [accessed on May 01, 2021]. Available from: https://www.diabetesatlas.org/en//
- 2.Galaviz KI, Narayan KMV, Lobelo F, Weber MB. Lifestyle and the prevention of type 2 diabetes: A status report. Am J Lifestyle Med. 2018;12:4–20. doi: 10.1177/1559827615619159. [DOI] [PMC free article] [PubMed] [Google Scholar]
- 3.Kerrison G, Gillis RB, Jiwani SI, Alzahrani Q, Kok S, Harding SE, et al. The effectiveness of lifestyle adaptation for the prevention of prediabetes in adults: A systematic review. J Diabetes Res. 2017;2017:8493145. doi: 10.1155/2017/8493145. [DOI] [PMC free article] [PubMed] [Google Scholar]
- 4.Mohan V, Deepa R, Deepa M, Somannavar S, Datta M. A simplified Indian diabetes risk score for screening for undiagnosed diabetic subjects. J Assoc Physicians India. 2005;53:759–63. [PubMed] [Google Scholar]
- 5.Mohan V, Anbalagan VP. Expanding role of the Madras Diabetes Research Foundation - Indian Diabetes Risk Score in clinical practice. Indian J Endocrinol Metab. 2013;17:31–6. doi: 10.4103/2230-8210.107825. [DOI] [PMC free article] [PubMed] [Google Scholar]
- 6.Mohan V, Deepa M, Anjana RM, Lanthorn H, Deepa R. Incidence of diabetes and pre-diabetes in a selected urban south Indian population (CUPS-19) J Assoc Physicians India. 2008;56:152–7. [PubMed] [Google Scholar]
- 7.Mohan V, Sandeep S, Deepa M, Gokulakrishnan K, Datta M, Deepa R. A diabetes risk score helps identify metabolic syndrome and cardiovascular risk in Indian –The Chennai Urban Rural Epidemiology Study (CURES-38) Diabetes Obes Metab. 2007;9:337–43. doi: 10.1111/j.1463-1326.2006.00612.x. [DOI] [PubMed] [Google Scholar]
- 8.Mohan V, Gokulakrishnan K, Ganesan A, Kumar SB. Association of Indian Diabetes Risk Score with arterial stiffness in Asian Indian nondiabetic subjects: The Chennai Urban Rural Epidemiology Study (CURES-84) J Diabetes Sci Technol. 2010;4:337–43. doi: 10.1177/193229681000400214. [DOI] [PMC free article] [PubMed] [Google Scholar]
- 9.Anbalagan VP, Venkataraman V, Vamsi M, Deepa M, Mohan V. A simple Indian diabetes risk score could help identify nondiabetic individuals at high risk of non-alcoholic fatty liver disease (CURES-117) J Diabetes Sci Technol. 2012;6:1429–35. doi: 10.1177/193229681200600624. [DOI] [PMC free article] [PubMed] [Google Scholar]
- 10.Roopa M, Deepa M, Indulekha K, Mohan V. Prevalence of sleep abnormalities and their association with metabolic syndrome among Asian Indians: Chennai Urban Rural Epidemiology Study (CURES-67) J Diabetes Sci Technol. 2010;4:1524–31. doi: 10.1177/193229681000400630. [DOI] [PMC free article] [PubMed] [Google Scholar]
- 11.Mohan V, Vassy JL, Pradeepa R, Deepa M, Subashini S. The Indian type 2 diabetes risk score also helps identify those at risk of macrovascular disease and neuropathy (CURES-77) J Assoc Physicians India. 2010;58:430–3. [PubMed] [Google Scholar]
- 12.Sharma KM, Ranjani H, Nguyen H, Shetty S, Datta M, Narayan KM, et al. Indian Diabetes Risk Score helps to distinguish type 2 from non-type 2 diabetes mellitus (GDRC-3) J Diabetes Sci Technol. 2011;5:419–25. doi: 10.1177/193229681100500232. [DOI] [PMC free article] [PubMed] [Google Scholar]
- 13.Adhikari P, Pathak R, Kotian S. Validation of the MDRF-Indian Diabetes Risk Score (IDRS) in another south Indian population through the Boloor Diabetes Study (BDS) J Assoc Physicians India. 2010;58:434–6. [PubMed] [Google Scholar]
- 14.Gupta SK, Singh Z, Purty AJ, Kar M, Vedapriya D, Mahajan P, et al. Diabetes prevalence and its risk factors in rural area of Tamil Nadu. Indian J Community Med. 2010;35:396–9. doi: 10.4103/0970-0218.69262. [DOI] [PMC free article] [PubMed] [Google Scholar]
- 15.Gupta SK, Singh Z, Purty AJ, Vishwanathan M. Diabetes prevalence and its risk factors in urban Pondicherry. Int J Diabetes Dev Ctries. 2009;29:166–9. doi: 10.4103/0973-3930.57348. [DOI] [PMC free article] [PubMed] [Google Scholar]
- 16.Nagarathna R, Tyagi R, Battu P, Singh A, Anand A, Nagendra HR. Assessment of risk of diabetes by using Indian Diabetic risk score (IDRS) in Indian population. Diabetes Res Clin Pract. 2020;162:108088. doi: 10.1016/j.diabres.2020.108088. [DOI] [PubMed] [Google Scholar]
- 17.Nittoori S, Wilson V. Risk of type 2 diabetes mellitus among urban slum population using Indian Diabetes Risk Score. Indian J Med Res. 2020;152:308–11. doi: 10.4103/ijmr.IJMR_1597_18. [DOI] [PMC free article] [PubMed] [Google Scholar]
- 18.Acharya AS, Singh A, Dhiman B. Assessment of diabetes risk in an adult population using Indian Diabetes Risk Score in an Urban resettlement colony of Delhi. J Assoc Physicians India. 2017;65:46–51. [PubMed] [Google Scholar]
- 19.Patil RS, Gothankar JS. Assessment of risk of type 2 diabetes using the Indian Diabetes Risk Score in an urban slum of Pune, Maharashtra, India: A cross-sectional study. WHO South East Asia J Public Health. 2016;5:53–61. doi: 10.4103/2224-3151.206555. [DOI] [PubMed] [Google Scholar]
- 20.Nag T, Ghosh A. Indian diabetes risk score and clustering of metabolic syndrome phenotype in a rural community of Asian Indian origin. Diabetes Res Clin Pract. 2016;112:44–9. doi: 10.1016/j.diabres.2015.11.005. [DOI] [PubMed] [Google Scholar]
- 21.Bhadoria AS, Kasar PK, Toppo NA. Validation of Indian diabetic risk score in diagnosing type 2 diabetes mellitus against high fasting blood sugar levels among adult population of central India. Biomed J. 2015;38:359–60. doi: 10.4103/2319-4170.143508. [DOI] [PubMed] [Google Scholar]
- 22.Fernandez RS, Frost S. Congruence between the Indian Diabetes Risk Score and Australian Type 2 Diabetes Risk Assessment tool screening in Asian-Indians. Nurse Res. 2013;21:36–9. doi: 10.7748/nr2013.11.21.2.36.e215. [DOI] [PubMed] [Google Scholar]
- 23.Venkatrao M, Nagarathna R, Patil SS, Singh A, Rajesh SK, Nagendra H. A composite of BMI and waist circumference may be a better obesity metric in Indians with high risk for type 2 diabetes: An analysis of NMB-2017, a nationwide cross-sectional study. Diabetes Res Clin Pract. 2020;161:108037. doi: 10.1016/j.diabres.2020.108037. [DOI] [PubMed] [Google Scholar]
- 24.Dudeja P, Singh G, Gadekar T, Mukherji S. Performance of Indian Diabetes Risk Score (IDRS) as screening tool for diabetes in an urban slum. Med J Armed Forces India. 2017;73:123–8. doi: 10.1016/j.mjafi.2016.08.007. [DOI] [PMC free article] [PubMed] [Google Scholar]
- 25.Ranadip C, Abhijit M, Saiendu L. A study on distribution and determinants of Indian Diabetic Risk Score (IDRS) among rural population of West Bengal. Natl J Med Res. 2012;2:282–6. [Google Scholar]
- 26.Anjana RM, Pradeepa R, Deepa M, Datta M, Sudha V, Unnikrishnan R, et al. The Indian Council of Medical Research-India Diabetes (ICMR-INDIAB) study: Methodological details. J Diabetes Sci Technol. 2011;5:906–14. doi: 10.1177/193229681100500413. [DOI] [PMC free article] [PubMed] [Google Scholar]
- 27.Anjana RM, Deepa M, Pradeepa R, Mahanta J, Narain K, Das HK, et al. Prevalence of diabetes and prediabetes in 15 states of India:results from the ICMR-INDIAB population-based cross-sectional study. Lancet Diabetes Endocrinol. 2017;5:585–96. doi: 10.1016/S2213-8587(17)30174-2. [DOI] [PubMed] [Google Scholar]
- 28.World Health Organization. STEPwise approach to surveillance (STEPS) [accessed on June 3, 2021]. Available from:http://www.who.int/chp/steps/en/
- 29.Lindström J, Tuomilehto J. The diabetes risk score: A practical tool to predict type 2 diabetes risk. Diabetes Care. 2003;26:725–31. doi: 10.2337/diacare.26.3.725. [DOI] [PubMed] [Google Scholar]
- 30.Glümer C, Carstensen B, Sandbaek A, Lauritzen T, Jørgensen T, Borch-Johnsen K, et al. A Danish diabetes risk score for targeted screening: The Inter99 study. Diabetes Care. 2004;27:727–33. doi: 10.2337/diacare.27.3.727. [DOI] [PubMed] [Google Scholar]
- 31.Balkau B, Lange C, Fezeu L, Tichet J, de Lauzon-Guillain B, Czernichow S, et al. Predicting diabetes: Clinical, biological, and genetic approaches: Data from the Epidemiological Study on the Insulin Resistance Syndrome (DESIR) Diabetes Care. 2008;31:2056–61. doi: 10.2337/dc08-0368. [DOI] [PMC free article] [PubMed] [Google Scholar]
- 32.Schmidt MI, Duncan BB, Bang H, Pankow JS, Ballantyne CM, Golden SH, et al. Identifying individuals at high risk for diabetes: The Atherosclerosis Risk in Communities study. Diabetes Care. 2005;28:2013–8. doi: 10.2337/diacare.28.8.2013. [DOI] [PubMed] [Google Scholar]
- 33.Spijkerman AM, Yuyun MF, Griffin SJ, Dekker JM, Nijpels G, Wareham NJ. The performance of a risk score as a screening test for undiagnosed hyperglycemia in ethnic minority groups: Data from the 1999 health survey for England. Diabetes Care. 2004;27:116–22. doi: 10.2337/diacare.27.1.116. [DOI] [PubMed] [Google Scholar]
- 34.Woo YC, Gao B, Lee CH, Fong CH, Lui DT, Ming J, et al. Three-component non-invasive risk score for undiagnosed diabetes in Chinese people: Development, validation and longitudinal evaluation. J Diabetes Investig. 2020;11:341–8. doi: 10.1111/jdi.13144. [DOI] [PMC free article] [PubMed] [Google Scholar]
- 35.Zhang H, Wang C, Ren Y, Wang B, Yang X, Zhao Y, et al. A risk-score model for predicting risk of type 2 diabetes mellitus in a rural Chinese adult population: A cohort study with a 6-year follow-up. Diabetes Metab Res Rev. 2017 doi: 10.1002/dmrr.2911. Doi:10.1002/dmrr.2911. [DOI] [PubMed] [Google Scholar]
- 36.Ramachandran A, Snehalatha C, Vijay V, Wareham NJ, Colagiuri S. Derivation and validation of diabetes risk score for urban Asian Indians. Diabetes Res Clin Pract. 2005;70:63–70. doi: 10.1016/j.diabres.2005.02.016. [DOI] [PubMed] [Google Scholar]
- 37.Chaturvedi V, Reddy KS, Prabhakaran D, Jeemon P, Ramakrishnan L, Shah P, et al. Development of a clinical risk score in predicting undiagnosed diabetes in urban Asian Indian adults: A population-based study. CVD Prev Control. 2008;3:141–51. [Google Scholar]
- 38.Oommen AM, Abraham VJ, Sathish T, Jose VJ, George K. Performance of the Achutha Menon Centre diabetes risk score in identifying prevalent diabetes in Tamil Nadu, India. Diabetes Metab J. 2017;41:386–92. doi: 10.4093/dmj.2017.41.5.386. [DOI] [PMC free article] [PubMed] [Google Scholar]