

Abstract
Glioblastoma is a grade IV pernicious neoplasm occurring in the supratentorial region of brain. As its causes are largely unknown, it is essential to understand its dynamics at the molecular level. This necessitates the identification of better diagnostic and prognostic molecular candidates. Blood‐based liquid biopsies are emerging as a novel tool for cancer biomarker discovery, guiding the treatment and improving its early detection based on their tumour origin. There exist previous studies focusing on the identification of tumour‐based biomarkers for glioblastoma. However, these biomarkers inadequately represent the underlying pathological state and incompletely illustrate the tumour because of non‐recursive nature of this approach to monitor the disease. Also, contrary to the tumour biopsies, liquid biopsies are non‐invasive and can be performed at any interval during the disease span to surveil the disease. Therefore, in this study, a unique dataset of blood‐based liquid biopsies obtained primarily from tumour‐educated blood platelets (TEP) is utilised. This RNA‐seq data from ArrayExpress is acquired comprising human cohort with 39 glioblastoma subjects and 43 healthy subjects. Canonical and machine learning approaches are applied for identification of the genomic biomarkers for glioblastoma and their crosstalks. In our study, 97 genes appeared enriched in 7 oncogenic pathways (RAF‐MAPK, P53, PRC2‐EZH2, YAP conserved, MEK‐MAPK, ErbB2 and STK33 signalling pathways) using GSEA, out of which 17 have been identified participating actively in crosstalks. Using PCA, 42 genes are found enriched in 7 pathways (cytoplasmic ribosomal proteins, translation factors, electron transport chain, ribosome, Huntington's disease, primary immunodeficiency pathways, and interferon type I signalling pathway) harbouring tumour when altered, out of which 25 actively participate in crosstalks. All the 14 pathways foster well‐known cancer hallmarks and the identified DEGs can serve as genomic biomarkers, not only for the diagnosis and prognosis of Glioblastoma but also in providing a molecular foothold for oncogenic decision making in order to fathom the disease dynamics. Moreover, SNP analysis for the identified DEGs is performed to investigate their roles in disease dynamics in an elaborated manner. These results suggest that TEPs are capable of providing disease insights just like tumour cells with an advantage of being extracted anytime during the course of disease in order to monitor it.
Keywords: bioinformatics, cancer, genomics
We used gene expression data from TEPs for glioblastoma and analysed it using GSEA and PCA to quantify differentially expressed genes. We further identified crosstalks between enriched pathways that foster cancer hallmarks, followed by SNP analysis of DEGs.

1. INTRODUCTION
Glioblastoma is the most belligerent brain tumour that occurs in glial cells, rarely spreading to distant organs. Though glial cells do not participate in organism‐wide communication like neurons but they play equally significant roles by providing support to neurons, [1] and thus, anomalies in glial cells can lead to havoc also. Glioblastoma is a rapidly growing lethal brain tumour that has been declared as grade IV astrocytoma by WHO (World Health Organisation) [2]. It often occurs in the cerebral hemispheres mostly temporal and frontal lobes of brain [3]. It has an incidence rate of 3.19 glioblastoma cases per 100,000 persons every year [4]. Once diagnosed, the average life expectancy is approximately 12–15 months, 25% of patients survive for about a year while less than 5% have a life expectancy of 5 or more years [5].
Glioblastoma actively proliferates and in order to stop it from growing further, surgery appears as an approachable solution; but since it insinuates the surrounding tissue, complete resection is not possible. In such conditions, radiotherapy does not give good results either [6] because of blood‐brain barrier, which renders treatment difficult as tumour cells present in the hypoxic regions show resistance to radiotherapy [7]. Thus, the possible effective treatment is to abscise the tumour as much as possible followed by chemo and radiotherapy [8]. Treatment can add up to a few months in the life expectancy of a glioblastoma patient.
Biomarkers serve as quantifiable indicators of perturbed biological processes, which appear differently in normal processes [9]. They help in understanding the spectrum of disease dynamics, which can further aid in either eradicating the disease‐causing disturbance or minimising the disease spread. Thus, the identification of biomarkers is very important as they assist in tracking the record from diagnosis of a disease to its treatment and post‐treatment symptoms in order to curtail the recurrence of disease. Moreover, they are very helpful in oncogenic decision‐making.
Glioblastoma is a very lethal cancer, and due to its smaller life expectancy, the patient dies even before its mystery is unwound. Brain tissue cannot be abscised from the body usually to perform studies because brain surgeries and biopsies are intracranial [4]. Since the causes are unknown for glioblastoma, genomic biomarkers hold a significant value in understanding the onset and prevalence of disease. As the human genome has been sequenced and high‐throughput sequencing techniques are producing bulks of genomics data, the identification of differentially expressed genes (DEGs) in glioblastoma patients can shed light on pre‐sequenced genes that have never been studied before with respect to the disease [10]. Causes and biomarkers of the disease vary from individual to individual but in order to make generalised inferences; a combined study of gene expressions in various individuals is helpful to identify which group of DEGs is significantly important. Therefore, it necessitates the identification of genomic biomarkers for glioblastoma using different population data to provide some more generalised information in order to understand the onset of disease and to find new approaches for treatment so that life expectancy can be increased. The most well‐studied and known genomic biomarkers for glioblastoma noted so far are as follows: EGFR, PTEN, TERT, FGFR2, IRS2, AKT3, TP16, TP53, PARK2, PTPRD, NF1, IDH1, PDGFRA, and STAT3 [4, 10, 11] associated with amplifications, mutations, and loss of heterozygosity.
The identification of genomic biomarkers is conventionally performed using tissue biopsies to characterise different tumours and their types. This approach renders limited samples and incompletely represents tumours as it cannot be recursed to monitor the disease. Therefore, liquid biopsies (aka blood‐based liquid biopsies have been found niftier due to their non‐invasive nature and ability to provide maximal tumour information) [12]. They aid in generating information at transcriptomic, proteomic, epigenomic, and metabolomic levels. Blood serves as a wealth of information as it contains numerous analytes, that is, circulating tumour cells (CTCs), circulating tumour DNA (ctDNA), tumour‐educated platelets (TEPs), and extracellular vesicles (EVs), such as exosomes, metabolites, and proteins [13].
Biological systems are very complex in nature and biological pathways work in a coordinated manner to generate appropriate responses to perturbations from internal or external stimuli. Therefore, the interaction of genes involved in an underlying physiological system may reveal valuable information at a mechanistic level to increase our understanding of complex molecular dynamics. Besides gene expression profiles, the interaction of these genes in their regulatory networks unleashes valuable information as to the way they play their biological role [14]. Therefore, to comprehend cellular behaviour under certain conditions, it is helpful to identify these interactions and crosstalks.
1.1. Motivation and contribution
This work aims at providing potential genomic biomarkers for glioblastoma and their crosstalks between cancer‐fostering pathways to improve the understanding of disease dynamics. Therefore, well‐established canonical and machine‐learning approaches have been used to carry out this study. This study utilises blood‐based liquid biopsies primarily focusing on tumour‐educated platelets (TEPs). Duly mentioned above biomarkers from blood‐based liquid biopsies hold the potential to capture cancer signatures at the genomic level. In the past, genomic biomarkers for glioblastoma have been identified using tumour biopsies [15, 16, 17, 18], but these studies exist as small pieces of a puzzle as vast biodiversity lies at the population level based on ethnicity, age, sex, and continuously varying environmental exposure. Our study will also serve as a piece in the puzzle of glioblastoma dynamics in order to acquire mechanistic insights. Moreover, SNP‐based associations with various brain disorders have further helped in scrutinising the roles of these biomarkers in glioblastoma. To the best of our knowledge, there does not exist any study where TEPs are used to identify genomic biomarkers and their crosstalks in tumour‐harbouring pathways for glioblastoma.
The paper is organised as follows: Section 2 describes the description and preprocessing of data, dimensionality reduction, and classification problems followed by enrichment analysis. Section 3 addresses the results of the study. The significance of results is discussed in detail in Section 4 and Section 5 marks the conclusion of the paper.
2. METHODS
This section describes the protocol adopted for the current study. Figure 1 gives an overview of the workflow. The integrants of this figure are explained in detail.
FIGURE 1.
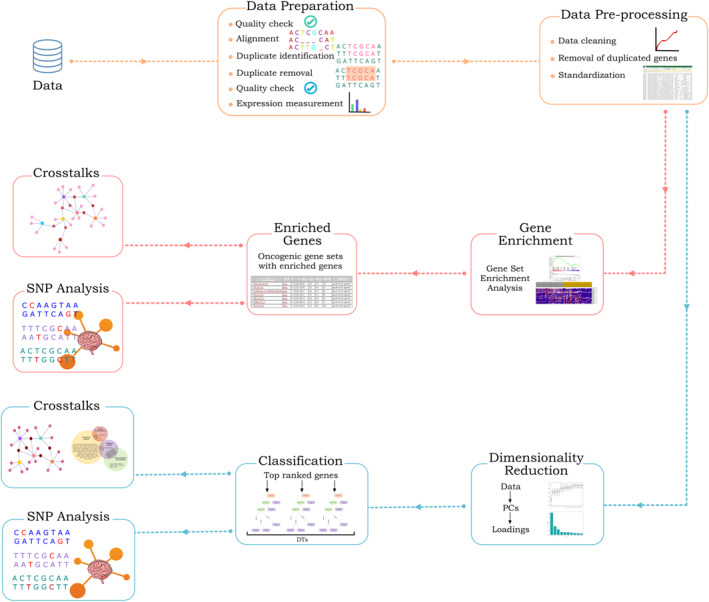
Workflow of the current study protocol. To attain the objectives of this study, raw gene expression data from TEPs in the form of RNA‐seq for glioblastoma is used; followed by its preparation and preprocessing it underwent two distinct approaches, namely GSEA and PCA. GSEA and PCA‐derived DEGs and enriched pathways were subjected to pathway analysis in order to study the involvement of DEGs in crosstalks between enriched pathways that foster cancer hallmarks, followed by SNP analysis of DEGs.
2.1. RNA‐seq data
mRNA expression profiles are downloaded from ArrayExpress with accession number GSE68086. ArrayExpress stores data generated from high‐throughput sequencing experiments. The inclusion criteria for dataset consider a human origin and it being free from mutations and drug effects. Unfortunately, not much data is available for glioblastoma because of its intracranial locus. Moreover, we wanted to work with liquid biopsies data; therefore, the current dataset has been chosen after a thorough screening of public databases keeping under consideration the criteria for dataset selection. This data had been obtained primarily from tumour‐educated platelets (TEP) using blood‐based liquid biopsies [19]. These expression profiles contained 39 experimental samples and 43 control samples. Details of selected samples are provided in Supporting Information S1 Table
2.2. Data preparation and preprocessing
RNA sequencing methods generate a lot of raw data, which needs to be processed prior to its use in order to discard unnecessary adaptor sequences and redundant gene transcripts, which if not removed can compromise the quality of results [20]. Preprocessing of data includes basic steps, such as quality control, read alignments, and quantification of genes and transcript levels mainly. There is a wide variety of available tools for this purpose [21]. We have used FastQC [22] for quality control, HISAT2 [23] for read alignment, and RSeQC [24] for identification of duplicate reads on the basis of sequence and mapping. MarkDuplicate and RmDup [25] are used to mark and remove the replicated sequences having the highest mapping quality, respectively. For the estimation of gene expression levels in aligned data files, StringTie [26] is used.
2.3. Machine learning
The coding scripts used in this section are available in Supporting Information S0 Scripts.
2.3.1. Dimensionality reduction
High‐throughput sequencing yields high‐dimensional genomic data, which ultimately increase its volume [27]. Extracting information from such a high‐dimensional data is difficult; therefore, the information at the genomic level is often incomplete because it is not easy to extract the maximum information from available genomic signatures. Therefore, on such kind of high‐dimensional data, dimensionality reduction is performed to decrease the dimensions and volume of data, preserving the important signatures of data, which can explain the rest of data at a maximal level. Moreover, apart from information processing, dimensionality reduction is useful to improve the accuracy of classifiers for prediction in turn decreasing the computation cost yielding optimised results [28]. Dimensionality reduction helps in getting quality features for classification and regression by eliminating noise and redundant features. It reduces multicollinearity resulting in model's better performance. In this study, principal component analysis is used to cater the curse of dimensionality, which comes with genomic data.
In this study, principal component analysis (PCA) [29] with singular value decomposition (SVD) is used as a dimensionality reduction approach on the RNA‐seq dataset of glioblastoma. It is an unsupervised method that works by reducing the multicollinearity in data resulting in the formation of new features known as principal components, which are least correlated with each other. Let the dataset be a matrix D of m × n dimensions where m represents the number of samples and n represents the number of features (genes). Performing SVD on D [30]: D = UΣV T , where U represents a unitary matrix with m × m dimensions and Σ is a diagonal matrix of singular values that is, σ i with m × n dimensions. Right singular vectors V depict principal directions and singular values σ i are related to the eigenvalues λ i as . Principal components are calculated from DV = UΣV T V = UΣ, and columns of UΣ represent principal components. Eigenvalues λ i show variations captured by principal components in data. Whereas loadings are obtained from .
2.3.2. Classification
Decision tree is an ensemble learning method that falls under the category of supervised machine learning algorithms. It is used for both regression and classification problems. A decision tree represents the knowledge extracted from dataset in its inductive learning process where it splits the given dataset and creates a decision boundary between labels. It has three types of nodes; a “root node” from where it starts which has no incoming edge, “internal or test node” having both incoming and outgoing edges, and “leaf or terminal node”, which has no outgoing edge [31].
Splitting of data occurs at test nodes under a certain criterion to make the split optimum. In this study, entropy has been used as the criterion to measure the quality of the split. In simple words, entropy measures the uncertainty of an arbitrary variable, characterising the impurity of a randomly selected subset from sample space [32]; entropy can be calculated as follows:
The next important step is attribute selection, which is determined by information gain. It is impurity‐based measure, which makes use of entropy [32]. Information gain can be calculated as follows:
where S is the set at parent node, A is the attribute, Value(A) is the set containing all values for A, S v is the subset of S at the child node for which attribute A has value of v, that is, S v = {S|A(s) = v}, and C = {0, 1}.
Usually, each test node considers one attribute in order to partition the sample space as per attribute's value. Terminal nodes also known as decision nodes represent the class labels. As decision tree works on the top‐down approach, samples are navigated from the root node to decision nodes of the tree in order to be classified. This classification path of samples is determined by the outcome of test nodes [31].
In this study, we have performed classification on the loading matrix of genes with resect to First three principal components to verify the results of dimensionality reduction. Out of several performance measures, we have used confusion matrix and accuracy to measure the performance of decision tree. Confusion matrix is the representation of true positive (TP), true negative (TN), false positive (FP), and false negative (FN) parameters in the form of a matrix. True positives and true negatives are those outcomes, which are classified correctly as per given condition when it exists and when it does not exist, respectively. Contrary to this false positives and false negatives are the misclassified outcomes. In false positives, outcomes are classified predicting that the condition exists when in actual it does not; in short rejecting the true null hypothesis. This misclassification error is known as type I error. In false negatives, outcomes are classified predicting that the condition does not exist when in actual it does; concisely, it is the failure to reject the false null hypothesis. This misclassification error is known as type II error [33]. Accuracy is another measure to assess the performance of classification models and it is computed on the basis of above mentioned four parameters (TP, TN, FP, and FN) [34] as follows:
A detailed analysis on the selection of decision tree for this study is provided in Supporting Information S2 Analysis.
2.4. Enrichment analysis
The identification of DEGs for a certain disease is insufficient to utmostly interpret the genomic signatures lying in the dataset in turn thwarting the comprehension of disease dynamics. Therefore, enrichment analysis is used alongside to supplement the interpretation of gene expression data [35]. It is performed by focalising those groups of genes, which perform similar biological functions, share common chromosomal location, or regulate same biological pathways. These groups of genes are termed as gene sets [36]. Enrichment analysis is performed by ordering the genes with respect to their differential expression in both control and experimental groups in the form of a ranked list. This ranked list is used to identify the DEGs enriched in certain pathways, thus highlighting pathways that have been altered in the disease [36].
In this study, we have used gene set enrichment analysis (GSEA) [36] to interpret gene expression data as a canonical method. GSEA works by ranking the genes on the basis of correlation between their expressions with two phenotypes (experimental or control) in the form of a list. It is backed up with a database of gene sets, and the prime objective is to determine if the genes from gene sets appear enriched in the gene expression data or not. This is done by calculating an enrichment score, which is a measure of representation of genes from a gene set in the ranked list either at its top or the bottom as these regions clearly distinguish between two phenotypes. Statistical significance of enrichment score is estimated by producing a null distribution using a permutation test based on the phenotypes followed by the computation of nominal p‐value relative to the null distribution. In case of multiple gene sets involvement, estimated significance is readjusted to reckon multiple hypothesis testing. Thus, for each gene set, enrichment score is normalised and its false discovery rate is estimated [36].
2.5. Single nucleotide polymorphism (SNP) analysis of identified DEGs
We have performed single‐nucleotide polymorphism analysis on the DEGs, which we identified using PCA and GSEA. These DEGs comprise a total of 139 genes; 42 from PCA and 97 from GSEA. SNP analysis helps to further understand the behaviour of our identified DEGs as their variants appear as causative agents in numerous nervous disorders/diseases. Here, our concerned diseases belonged to the nervous system. This analysis has been performed using DisGeNET [37] version 7.0, which enables us to look up associations between genes and their variants with diseases. The gene names were provided as input in the search panel and top 5 variant‐disease associations were consulted for each gene considering the highest variant‐disease association score for brain disorders only. This variant‐disease association score shows the strength of association reckoning with the type and number of sources and publications, which support the association. It ranges from 0 to 1.
2.6. Crosstalks
Crosstalks between two or more pathways occur when some genes from one pathway are regulated in two or more respective pathways. The activation and deactivation of these genes not only affect one pathway but all the other pathways in which they are involved. Crosstalks are important to study as they provide a holistic view to understand the dynamics of biological processes, which are sometimes difficult to interpret when studying only one pathway [14]. Crosstalks for glioblastoma are generated using Cytoscape version 3.8.2 [38]. In this study, we have identified crosstalks between cancer fostering pathways where DEGs from both approaches (PCA and GSEA) are actively involved. These pathways are taken from two databases namely kegg and wiki pathways. Wikipathways [39] plugin was used to extract enriched pathways, whereas enriched pathways from kegg were downloaded from kegg pathway database and gene names were extracted.
3. RESULTS
This section comprises of glioblastoma DEGs and their crosstalks, which we have identified using PCA as a non‐canonical and gene set enrichment analysis as a canonical method.
3.1. Dimensionality reduction and clustering
In this study, we had 9797 genes as features after data preparation and preprocessing steps. We reduced this number to 6126 by removing the redundant genes, that is, transcripts of the same gene, by selecting the high‐intensity gene transcript and preserving only their viable expression values. We applied PCA on these 6126 genes to further reduce the dimensions of dataset in order to capture the signature of those genes, which were capable of classifying the experimental and control samples. In this regard, first three principal components were selected as these were capturing the 42% of variance in the dataset. The variance captured by first three components is 26%, 10%, and 6%, respectively.
3.2. Classification using decision trees
We generated loading matrices for first three principal components, which contained genes, ranked according to their level of contribution in generation of principal components, respectively. Top‐ranked genes with maximum contribution from loading matrices were used to classify the experimental and control samples for validation purpose using decision trees with a train test split ratio of 85 to 15, respectively. We used entropy with information gain to measure the split quality. Classification performance was evaluated using accuracy scores and confidence matrix. The accuracy score of classification model executed on validation data (15% of total data) is 0.98, whereas confidence matrix contained 86% true negatives, 100% true positives, 0% false positives or type‐I error, and 14% false negative or type‐II error. Top‐ranked loading matrix genes are given in Supporting Information S3 Table.
3.3. PCA DEGs
We performed enrichment analysis on top‐ranked genes followed by their validation and out of these genes, 42 were found enriched in 7 pathways; where most of the enriched genes belong to ribosomal pathways (cytoplasmic ribosomal proteins and ribosome) and some to immunodeficiency (primary immunodeficiency and interferon type I signalling), translation factors, electron transport chain, and Huntington's disease pathways. These identified pathways hold a pivotal importance in this study as they foster cancer hallmarks, which are the backbone of this study. Ribosomal pathways are responsible for playing two major roles, namely ribosomal assembly and protein synthesis. These pathways are critical for this study because ribosomal flaws at the molecular level are linked to cancer [40]. Immune system is responsible for tissue homoeostasis and protection against infectious pathogens. Tissue architecture is badly destroyed when this homoeostasis is disturbed resulting in tissue remodelling, DNA and protein alterations because of excessive oxidative stress; in turn increasing risks for cancer onset. Therefore, perturbed immune pathways end up increasing the chances for cancer development [41]. Apart from these, cancer is notorious for dysregulated translation in cells. Most of the reported cancer‐associated mutations occur in translational pathways or pathways nurturing the process of translation. mRNA translation into protein, shapes the gene expression process; therefore, tumourigenic initiation factors, and genetically altered translational machinery (defected ribosomes as mentioned above) bring in elevated risks for cancer [42]. Another infamous constituent backing up the cancer hallmarks is altered ROS (reactive oxygen species) homoeostasis. ROS are formed when escaped electrons from ETC (electron transport chain) react prematurely with oxygen molecules. Since ROS affects signalling pathways controlling cell survival and proliferation, thus, in cancer oncogenic pathways, confiscate ETC, rendering it malfunctioned to intensify ROS production [43]. Huntington's disease (HD) is a progressive neurodegenerative disorder caused by inheriting a defected huntingtin gene. Contrary to the other identified pathways, HD lowers the cancer risk [44] but we have identified crosstalks between HD and ETC pathway so it may indirectly contribute in the oncogenesis. Identified DEGs in the aforementioned pathways can be seen in Figure 2; and their crosstalks are depicted in Figure 3. However, Table 1 illustrates the enriched crosstalking DEGs alongside their general and cancer‐relevant roles.
FIGURE 2.
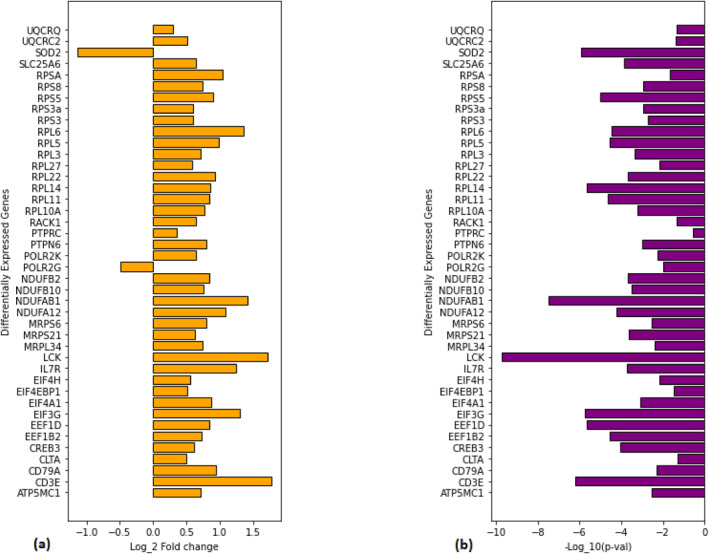
Bar charts representing differentially expressed genes from PCA. (a) Log2FC values for PCA‐enriched DEGs, (b) ‐Log10 p‐values for PCA‐enriched DEGs.
FIGURE 4.
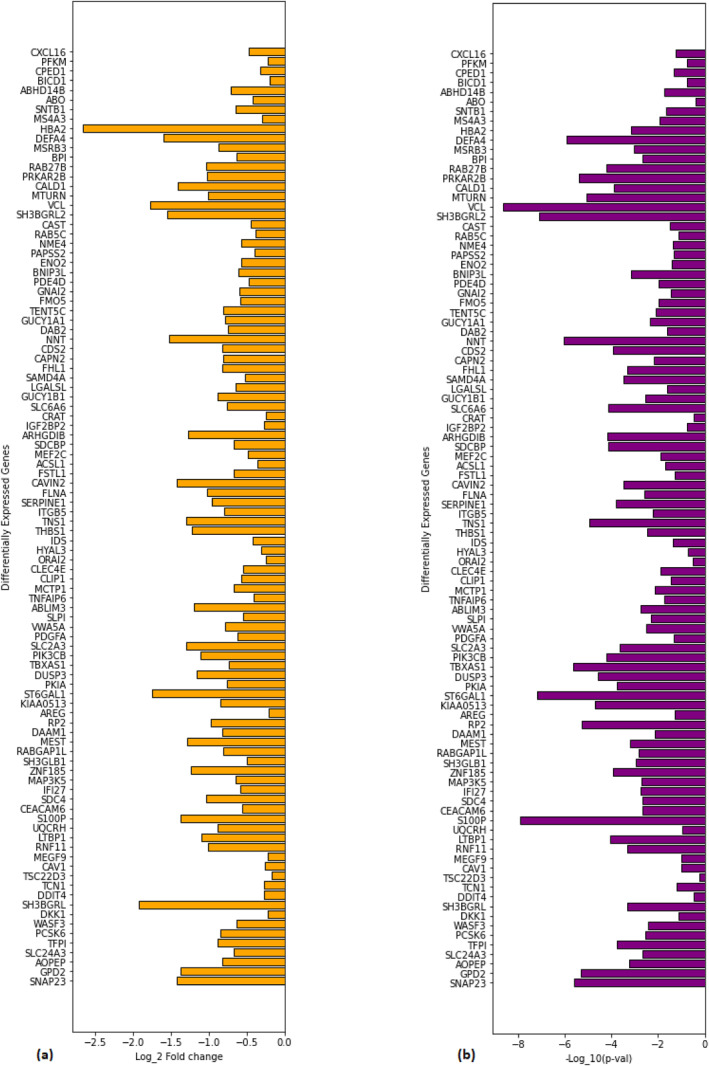
Bar charts representing differentially expressed genes from GSEA. (a) Log2FC values for GSEA enriched DEGs and (b) ‐Log10 p‐values for GSEA‐enriched DEGs.
TABLE 1.
Identified crosstalking DEGs for glioblastoma (using PCA) with their crosstalk pathways alongside reported processes where they are involved.
| Gene | Processes reported in literature | Identified pathways in this study |
|---|---|---|
| RPL5 | Ribosomal assembly [45], tumour suppression [46, 47] | CRP, ribosome |
| RPL3 | Ribosomal assembly [45], tat‐mediated transactivation [48], apoptosis and cell migration [49] | CRP, ribosome |
| RPSA | Matrix adhesion [50], tumour progression [51] | CRP, ribosome |
| RPS5 | Translation [52], cell differentiation and apoptosis [53] | CRP, ribosome |
| RPL10 A | Ribosomal assembly [54], hub gene in breast cancer [55] | CRP, ribosome |
| RPL6 | Ribosomal assembly [45], p53 stabilisation [56] | CRP, ribosome |
| RPS3 | Encodes ribosomal protein (40S subunit), apoptosis, and DNA repair [57] | CRP, ribosome |
| RPL11 | Ribosomal assembly [45], tumour suppression [58] | CRP, ribosome |
| RPL14 | Ribosomal assembly [45], tumourigenesis [59] | CRP, ribosome |
| RPS8 | Maturation of the 18S rRNA [60] | CRP, ribosome |
| RPS3A | Apoptosis [61], NFκβ signalling pathway [62] | CRP, ribosome |
| RPL22 | Ribosomal assembly [45], tumour suppression [63] | CRP, ribosome |
| RPL27 | Ribosomal assembly [45] | CRP, ribosome |
| UQCRQ | Electron transport chain [64] | ETC, HD |
| NDUFB10 | Electron transport chain [65] | ETC, HD |
| NDUFA12 | Electron transport chain [65] | ETC, HD |
| SLC25A6 | ATP exchange [66], apoptosis [67] | ETC, HD |
| NDUFB2 | Electron transport chain [65] | ETC, HD |
| NDUFAB1 | Electron transport chain [65] | ETC, HD |
| UQCRC2 | Electron transport chain [68], tumourigenesis [69] | ETC, HD |
| ATP5MC1 | ATP synthesis [70] | ETC, HD |
| LCK | T Cell signalling [71], cell proliferation [72] | ETC, HD |
| PTPRC | T and B cell signalling [73], tumourigenesis [74] | ETC, HD |
| EIF4A1 | Translation [75], metastasis [76] | ETC, HD |
| EIF4EBP1 | Translation repression [77], tumourigenesis (phosphorylated) [78], tumour suppression (unphosphorylated) [79] | ETC, HD |
Abbreviations: CRP, Cytoplasmic ribosomal proteins; ETC, Electron Transport Chain (OXPHOS system in mitochondria); HD, Huntington disease.
3.4. Gene set enrichment analysis
We performed Gene set enrichment analysis on the preprocessed data, which provided with 136 upregulated gene sets out of 172 in the experimental phenotype. Out of which 7 gene sets appeared significant on the basis of nominal p‐value, that is, <5%. Whereas no significant gene set appeared in the control phenotype. The seven gene sets mentioned correspond to pathways, which are being upregulated in several cancers, and each pathway contains some genes from our dataset other than its own genes, which have been found upregulated in these pathways with adapted pathway names (see Table 2). Supporting Information S4 Datasheet contains original pathway names as per GSEA result files. These include P53, YAP conserved, PRC2, ErbB2, STK33, and two MAPK pathways (constituting RAF and MEK regulation) comprising of 16, 8, 19, 22, 13, 18, and 20 genes from our dataset out of 45, 17, 38, 67, 39, 48, and 54 genes of their own, respectively.
TABLE 2.
Glioblastoma genes enriched in cancer regulating pathways.
| Pathway/geneset | Role | Nom‐pval | NES | Genes |
|---|---|---|---|---|
| RAF‐MAPK signalling pathway | Oncogenic (uncontrolled cell proliferation and Apoptosis resistance) | 0.001 | 1.76 | SNAP23, GPD2, AOPEP, SLC24A3, TFPI, PCSK6, WASF3, DKK1, SH3BGRL, DDIT4, TCN1, TSC22D3, CAV1 |
| P53 pathway | Tumour suppressor (apoptosis and cell cycle arrest) | 0.005 | 1.77 | RNF11, LTBP1, UQCRH, S100P, CEACAM6,SDC4, IFI27, MAP3K5, ZNF185, SH3GLB1, RABGAP1L, MEST, DAAM1 DKK1, RP2, AREG, |
| PRC2‐EZH2 pathway (cell fate Transition) | Oncogenic (cell proliferation), tumour suppressor (inhibits cell proliferation) | 0.006 | 1.78 | KIAA0513, ST6GAL1, PKIA, DUSP3, TBXAS1, PIK3CB, SLC2A3, PDGFA, VWA5A, SLPI, ABLIM3, TNFAIP6, CLIP1, MCTP1, CLEC4E, ORAI2, MEGF9, HYAL3, IDS |
| YAP (Hippo signalling pathway) | Oncogenic (cell proliferation and suppression of Apoptotic genes) | 0.011 | 1.76 | THBS1, TNS1, ITGB5, SERPINE1, DAB2, FLNA, CAVIN2, FSTL1 |
| MEK‐MAPK signalling pathway | Oncogenic (uncontrolled cell proliferation and Apoptosis resistance) | 0.015 | 1.63 | SLC6A6, GUCY1B1, LGALSL, S100P, CEACAM6, CAPN2, PKIA, FHL1, SAMD4A, ENO2, ACSL1, MEF2C, SDCBP, NME4, RAB5C, ARHGDIB, IGF2BP2, CRAT |
| ERBB2 signalling pathway | Oncogenic (promotes metastasis) | 0.018 | 1.59 | KIAA0513, SLC6A6, GUCY1B1, CDS2, S100P, CEACAM6, NNT, DAB2, GUCY1A1, TENT5C, FMO5, CAPN2, RAB5C, PDE4D, BNIP3L, ENO2, SDCBP, PAPSS2, NME4, GNAI2 |
| STK33 pathway | Oncogenic (cell migration and tissue invasion) | 0.037 | 1.51 | SH3BGRL2, VCL, MTURN, CALD1, PRKAR2B, RAB27 B, BPI, MSRB3, DEFA4, HBA2, PIK3CB, MS4A3, SLPI, CAST, TENT5C, SNTB1, ABO, ABHD14 B, BICD1, CPED1, PFKM, CXCL16 |
Note: These genes can serve as genomic indicators for Glioblastoma since they are found enriched in certain cancer pathways indicating their crucial role in the onset of disease.
P53 serves as a tumour suppressor, which significantly maintains the homoeostasis of cell in stress conditions, such as hypoxia, sepsis, DNA damage, hypotension, and heat shock. Under these stimuli, p53 gets activated and actuates the cell signalling cascade which either causes apoptosis or cell cycle arrest [80].
YAP serves as a transcriptional regulator for Hippo signalling pathway. It is remarkably involved in the maintenance and development of homoeostasis at tissue level. Its activity along with TAZ plays a pivotal role in cell proliferation, tissue amplification during renewal, and regeneration and organ growth [81].
Enhancer of Zeste Homologue 2 (EZH2) is a catalytic subunit of Polycomb Repressive Complex 2 (PRC2) [82]. PRC2 is critical for cell fate transition and cell proliferation. According to functional studies made about PRC2, it acts as an oncogene in some cancers and a tumour suppressor in others by promoting and inhibiting cell proliferation, respectively. But in glioblastoma, it serves as a tumour suppressor where its one component SUZ12 actively participates in inhibiting cell proliferation [83].
ErbB2 belongs to ErbB receptor family and its receptor signalling pathway is capable of promoting metastatic activities in cancer [84].
Serine/Threonine kinase 33 (STK33) serves as an oncogene as it has been found involved in pathways regulating cell proliferation, differentiation, tissue invasion, metastasis, and tumour development [85].
MAPK pathways play crucial roles in cell proliferation, migration, differentiation, and apoptosis [86].
3.5. GSEA DEGs
We have identified 98 DEGs for glioblastoma using GSEA (see Figure 4) out of which 17 are actively crosstalking between enriched pathways, namely DKK1, MEGF9, S100P, CEACAM6, DAB2, SLPI, PIK3CB, PKIA, TENT5C, KIAA0513, CAPN2, SDCBP, NME4, RAB5BC, SLC6A6, ENO2, and GUCY1B1, which are quite evident in Figure 5.
FIGURE 3.

Gene‐pathway network for PCA‐enriched DEGs. Gene‐pathway network containing differentially expressed genes as genomic biomarkers for glioblastoma using PCA; their involvement in crosstalks; and their variants associated with various brain disorders. 60% of biomarkers are involved in the crosstalks between seven pathways depicted as green diamonds, that is, P1: Cytoplasmic Ribosomal Proteins, P2: Translation Factors, P3: Interferon type I signalling pathways, P4: Electron Transport Chain (OXPHOS system in mitochondria), P5: Ribosome, P6: Huntington disease, P7: Primary immunodeficiency. Pink circles represent unenriched genes, enriched genes are represented by dark pink octagons, purple triangles represent enriched crosstalking genes, whereas big squares of purple and dark pink colour illustrate the genes associated with brain disorders upon SNP analysis.
FIGURE 5.

Gene‐pathway network for GSEA enriched DEGs. Gene‐pathway network containing differentially expressed genes as genomic biomarkers for glioblastoma using GSEA; their involvement in crosstalks; and their variants associated with numerous brain disorders. 18% of biomarkers are involved in the crosstalks between seven enriched oncogenic pathways, which abet cancer hallmarks depicted as green diamonds, that is, P1: RAF‐MAPK signalling pathway, P2: P53 signalling pathway, P3: PRC2‐EZH2 signalling pathway, P4: YAP‐conserved (Hippo signalling pathway), P5: MEK‐MAPK signalling pathway, P6: ERBB2 signalling pathway, P7: STK33 pathway. Yellow circles represent unenriched genes, enriched genes are represented by dark pink octagons, purple triangles represent enriched crosstalking genes, whereas big squares of purple and dark pink colour illustrate the genes associated with brain disorders upon SNP analysis.
3.6. Single‐nucleotide polymorphism (SNP) analysis
We performed SNP analysis on the set of DEGs we identified using PCA and GSEA, which comprises a total of 139 genes, 42 from former and 97 from later. All of these genes are found associated with cancer fostering pathways in this study. This analysis is performed to better understand the onset of Glioblastoma as SNPs help to understand the aetiology of diseases. In Supporting Information S5 Datasheet and S6 Datasheet, we have mentioned the queried genes in DisGeNET involved in brain disorders, alongside their SNPs reporting highest DisGeNET disease association score. A total of 36 DEGs (6 from PCA and 30 from GSEA) have been identified from this analysis having one or more SNPs associated with brain disorders (see Table 3 and Table 4).
TABLE 3.
SNPs association with brain disorders for PCA DEGs.
| Gene | SNPs | Disease(s) associated with SNP |
|---|---|---|
| EIF3G | rs3826784 | Narcolepsy, Narcolepsy 1 |
| rs2305795 | Narcolepsy, Narcolepsy 1 | |
| EIF4EBP1 | rs1208512188 | Anxiety disorders |
| rs1276624859 | Bipolar disorders, anxiety disorders, anxiety | |
| NDUFA12 | rs249153 | Alzheimer's disease |
| rs249166 | Alzheimer's disease | |
| rs249167 | Alzheimer's disease | |
| RPL6 | rs1214031315 | Pilocytic astrocytoma, childhood pilocytic astrocytoma, adult pilocytic astrocytoma |
| RPSA | rs747760223 | Alzheimer's disease, Parkinson's disease |
| SOD2 | rs4880 | Parkinson's disease, epilepsy |
| rs953038635 | Schizophrenia, Parkinson's disease, major depressive disorder, Alzheimer's disease |
TABLE 4.
SNPs association with brain disorders for GSEA DEGs.
| Gene | SNPs | Disease(s) associated with SNP |
|---|---|---|
| ABO | rs505922 | Ischaemic stroke |
| rs529565 | Ischaemic stroke, cerebrovascular accident | |
| BNIP3L | rs73219805 | Schizophrenia |
| rs1042992 | Schizophrenia | |
| rs77609452 | Impaired cognition | |
| BPI | rs6024905 | Psychotic disorders, mental disorders |
| CALD1 | rs756573441 | Huntington's disease |
| CAPN2 | rs760073870 | Tauopathies |
| CAST | rs1235134025 | Tauopathies |
| rs1559085 | Sporadic Parkinson's disease | |
| rs752410089 | Tauopathies | |
| CRAT | rs138665095 | Progressive neurologic deterioration |
| rs141970897 | Leigh disease | |
| rs762425351 | Leigh disease | |
| CXCL16 | rs2277680 | Cerebrovascular accident |
| FSTL1 | rs1700 | Schizophrenia |
| GUCY1A1 | rs7692387 | Cerebrovascular accident |
| HYAL3 | rs1377666593 | Parkinson's disease |
| IFI27 | rs544899118 | Squamous cell carcinoma of the head and neck |
| ITGB5 | rs7373878 | Major depressive disorder |
| MCTP1 | rs17418283 | Bipolar disorder |
| MEF2C | rs1554139771 | Movement disorders |
| rs1065861 | Schizophrenia | |
| rs1561824498 | Autism spectrum disorders | |
| MEST | rs863223353 | Schizophrenia, childhood |
| MS4A3 | rs474951 | Alzheimer's disease |
| MSRB3 | rs61921502 | Alzheimer's disease, cerebrovascular accident |
| PCSK6 | rs11855415 | Dyslexia |
| PDE4D | rs7732249 | Schizophrenia |
| rs966221 | Ischaemic stroke | |
| PDGFA | rs755794544 | Adult glioblastoma, childhood glioblastoma, glioblastoma, glioblastoma multiforme |
| PIK3CB | rs752021744 | Tumour progression |
| RAB27 B | rs1833288 | Major depressive disorder |
| RABGAP1L | rs17301853 | Common migraine, migraine disorders |
| rs75650221 | Major depressive disorder | |
| SAMD4A | rs4901536 | Schizophrenia |
| SLC24A3 | rs3790171 | Neuroblastoma |
| rs4814864 | Migraine disorders | |
| rs6081613 | Migraine disorders | |
| SLPI | rs771884087 | Nervous system disorder |
| SERPINE1 | rs763351020 | Ischaemic stroke |
| rs1349041080 | Severe dementia | |
| rs1442033697 | Tumour cell invasion | |
| rs1799768 | Epilepsy, temporal lobe | |
| rs1799889 | Meningitis, pneumococcal | |
| ST6GAL1 | rs3936289 | Alzheimer's disease |
| TBXAS1 | rs10277664 | Schizophrenia |
| rs10487667 | Ischaemic stroke | |
| rs41708 | Cerebrovascular accident |
4. DISCUSSION
Glioblastoma exists as one of the deadliest cancers in the history of mankind till date; because when it is diagnosed, the maximum of the damage has been done already leaving its sufferers with a small life expectancy rate [5]. Since it is intracranial cancer, surgery coupled with chemo and radiotherapy is the only resort [4]. Cancer usually occurs as a consequence of genomic instability; therefore, genomic biomarkers always play a pivotal role in order to understand the dynamics, diagnosis, prognosis, and treatment of disease [87]. In this study, we have used TEP data (which comes from liquid biopsies that are non‐invasive in nature and can be obtained at any time over the course of disease) to identify genomic biomarkers for glioblastoma. The obtained results hold quite significant information in order to understand the onset and prevalence of disease.
In this study, we have identified genomic biomarkers for glioblastoma using principal component analysis [28] as a non‐canonical and gene set enrichment analysis [36] as a canonical method. The former one is used with SVD (singular value decomposition) as a dimensionality reduction approach on the RNA‐seq dataset of glioblastoma obtained from ArrayExpress containing 39 experimental and 43 control samples. The high‐dimensional RNA‐seq data has been reduced to smaller dimensions and volume in order to preserve significant gene signatures by reducing multicollinearity to represent the rest of the data. Reduced signatures (aka features) obtained from the first three PCs were further used by the decision tree algorithm to classify healthy and control samples to check for their representation (predictive) potential, which was evaluated with an accuracy score of 0.98. Whereas the latter approach is used on the same dataset to interpret gene expression by focusing on the group of genes either performing similar biological functions, regulating the same pathway, or sharing a common location on the chromosome. Both approaches provided different results, which highlight the fact that different methods come out with different results that being noteworthy help in solving the mega‐puzzle of disease dynamics by providing a sensible understanding.
The DEGs from PCA appear enriched in seven pathways responsible for protein translation (as it involves ribosomal pathways), electron transport chain, immunity, and Huntington's disease, which indirectly foster some cancer hallmarks (see Figure 6). A big proportion of enriched pathways correspond to ribosomal functions, which play a vital role in translation from mRNA to protein. Defects in ribosomes have been linked to cancer or ribosomopathies. Ribosomal mutations can either be congenital or somatic, the former results in ribosomopathies, which increase the risk of developing cancer whereas, the latter results in various cancers. Since ribosomes serve as machinery for protein translation; therefore, defective ribosomes hardly yield functional protein poly peptides [40]. The enriched and crosstalk genes in ribosomal pathways are RPL3, RPL5, RPL6, RPL10 A, RPL11, RPL14, RPL22, RPL27, RPSA, RPS3A, RPS3, RPS5, and RPS8. The RPLs belong to large and RPSs belong to a small subunit of ribosome [88] and out of large subunit proteins, RPL5, RPL10, and RPL11 appear quite famous in literature for undergoing somatic mutations [40]. RPL3, RPL5, RPL6, RPL10 A, RPL11, RPL14, RPL22, RPL27, RPS3, and RPS8 are crucial for ribosome assembly [45, 54], whereas RPSA, RPS3A, and RPS5 play their role in matrix adhesion [50], NFκβ signalling pathway [62], and translation [52], respectively. Alterations in these genes have been found associated with several cancers as they play crucial roles in cell cycle activities also. RPL3 helps in apoptosis and cell migration [49], RPL5, RPL11 and RPL22 in tumour suppression [46, 47, 58, 63], RPL6 in p53 stabilisation [56], RPL10 A appears as a hub gene in breast cancer [55], RPL14 in tumourigenesis [59], RPSA in tumour progression [51], RPS3A in apoptosis [61], RPS3 in apoptosis and DNA repair [57], while RPS5 in cell differentiation and apoptosis [53]. Moreover, apart from regulating translation, some ribosomal genes also regulate certain genes like MDM2, which inhibit p53. Under conditions like starvation, environmental stress (intra or inter‐cellular), or the presence of anti‐growth signals, ribosome biogenesis is stalled, which results in the freedom of ribosomal proteins from MDM2 complexes resulting in p53 activation. P53 under such grueling conditions induces cell cycle arrest and apoptosis. Normal or low levels of these proteins are important for p53 regulation but increased levels cause problems, deviating the system from normal behaviour to oncogenic behaviour [40] where tumour cells replicate rapidly avoiding the anti‐growth and apoptotic signals.
FIGURE 6.

Cancer hallmarks. Enriched signalling pathways from GSEA and PCA alongside their cross‐connection with cancer hallmarks.
Reactive oxygen species (ROS) are capable of controlling signal transduction pathways, and on the basis of their levels, can either be oncogenic or tumour suppressive. There are several sources of ROS generation in the cell, that is, mitochondria, endoplasmic reticulum, and peroxisomes (high oxygen consumption), which produce ROS in response to cytokines, foreign particle invasion, xenobiotics etc. A major source for ROS production is the electron transport chain (ETC) in mitochondria aka the mitochondrial respiratory chain. ROS are formed when electrons escape from ETC and react with oxygen molecules, and their perturbed levels can affect cell survival and proliferation. However, some oncogenic pathways confiscate ETC to increase ROS production in order to keep tumour phenotype [43]. In our study, we have identified eight enriched genes that are crosstalking between mitochondrial ETC and Huntington's disease (HD) pathway. These common DEGs include ATP5MC1, NDUFA12, NDUFAB1, NDUFB10, NDUFB2, SLC25A6, UQCRC2, and UQCRQ. ATP5MC1 and SLC25A6 are responsible for ATP synthesis [70] and ATP exchange [66], respectively; NDUFA12, NDUFAB1, NDUFB10, and NDUFB2 encode proteins, which are sub‐units of NADH dehydrogenase, which is one of the five complexes of electron transport chain [65], whereas UQCRC2 and UQCRQ participate in electron transport chain [64, 69]. HD is a progressive neurodegenerative disorder that causes hyperkinetic musculature problems as certain parts of the brain get damaged over time, which is responsible for muscle coordination and the development of motor skills. It is a hereditary disease caused by inheriting a defective huntingtin gene (HTT) from at least one of the affected parents. Surprisingly, HD reduces the risk of developing cancer in its patients [44]. Though HD pathway does not foster any of the cancer hallmark pathways as mentioned above, some of the DEGs that appeared enriched in them are responsible for crosstalk between HD and ETC pathways; which may indirectly contribute to tumour progression. Thus, from these genes, only SLC25A6 and UQCRC2 participate in apoptosis [67] and tumourigenesis [69], respectively.
Cancer always puts the immune system of the body at stake. Immune cells are responsible for killing the diseased and infected cells in order to maintain a healthy environment inside the body, but unfortunately, tumour cells evade the immune system causing havoc to normal health [41]. In this study, we have identified four enriched crosstalk genes in primary immunodeficiency, Interferon type I signalling, and translation factors pathways; that is, LCK, PTPRC, EIF4A1, and EIF4EBP1. The former two genes are crosstalking between the first two pathways and the latter two are crosstalking between the latter two pathways, respectively. People suffering from PI have malfunctioned immune system and therefore, they are more prone to get infected and become grievously sick. Moreover, they are at higher risk of developing cancers [89]. Whereas interferon signalling is one of the critical pathways in human immune response where it increases cellular resistance and ceases cell growth against viral infections. Immune dysfunction appears as a consequence of cancer affecting different immune pathways. In experimental groups, interferon type I signalling has been found reduced in adaptive immune cells (T and B) as compared to control healthy groups due to certain alterations in the involved proteins [90]. Immuno compensation renders the tumour cells to evade apoptosis by bypassing all the anti‐growth signals and proliferate in an uncontrolled fashion with sustained angiogenesis [41]. The general function of LCK and PTPRC is T and B cell signalling [71, 73] but regarding cancer, they participate in cell proliferation [72] and tumourigenesis [74], respectively. Whereas EIF4A1 and EIF4EBP1 are responsible for translation [75] and translation repression [77], respectively; but with respect to cancer EIF4A1 promotes metastasis [76], while EIF4EBP1 promotes tumourigenesis when phosphorylated [78] and suppresses tumourigenesis when unphosphorylated [79].
However, the DEGs we obtained from GSEA appear enriched in pathways that foster several cancer hallmarks (see Figure 6). As mentioned in the previous section, GSEA results include MAPK (Raf, MEK) [86], P53 [80], PRC2‐EZH2 [82, 83], YAP conserved (Hippo signalling) [81], ErbB2 [84], and STK33 [85] signalling pathways. The MAPK pathway is critical to cell survival and growth. Mutations in these pathways result in uncontrolled cellular proliferation and apoptotic resistance where cell death signals are bypassed. Its main signalling molecules include ERK, MEK, Ras, and Raf. Raf and MEK belong to the ERK module (pathway), which is one of the most studied MAPK pathway, where MEK phosphorylates ERK and itself gets phosphorylated by Raf. Dysregulations in this module of MAPK often make it a culprit for tumourigenesis [86]. The crosstalking enriched genes in the Raf‐MAPK pathway are DKK1 and MEGF9; former crosstalks with P53 signalling pathway, whereas later crosstalks with PRC2‐EZH2 pathway. Generally, DKK1 participates in embryonic development [91] but in cancer, it regulates tumour progression as it is a well‐known inhibitor of Wnt signalling pathway [92]. MEGF9 is mainly expressed in the brain where its translated protein acts as a signalling molecule [93].
P53 is able to maintain genomic integrity in the body by activating repair mechanisms if any damage in DNA has been encountered. It either fixes the damage and cell functions normally or if the damage is irreparable, then kills the cell by initiating apoptosis or halts the cell by inducing cell cycle arrest. This whole process involves a p53 transduction pathway where the levels of p53 are high. Its loss of function has been observed in most cancers where cells bypass all apoptotic signals and keep proliferating [94]. Apart from DKK1, we have identified S100P and CEACAM6 as enriched crosstalking DEGs where the former cross communicates between P53 signalling pathway and MEK‐MAPK signalling pathway and later does between P53 signalling pathway and ERBB2 signalling pathways. S100P participates in cell proliferation and cell migration [95]. CEACAM6 is crucial to cell proliferation and cell adhesion [96].
Proteins from the Polycomb group (PcG) appear as epigenetic factors and dysregulation in their pathways occurs as a frequent process in cancer. PRC2 comprises two catalytic sub‐units namely EZH1 and EZH2, which are responsible for its histone methyl transferase activity. Mutations in catalytic sub‐units of PRC2 have shown a positive correlation with certain cancer types. PRC2 shows both oncogenic and tumour‐suppressive roles; when EZH2 undergoes somatic mutations, its catalytic activity is hyperactivated rendering PRC2 to reveal its oncogenic side. Contrary to this mutation causing loss of function in PRC2 catalytic substrate as H3K27 turns on PRC2's tumour suppressive side [83]. This pathway has five crosstalking enriched genes, namely MEGF9, SLPI, PIK3CB, PKIA, and KIAA0513. MEGF9 is responsible for crosstalking between RAF‐MAPK and PRC2‐EZH2 pathways, SLPI and PIK3CB between PRC2‐EZH2 and STK33 pathways, PKIA between PRC2‐EZH2 and MEK‐MAPK pathways, whereas KIAA0513 between PRC2‐EZH2 and ErbB2 pathways. SLPI promotes cell proliferation and inhibits inflammation [97], PIK3CB is critical for cell growth and invasion [98] and KIAA0513 is expressed in brain tissues where it plays its role in apoptosis, cytoskeletal regulation, and neuroplasticity [99].
Hippo signalling pathway is crucial to tumourigenesis and genetic alterations in its major constituent components, that is, YAP, TAZ, MST (1, 2), and LATS (1, 2) stimulate cellular migration, neighbouring or distant tissue invasion, and malignancy of tumour cells. YAP serves as an efficient and active transcriptional regulator in tumour malignancies. Along with its paralog TAZ, it is vital for cancer initiation or tumour growth promotion. Hippo pathway with LATS activation suppresses the YAP/TAZ activity; thus, the conservation of YAP is necessary for tumourigenesis. The YAP conserved pathway serves as one of the major cancer‐promoting pathways by initiating tumour development [100]. In this pathway, we have one enriched crosstalking gene, which links it to the ErbB2 pathway, namely DAB2. It is an endocytic adaptor that is responsible for inhibiting cell growth [101].
STK33 carries a kinase domain and comes from Ca2+ calmodulin‐dependent kinase family. It shows a limited expression in most of the human tissues except for testicular cells, where its expression is very high. It has been found to have a synthetic lethal interaction with the mutated KRAS gene in several tumour cells. STK33 promotes tumourigenesis by stimulating cell migration, invasion of neighbouring tissues, and epithelial‐mesenchymal transition (EMT) [85]. This pathway constitutes of one enriched crosstalking gene with the ErbB2 pathway, that is, TENT5C. It has a close association with B cells and it has been found in the literature that it stimulates humoral immune response [102].
ErbB2 receptor initiates its pathway to assist cells in their growth, differentiation, and programmed death. The overexpression of the ErbB2 receptor turns its oncogenic switch on, making it pivotal in many human malignancies. In its overexpressed form, it enhances the metastatic potential of tumour cells [84]. We have identified seven enriched genes that are participating in crosstalks between ErbB2 and MEK‐MAPK pathways, namely CAPN2, ENO2, GUCY1B1, NME4, RAB5C, SDCBP, and SLC6A6.
Therefore, using PCA we have identified 42 DEGs, out of which RPS3A, RPL27, UQCRQ, NDUFA12, SLC25A6, NDUFB2, and ATP5MC1 have not been associated with GBM before. The diagnostic ability of these genes has been validated in Section 3.2. Moreover, using GSEA, we have identified 98 DEGs where two of these appear as new biomarkers, namely SNAP23 and UQCRH. These results had been verified using Harmonizome [103]. Their functions have been discussed above in detail, which indicate that these can be used as prognostic biomarkers for GBM.
Furthermore, SNP analysis performed on identified DEGs aided to elucidate the aetiology of glioblastoma. The variants of certain identified DEGs have associations with several brain disorders and tumours (Tables 3 and 4). These include Narcolepsy, anxiety, and bipolar disorders, Alzheimer's disease, Parkinson's disease, Huntington's disease, epilepsy, Leigh disease, schizophrenia, mental, psychotic, and major depressive disorders, Ischaemic stroke, cerebrovascular accident, impaired cognition, tauopathies, progressive neurologic deterioration, dyslexia, autism, migraine, dementia, pneumococcal meningitis, squamous cell carcinoma of head and neck, astrocytoma, neuroblastoma, and glioblastoma. This information pinpoints that the identified biomarkers in this study hold a very pivotal role in glioblastoma onset and progression as variations in their genomic sequences have already been reported to be associated with many nervous dysfunctionalities.
Biological systems are dynamical in nature and perturbations in a pathway can be viewed as a consequence of alterations in a few genes. The involvement of such genes in crosstalks between other pathways provides a wholesome view for understanding the dynamical behaviour of a system. It helps in tracing back the causes to formulate better propositions for study and finding good therapeutic targets. Most of the identified DEGs exist in literature already as probable biomarkers for glioblastoma but this study highlights their involvement in crosstalks with other pathways nurturing cancer hallmarks (either directly or indirectly) also.
5. CONCLUSION
This study focuses on the identification of DEGs as genomic biomarkers for glioblastoma using canonical and machine‐learning approaches, namely GSEA and PCA, respectively, and highlighting the role of these DEGs in crosstalks between pathways nurturing cancer hallmarks. The major limitation of this study is the sparse availability of data as glioblastoma is an aggressive brain tumour, and owing to its intracranial nature, it is hard to get more samples as surgeries are not excessively performed in this case. Therefore, we have used TEP data for this purpose to see how much meaningful information can be obtained. In this regard, the identified DEGs have been found enriched in important oncogenic, neurodegenerative disease, and translational pathways, which play a direct role in the onset of disease. Moreover, the identified SNPs of these biomarkers associated with numerous brain disorders enhance our knowledge regarding possible implication of these genes in disease mechanism. This work suggests that glioblastoma is regulated by complex gene interactions in several pathways simultaneously, which should be kept under consideration while proposing new therapeutic targets. These findings may contribute to comprehend the disease dynamics of glioblastoma better at molecular and genomic levels while using TEP data. This can serve as an appealing future direction for such biomarker‐based therapies using liquid biopsies.
AUTHOR CONTRIBUTION
Darrak Quddusi: Conceptualisation, Data curation, Formal analysis, Investigation, Methodology, Project administration, Software, Validation, Visualisation, Writing – original draft, Writing – review and editing. Naim Bajcinca: Conceptualisation, Resources, Supervision, Writing – review and editing
CONFLICT OF INTEREST STATEMENT
There is no conflict of interest.
Supporting information
Supporting Information S1
Supporting Information S2
Supporting Information S3
Supporting Information S4
Supporting Information S5
Supporting Information S6
Supporting Information S7
ACKNOWLEDGEMENT
We like to express our gratitude to Dr. Amnah Siddiqa (The Jackson Laboratory for Genomic Medicine, Farmington, Connecticut, USA) and Ms. Iqra Batool (Technische Universität Kaiserslautern, Kaiserslautern, Germany) for her invaluable assistance in this study.
Open Access funding enabled and organized by Projekt DEAL.
Quddusi, D.M. , Bajcinca, N. : Identification of genomic biomarkers and their pathway crosstalks for deciphering mechanistic links in glioblastoma. IET Syst. Biol. 17(4), 143–161 (2023). 10.1049/syb2.12066
DATA AVAILABILITY STATEMENT
The data that support the findings of this study are available in Array Express at https://www.ebi.ac.uk/arrayexpress/, reference number GSE68086. These data were derived from the following resources available in the public domain: https://www.ebi.ac.uk/arrayexpress/experiments/E‐GEOD‐68086/?query=GSE68086.
REFERENCES
- 1. Jessen, K.R. , Richardson, W.D. : Glial Cell Development: Basic Principles and Clinical Relevance, vol. 1. Oxford University Press, USA: (2001) [Google Scholar]
- 2. Louis, D.N. , Ohgaki, H. , Wiestler, O.D. , Cavenee, W.K. , Burger, P.C. , Jouvet, A. , Scheithauer, B.W. , Kleihues, P. : The 2007 WHO classification of tumours of the central nervous system. Acta Neuropathol. 114(2), 97–109 (2007). 10.1007/s00401-007-0278-6 [DOI] [PMC free article] [PubMed] [Google Scholar]
- 3. Drabycz, S. , Roldán, G. , De Robles, P. , Adler, D. , McIntyre, J.B. , Magliocco, A.M. , Cairncross, J.G. , Mitchell, J.R. : An analysis of image texture, tumor location, and MGMT promoter methylation in glioblastoma using magnetic resonance imaging. Neuroimage 49(2), 1398–1405 (2010). 10.1016/j.neuroimage.2009.09.049 [DOI] [PubMed] [Google Scholar]
- 4. Batash, R. , Asna, N. , Schaffer, P. , Francis, N. , Schaffer, M. : Glioblastoma multiforme, diagnosis and treatment; recent literature review. Curr. Med. Chem. 24(27), 3002–3009 (2017). 10.2174/0929867324666170516123206 [DOI] [PubMed] [Google Scholar]
- 5. Ostrom, Q.T. , Cioffi, G. , Gittleman, H. , Patil, N. , Waite, K. , Kruchko, C. , Barnholtz‐Sloan, J.S. : CBTRUS statistical report: primary brain and other central nervous system tumors diagnosed in the United States in 2012–2016. Neuro Oncol. 21(Supplement_5), v1–v100 (2019). Supplement_5):v1–v100. 10.1093/neuonc/noz150 [DOI] [PMC free article] [PubMed] [Google Scholar]
- 6. Van Meir, E.G. , Hadjipanayis, C.G. , Norden, A.D. , Shu, H.K. , Wen, P.Y. , Olson, J.J. : Exciting new advances in neuro‐oncology: the avenue to a cure for malignant glioma. CA A Cancer J. Clin. 60(3), 166–193 (2010). 10.3322/caac.20069 [DOI] [PMC free article] [PubMed] [Google Scholar]
- 7. Schaffer, M. , Hofstetter, A. , Ertl‐Wagner, B. , Batash, R. , Pöschl, J. , Schaffer, P. : Treatment of astrocytoma grade III with Photofrin II as a radiosensitizer. Strahlenther. Onkol. 189(11), 972–976 (2013). 10.1007/s00066-013-0430-2 [DOI] [PubMed] [Google Scholar]
- 8. Ishikawa, E. , Tsuboi, K. , Saijo, K. , Harada, H. , Takano, S. , Nose, T. , et al.: Autologous natural killer cell therapy for human recurrent malignant glioma. Anticancer Res. 24(3B), 1861–1871 (2004) [PubMed] [Google Scholar]
- 9. Harris, V.K. , Sadiq, S.A. : Disease biomarkers in multiple sclerosis. Mol. Diagn. Ther. 13(4), 225–244 (2009). 10.1007/bf03256329 [DOI] [PubMed] [Google Scholar]
- 10. Urbańska, K. , Sokołowska, J. , Szmidt, M. , Sysa, P. : Glioblastoma multiforme–an overview. Contemp. Oncol. 18(5), 307–312 (2014). 10.5114/wo.2014.40559 [DOI] [PMC free article] [PubMed] [Google Scholar]
- 11. Alifieris, C. , Trafalis, D.T. : Glioblastoma multiforme: pathogenesis and treatment. Pharmacol. Ther. 152, 63–82 (2015). 10.1016/j.pharmthera.2015.05.005 [DOI] [PubMed] [Google Scholar]
- 12. Siravegna, G. , Marsoni, S. , Siena, S. , Bardelli, A. : Integrating liquid biopsies into the management of cancer. Nat. Rev. Clin. Oncol. 14(9), 531–548 (2017). 10.1038/nrclinonc.2017.14 [DOI] [PubMed] [Google Scholar]
- 13. Heitzer, E. , Haque, I.S. , Roberts, C.E. , Speicher, M.R. : Current and future perspectives of liquid biopsies in genomics‐driven oncology. Nat. Rev. Genet. 20(2), 71–88 (2019). 10.1038/s41576-018-0071-5 [DOI] [PubMed] [Google Scholar]
- 14. Li, Y. , Agarwal, P. , Rajagopalan, D. : A global pathway crosstalk network. Bioinformatics 24(12), 1442–1447 (2008). 10.1093/bioinformatics/btn200 [DOI] [PubMed] [Google Scholar]
- 15. Bo, L. , Wei, B. , Li, C. , Wang, Z. , Gao, Z. , Miao, Z. : Identification of potential key genes associated with glioblastoma based on the gene expression profile. Oncol. Lett. 14(2), 2045–2052 (2017). 10.3892/ol.2017.6460 [DOI] [PMC free article] [PubMed] [Google Scholar]
- 16. Alshabi, A.M. , Vastrad, B. , Shaikh, I.A. , Vastrad, C. : Identification of crucial candidate genes and pathways in glioblastoma multiform by bioinformatics analysis. Biomolecules 9(5), 201 (2019). 10.3390/biom9050201 [DOI] [PMC free article] [PubMed] [Google Scholar]
- 17. Zhang, M. , Lv, X. , Jiang, Y. , Li, G. , Qiao, Q. : Identification of aberrantly methylated differentially expressed genes in glioblastoma multiforme and their association with patient survival. Exp. Ther. Med. 18(3), 2140–2152 (2019). 10.3892/etm.2019.7807 [DOI] [PMC free article] [PubMed] [Google Scholar]
- 18. Zhou, Y. , Yang, L. , Zhang, X. , Chen, R. , Chen, X. , Tang, W. , Zhang, M. : Identification of potential biomarkers in glioblastoma through bioinformatic analysis and evaluating their prognostic value. BioMed Res. Int. 2019, 1–13 (2019). 10.1155/2019/6581576 [DOI] [PMC free article] [PubMed] [Google Scholar]
- 19. Best, M.G. , Sol, N. , Kooi, I. , Tannous, J. , Westerman, B.A. , Rustenburg, F. , Schellen, P. , Verschueren, H. , Post, E. , Koster, J. , Ylstra, B. , Ameziane, N. , Dorsman, J. , Smit, E. , Verheul, H. , Noske, D. , Reijneveld, J. , Nilsson, R. , Tannous, B. , Wesseling, P. , Wurdinger, T. : RNA‐Seq of tumor‐educated platelets enables blood‐based pan‐cancer, multiclass, and molecular pathway cancer diagnostics. Cancer Cell 28(5), 666–676 (2015). 10.1016/j.ccell.2015.09.018 [DOI] [PMC free article] [PubMed] [Google Scholar]
- 20. Kukurba, K.R. , Montgomery, S.B. : RNA sequencing and analysis. Cold Spring Harb. Protoc. 2015(11), top084970 (2015). pdb–. 10.1101/pdb.top084970 [DOI] [PMC free article] [PubMed] [Google Scholar]
- 21. Conesa, A. , Madrigal and others. A survey of best practices for RNA‐seq data analysis Genome biology 17(1), 1–9 (2016) [DOI] [PMC free article] [PubMed] [Google Scholar]
- 22. Babraham Institute : Fast QC. https://www.bioinformatics.babraham.ac.uk/projects/fastqc/ (2012)
- 23. Kim, D. , Langmead, B. , Salzberg, S.L. : HISAT: a fast spliced aligner with low memory requirements. Nat. Methods 12(4), 357–360 (2015). 10.1038/nmeth.3317 [DOI] [PMC free article] [PubMed] [Google Scholar]
- 24. Wang, L. , Wang, S. , Li, W. : RSeQC: quality control of RNA‐seq experiments. Bioinformatics 28(16), 2184–2185 (2012). 10.1093/bioinformatics/bts356 [DOI] [PubMed] [Google Scholar]
- 25. Li, H. , Handsaker, B. , Wysoker, A. , Fennell, T. , Ruan, J. , Homer, N. , Marth, G. , Abecasis, G. , Durbin, R. : The sequence alignment/map format and SAMtools. Bioinformatics 25(16), 2078–2079 (2009). 10.1093/bioinformatics/btp352 [DOI] [PMC free article] [PubMed] [Google Scholar]
- 26. Pertea, M. , Pertea, G.M. , Antonescu, C.M. , Chang, T.C. , Mendell, J.T. , Salzberg, S.L. : StringTie enables improved reconstruction of a transcriptome from RNA‐seq reads. Nat. Biotechnol. 33(3), 290–295 (2015). 10.1038/nbt.3122 [DOI] [PMC free article] [PubMed] [Google Scholar]
- 27. Ward, R.M. , Schmieder, R. , Highnam, G. , Mittelman, D. : Big data challenges and opportunities in high‐throughput sequencing. Syst. Biomed. 1(1), 29–34 (2013). 10.4161/sysb.24470 [DOI] [Google Scholar]
- 28. Tanwar, S. , Ramani, T. , Tyagi, S. : Dimensionality reduction using PCA and SVD in big data: a comparative case study. In: International Conference on Future Internet Technologies and Trends, pp. 116–125. Springer; (2017) [Google Scholar]
- 29. Abdi, H. , Williams, L.J. : Principal component analysis. Wiley interdisciplinary reviews: Comput. Stat. 2(4), 433–459 (2010). 10.1002/wics.101 [DOI] [Google Scholar]
- 30. Wang, Y. , Zhu, L. : Research and implementation of SVD in machine learning. In: : 2017 IEEE/ACIS 16th International Conference on Computer and Information Science (ICIS), pp. 471–475. IEEE; (2017) [Google Scholar]
- 31. Rokach, L. , Maimon, O. : Decision trees. In: Data Mining and Knowledge Discovery Handbook, pp. 165–192. Springer; (2005) [Google Scholar]
- 32. MacKay, D.J. , Mac Kay, D.J. : Information Theory, Inference and Learning Algorithms. Cambridge university press; (2003) [Google Scholar]
- 33. Banerjee, A. , Chitnis, U. , Jadhav, S. , Bhawalkar, J. , Chaudhury, S. : Hypothesis testing, type I and type II errors. Ind. Psychiatr. J. 18(2), 127 (2009). 10.4103/0972-6748.62274 [DOI] [PMC free article] [PubMed] [Google Scholar]
- 34. Sokolova, M. , Japkowicz, N. , Szpakowicz, S. : Beyond accuracy, F‐score and ROC: a family of discriminant measures for performance evaluation. In: Australasian Joint Conference on Artificial Intelligence, pp. 1015–1021. Springer; (2006) [Google Scholar]
- 35. Chen, E.Y. , Tan, C.M. , Kou, Y. , Duan, Q. , Wang, Z. , Meirelles, G.V. , Clark, N.R. , Ma’ayan, A. : Enrichr: interactive and collaborative HTML5 gene list enrichment analysis tool. BMC Bioinf. 14(1), 1–14 (2013). 10.1186/1471-2105-14-128 [DOI] [PMC free article] [PubMed] [Google Scholar]
- 36. Subramanian, A. , Tamayo, P. , Mootha, V.K. , Mukherjee, S. , Ebert, B.L. , Gillette, M.A. , Paulovich, A. , Pomeroy, S.L. , Golub, T.R. , Lander, E.S. , Mesirov, J.P. : Gene set enrichment analysis: a knowledge‐based approach for interpreting genome‐wide expression profiles. Proc. Natl. Acad. Sci. USA 102(43), 15545–15550 (2005). 10.1073/pnas.0506580102 [DOI] [PMC free article] [PubMed] [Google Scholar]
- 37. Piñero, J. , Ramírez‐Anguita, J.M. , Saüch‐Pitarch, J. , Ronzano, F. , Centeno, E. , Sanz, F. , et al.: The DisGeNET knowledge platform for disease genomics: 2019 update. Nucleic Acids Res. 48(D1), D845–D855 (2020) [DOI] [PMC free article] [PubMed] [Google Scholar]
- 38. Shannon, P. , Markiel, A. , Ozier, O. , Baliga, N.S. , Wang, J.T. , Ramage, D. , Amin, N. , Schwikowski, B. , Ideker, T. : Cytoscape: a software environment for integrated models of biomolecular interaction networks. Genome Res. 13(11), 2498–2504 (2003). 10.1101/gr.1239303 [DOI] [PMC free article] [PubMed] [Google Scholar]
- 39. Kutmon, M. , Lotia, S. , Evelo, C.T. , Pico, A.R. : WikiPathways App for Cytoscape: making biological pathways amenable to network analysis and visualization. F1000Research 3, 152 (2014). 10.12688/f1000research.4254.1 [DOI] [PMC free article] [PubMed] [Google Scholar]
- 40. Sulima, S.O. , Hofman, I.J. , De Keersmaecker, K. , Dinman, J.D. : How ribosomes translate cancer. Cancer Discov. 7(10), 1069–1087 (2017). 10.1158/2159-8290.cd-17-0550 [DOI] [PMC free article] [PubMed] [Google Scholar]
- 41. De Visser, K.E. , Eichten, A. , Coussens, L.M. : Paradoxical roles of the immune system during cancer development. Nat. Rev. Cancer 6(1), 24–37 (2006). 10.1038/nrc1782 [DOI] [PubMed] [Google Scholar]
- 42. Bhat, M. , Robichaud, N. , Hulea, L. , Sonenberg, N. , Pelletier, J. , Topisirovic, I. : Targeting the translation machinery in cancer. Nat. Rev. Drug Discov. 14(4), 261–278 (2015). 10.1038/nrd4505 [DOI] [PubMed] [Google Scholar]
- 43. Raimondi, V. , Ciccarese, F. , Ciminale, V. : Oncogenic pathways and the electron transport chain: a dangeROS liaison. Br. J. Cancer 122(2), 168–181 (2020). 10.1038/s41416-019-0651-y [DOI] [PMC free article] [PubMed] [Google Scholar]
- 44. Walker, F.O. : Huntington’s disease. Lancet 369(9557), 218–228 (2007). 10.1016/s0140-6736(07)60111-1 [DOI] [PubMed] [Google Scholar]
- 45. Klein, D. , Moore, P. , Steitz, T. : The roles of ribosomal proteins in the structure assembly, and evolution of the large ribosomal subunit. J. Mol. Biol. 340(1), 141–177 (2004). 10.1016/j.jmb.2004.03.076 [DOI] [PubMed] [Google Scholar]
- 46. Fancello, L. , Kampen, K.R. , Hofman, I.J. , Verbeeck, J. , De Keersmaecker, K. : The ribosomal protein gene RPL5 is a haploinsufficient tumor suppressor in multiple cancer types. Oncotarget 8(9), 14462–14478 (2017). 10.18632/oncotarget.14895 [DOI] [PMC free article] [PubMed] [Google Scholar]
- 47. Vlachos, A. : Acquired ribosomopathies in leukemia and solid tumors, Hematology 2014, the American Society of Hematology Education Program Book. 2017, vol. 2017(1), pp. 716–719 [DOI] [PMC free article] [PubMed] [Google Scholar]
- 48. Kula, A. , Guerra, J. , Knezevich, A. , Kleva, D. , Myers, M.P. , Marcello, A. : Characterization of the HIV‐1 RNA associated proteome identifies Matrin 3 as a nuclear cofactor of Rev function. Retrovirology 8(1), 1–15 (2011). 10.1186/1742-4690-8-60 [DOI] [PMC free article] [PubMed] [Google Scholar]
- 49. Russo, A. , Pagliara, V. , Albano, F. , Esposito, D. , Sagar, V. , Loreni, F. , Irace, C. , Santamaria, R. , Russo, G. : Regulatory role of rpL3 in cell response to nucleolar stress induced by Act D in tumor cells lacking functional p53. Cell Cycle 15(1), 41–51 (2016). 10.1080/15384101.2015.1120926 [DOI] [PMC free article] [PubMed] [Google Scholar]
- 50. Digiacomo, V. , Gando, I.A. , Venticinque, L. , Hurtado, A. , Meruelo, D. : The transition of the 37‐kDa laminin receptor (RPSA) to higher molecular weight species: SUMOylation or artifact? Cell. Mol. Biol. Lett. 20(4), 571–585 (2015). 10.1515/cmble-2015-0031 [DOI] [PMC free article] [PubMed] [Google Scholar]
- 51. Vania, L. , Morris, G. , Otgaar, T.C. , Bignoux, M.J. , Bernert, M. , Burns, J. , Gabathuse, A. , Singh, E. , Ferreira, E. , Weiss, S.F.T. : Patented therapeutic approaches targeting LRP/LR for cancer treatment. Expert Opin. Ther. Pat. 29(12), 987–1009 (2019). 10.1080/13543776.2019.1693543 [DOI] [PubMed] [Google Scholar]
- 52. Galkin, O. , Bentley, A.A. , Gupta, S. , Compton, B.A. , Mazumder, B. , Kinzy, T.G. , Merrick, W.C. , Hatzoglou, M. , Pestova, T.V. , Hellen, C.U. , Komar, A.A. : Roles of the negatively charged N‐terminal extension of Saccharomyces cerevisiae ribosomal protein S5 revealed by characterization of a yeast strain containing human ribosomal protein S5. RNA 13(12), 2116–2128 (2007). 10.1261/rna.688207 [DOI] [PMC free article] [PubMed] [Google Scholar]
- 53. Matragkou, C.N. , Papachristou, E.T. , Tezias, S.S. , Tsiftsoglou, A.S. , Choli‐Papadopoulou, T. , Vizirianakis, I.S. : The potential role of ribosomal protein S5 on cell cycle arrest and initiation of murine erythroleukemia cell differentiation. J. Cell. Biochem. 104(4), 1477–1490 (2008). 10.1002/jcb.21722 [DOI] [PubMed] [Google Scholar]
- 54. Del Campo, E.M. , Casano, L.M. , Barreno, E. : Evolutionary implications of intron–exon distribution and the properties and sequences of the RPL10A gene in eukaryotes. Mol. Phylogenet. Evol. 66(3), 857–867 (2013). 10.1016/j.ympev.2012.11.013 [DOI] [PubMed] [Google Scholar]
- 55. Fang, E. , Zhang, X. : Identification of breast cancer hub genes and analysis of prognostic values using integrated bioinformatics analysis. Cancer Biomarkers 21(2), 373–381 (2018). 10.3233/cbm-170550 [DOI] [PubMed] [Google Scholar]
- 56. Bai, D. , Zhang, J. , Xiao, W. , Zheng, X. : Regulation of the HDM2‐p53 pathway by ribosomal protein L6 in response to ribosomal stress. Nucleic Acids Res. 42(3), 1799–1811 (2014). 10.1093/nar/gkt971 [DOI] [PMC free article] [PubMed] [Google Scholar]
- 57. Kim, Y. , Lee, M.S. , Kim, H.D. , Kim, J. : Ribosomal protein S3 (rpS3) secreted from various cancer cells is N‐linked glycosylated. Oncotarget 7(49), 80350–80362 (2016). 10.18632/oncotarget.10180 [DOI] [PMC free article] [PubMed] [Google Scholar]
- 58. Sasaki, M. , Kawahara, K. , Nishio, M. , Mimori, K. , Kogo, R. , Hamada, K. , Itoh, B. , Wang, J. , Komatsu, Y. , Yang, Y.R. , Hikasa, H. , Horie, Y. , Yamashita, T. , Kamijo, T. , Zhang, Y. , Zhu, Y. , Prives, C. , Nakano, T. , Mak, T.W. , Sasaki, T. , Maehama, T. , Suzuki, A. : Regulation of the MDM2‐P53 pathway and tumor growth by PICT1 via nucleolar RPL11. Nat. Med. 17(8), 944–951 (2011). 10.1038/nm.2392 [DOI] [PMC free article] [PubMed] [Google Scholar]
- 59. Huang, X.P. , Zhao, C.X. , Li, Q.J. , Cai, Y. , Liu, F.X. , Hu, H. , Xu, X. , Han, Y.L. , Wu, M. , Zhan, Q.M. , Wang, M.R. : Alteration of RPL14 in squamous cell carcinomas and preneoplastic lesions of the esophagus. Gene 366(1), 161–168 (2006). 10.1016/j.gene.2005.09.025 [DOI] [PubMed] [Google Scholar]
- 60. Piazzi, M. , Bavelloni, A. , Gallo, A. , Faenza, I. , Blalock, W.L. : Signal transduction in ribosome biogenesis: a recipe to avoid disaster. Int. J. Mol. Sci. 20(11), 2718 (2019). 10.3390/ijms20112718 [DOI] [PMC free article] [PubMed] [Google Scholar]
- 61. Hu, Z.B. , Minden, M. , McCulloch, E. : Regulation of drug sensitivity by ribosomal protein S3a. Blood. The Journal of the American Society of Hematology 95(3), 1047–1055 (2000). 10.1182/blood.v95.3.1047.003k43_1047_1055 [DOI] [PubMed] [Google Scholar]
- 62. Lim, K.H. , Kim, K.H. , Choi, S.I. , Park, E.S. , Park, S.H. , Ryu, K. , Park, Y.K. , Kwon, S.Y. , Yang, S.I. , Lee, H.C. , Sung, I.K. , Seong, B.L. : RPS3a over‐expressed in HBV‐associated hepatocellular carcinoma enhances the HBx‐induced NF‐κB signaling via its novel chaperoning function. PLoS One 6(8), e22258 (2011). 10.1371/journal.pone.0022258 [DOI] [PMC free article] [PubMed] [Google Scholar]
- 63. Rao, S. , Cai, K.Q. , Stadanlick, J.E. , Greenberg‐Kushnir, N. , Solanki‐Patel, N. , Lee, S.Y. , Fahl, S.P. , Testa, J.R. , Wiest, D.L. : Ribosomal protein Rpl22 controls the dissemination of T‐cell lymphoma. Cancer Res. 76(11), 3387–3396 (2016). 10.1158/0008-5472.can-15-2698 [DOI] [PMC free article] [PubMed] [Google Scholar]
- 64. Barel, O. , Shorer, Z. , Flusser, H. , Ofir, R. , Narkis, G. , Finer, G. , Shalev, H. , Nasasra, A. , Saada, A. , Birk, O.S. : Mitochondrial complex III deficiency associated with a homozygous mutation in UQCRQ. Am. J. Hum. Genet. 82(5), 1211–1216 (2008). 10.1016/j.ajhg.2008.03.020 [DOI] [PMC free article] [PubMed] [Google Scholar]
- 65. Voet, D. , Voet, J.G. , Pratt, C.W. : Fundamentals of Biochemistry: Life at the Molecular Level. John Wiley & Sons; (2016) [Google Scholar]
- 66. Klingenberg, M. : The ADP and ATP transport in mitochondria and its carrier. Biochim. Biophys. Acta Biomembr. 1778(10), 1978–2021 (2008). 10.1016/j.bbamem.2008.04.011 [DOI] [PubMed] [Google Scholar]
- 67. Lytovchenko, O. , Kunji, E.R. : Expression and putative role of mitochondrial transport proteins in cancer. Biochim. Biophys. Acta Bioenerg. 1858(8), 641–654 (2017). 10.1016/j.bbabio.2017.03.006 [DOI] [PubMed] [Google Scholar]
- 68. Miyake, N. , Yano, S. , Sakai, C. , Hatakeyama, H. , Matsushima, Y. , Shiina, M. , Watanabe, Y. , Bartley, J. , Abdenur, J.E. , Wang, R.Y. , Chang, R. , Tsurusaki, Y. , Doi, H. , Nakashima, M. , Saitsu, H. , Ogata, K. , Goto, Y.i. , Matsumoto, N. : Mitochondrial complex III deficiency caused by a homozygous UQCRC2 mutation presenting with neonatal‐onset recurrent metabolic decompensation. Hum. Mutat. 34(3), 446–452 (2013). 10.1002/humu.22257 [DOI] [PubMed] [Google Scholar]
- 69. Shang, Y. , Zhang, F. , Li, D. , Li, C. , Li, H. , Jiang, Y. , Zhang, D. : Overexpression of UQCRC2 is correlated with tumor progression and poor prognosis in colorectal cancer. Pathol. Res. Pract. 214(10), 1613–1620 (2018). 10.1016/j.prp.2018.08.012 [DOI] [PubMed] [Google Scholar]
- 70. Natera‐Naranjo, O. , Kar, A.N. , Aschrafi, A. , Gervasi, N.M. , Macgibeny, M.A. , Gioio, A.E. , Kaplan, B.B. : Local translation of ATP synthase subunit 9 mRNA alters ATP levels and the production of ROS in the axon. Mol. Cell. Neurosci. 49(3), 263–270 (2012). 10.1016/j.mcn.2011.12.006 [DOI] [PubMed] [Google Scholar]
- 71. Filipp, D. , Zhang, J. , Leung, B.L. , Shaw, A. , Levin, S.D. , Veillette, A. , Julius, M. : Regulation of Fyn through translocation of activated Lck into lipid rafts. J. Exp. Med. 197(9), 1221–1227 (2003). 10.1084/jem.20022112 [DOI] [PMC free article] [PubMed] [Google Scholar]
- 72. Bommhardt, U. , Schraven, B. , Simeoni, L. : Beyond TCR signaling: emerging functions of Lck in cancer and immunotherapy. Int. J. Mol. Sci. 20(14), 3500 (2019). 10.3390/ijms20143500 [DOI] [PMC free article] [PubMed] [Google Scholar]
- 73. Ulyanova, T. , Blasioli, J. , Thomas, M.L. : Regulation of cell signaling by the protein tyrosine phosphatases, CD45 and SHP‐1. Immunol. Res. 16(1), 101–113 (1997). 10.1007/bf02786326 [DOI] [PubMed] [Google Scholar]
- 74. Du, Y. , Grandis, J.R. : Receptor‐type protein tyrosine phosphatases in cancer. Chin. J. Cancer 34(2), 61–69 (2015). 10.5732/cjc.014.10146 [DOI] [PMC free article] [PubMed] [Google Scholar]
- 75. Imataka, H. , Sonenberg, N. : Human eukaryotic translation initiation factor 4G (eIF4G) possesses two separate and independent binding sites for eIF4A. Mol. Cell Biol. 17(12), 6940–6947 (1997). 10.1128/mcb.17.12.6940 [DOI] [PMC free article] [PubMed] [Google Scholar]
- 76. Gao, C. , Guo, X. , Xue, A. , Ruan, Y. , Wang, H. , Gao, X. : High intratumoral expression of eIF4A1 promotes epithelial‐to‐mesenchymal transition and predicts unfavorable prognosis in gastric cancer. Acta Biochim. Biophys. Sin. 52(3), 310–319 (2020). 10.1093/abbs/gmz168 [DOI] [PubMed] [Google Scholar]
- 77. Rutkovsky, A.C. , Yeh, E.S. , Guest, S.T. , Findlay, V.J. , Muise‐Helmericks, R.C. , Armeson, K. , Ethier, S.P. : Eukaryotic initiation factor 4E‐binding protein as an oncogene in breast cancer. BMC Cancer 19(1), 1–15 (2019). 10.1186/s12885-019-5667-4 [DOI] [PMC free article] [PubMed] [Google Scholar]
- 78. Rojo, F. , Najera, L. , Lirola, J. , Jiménez, J. , Guzmán, M. , Sabadell, M.D. , Baselga, J. , Cajal, S.R.y. : 4E‐binding protein 1, a cell signaling hallmark in breast cancer that correlates with pathologic grade and prognosis. Clin. Cancer Res. 13(1), 81–89 (2007). 10.1158/1078-0432.ccr-06-1560 [DOI] [PubMed] [Google Scholar]
- 79. Armengol, G. , Rojo, F. , Castellví, J. , Iglesias, C. , Cuatrecasas, M. , Pons, B. , Baselga, J. , Ramón y Cajal, S. : 4E‐binding protein 1: a key molecular “funnel factor” in human cancer with clinical implications. Cancer Res. 67(16), 7551–7555 (2007). 10.1158/0008-5472.can-07-0881 [DOI] [PubMed] [Google Scholar]
- 80. Levine, A.J. : p53, the cellular gatekeeper for growth and division. Cell 88(3), 323–331 (1997). 10.1016/s0092-8674(00)81871-1 [DOI] [PubMed] [Google Scholar]
- 81. Piccolo, S. , Dupont, S. , Cordenonsi, M. : The Biology of YAP/TAZ: Hippo Signaling and beyond. Physiological reviews; (2014) [DOI] [PubMed] [Google Scholar]
- 82. Morey, L. , Helin, K. : Polycomb group protein‐mediated repression of transcription. Trends Biochem. Sci. 35(6), 323–332 (2010). 10.1016/j.tibs.2010.02.009 [DOI] [PubMed] [Google Scholar]
- 83. Comet, I. , Riising, E.M. , Leblanc, B. , Helin, K. : Maintaining cell identity: PRC2‐mediated regulation of transcription and cancer. Nat. Rev. Cancer 16(12), 803–810 (2016). 10.1038/nrc.2016.83 [DOI] [PubMed] [Google Scholar]
- 84. Yu, D. , Hung, M.C. : Overexpression of ErbB2 in cancer and ErbB2‐targeting strategies. Oncogene 19(53), 6115–6121 (2000). 10.1038/sj.onc.1203972 [DOI] [PubMed] [Google Scholar]
- 85. Wang, P. , Cheng, H. , Wu, J. , Yan, A. , Zhang, L. : STK33 plays an important positive role in the development of human large cell lung cancers with variable metastatic potential. Acta Biochim. Biophys. Sin. 47(3), 214–223 (2015). 10.1093/abbs/gmu136 [DOI] [PubMed] [Google Scholar]
- 86. Dhillon, A.S. , Hagan, S. , Rath, O. , Kolch, W. : MAP kinase signalling pathways in cancer. Oncogene 26(22), 3279–3290 (2007). 10.1038/sj.onc.1210421 [DOI] [PubMed] [Google Scholar]
- 87. Firestein, G.S. : A biomarker by any other name…. Nat. Clin. Pract. Rheumatol. 2(12), 635 (2006). 10.1038/ncprheum0347 [DOI] [PubMed] [Google Scholar]
- 88. Provost, E. , Weier, C.A. , Leach, S.D. : Multiple ribosomal proteins are expressed at high levels in developing zebrafish endoderm and are required for normal exocrine pancreas development. Zebrafish 10(2), 161–169 (2013). 10.1089/zeb.2013.0884 [DOI] [PMC free article] [PubMed] [Google Scholar]
- 89. Shapiro, R.S. : Malignancies in the setting of primary immunodeficiency: implications for hematologists/oncologists. Am. J. Hematol. 86(1), 48–55 (2011). 10.1002/ajh.21903 [DOI] [PubMed] [Google Scholar]
- 90. Critchley‐Thorne, R.J. , Simons, D.L. , Yan, N. , Miyahira, A.K. , Dirbas, F.M. , Johnson, D.L. , Swetter, S.M. , Carlson, R.W. , Fisher, G.A. , Koong, A. , Holmes, S. , Lee, P.P. : Impaired interferon signaling is a common immune defect in human cancer. Proc. Natl. Acad. Sci. USA 106(22), 9010–9015 (2009). 10.1073/pnas.0901329106 [DOI] [PMC free article] [PubMed] [Google Scholar]
- 91. Mukhopadhyay, M. , Shtrom, S. , Rodriguez‐Esteban, C. , Chen, L. , Tsukui, T. , Gomer, L. , Dorward, D.W. , Glinka, A. , Grinberg, A. , Huang, S.P. , Niehrs, C. , Belmonte, J.C.I. , Westphal, H. : Dickkopf1 is required for embryonic head induction and limb morphogenesis in the mouse. Dev. Cell 1(3), 423–434 (2001). 10.1016/s1534-5807(01)00041-7 [DOI] [PubMed] [Google Scholar]
- 92. Sato, N. , Yamabuki, T. , Takano, A. , Koinuma, J. , Aragaki, M. , Masuda, K. , Ishikawa, N. , Kohno, N. , Miyamoto, M. , Nakayama, H. , Miyagi, Y. , Tsuchiya, E. , Kondo, S. , Nakamura, Y. , Daigo, Y. : Wnt inhibitor Dickkopf‐1 as a target for passive cancer immunotherapy. Cancer Res. 70(13), 5326–5336 (2010). 10.1158/0008-5472.can-09-3879 [DOI] [PubMed] [Google Scholar]
- 93. Brandt‐Bohne, U. , Keene, D.R. , White, F.A. , Koch, M. : MEGF9: a novel transmembrane protein with a strong and developmentally regulated expression in the nervous system. Biochem. J. 401(2), 447–457 (2007). 10.1042/bj20060691 [DOI] [PMC free article] [PubMed] [Google Scholar]
- 94. Ozaki, T. , Nakagawara, A. : Role of p53 in cell death and human cancers. Cancers 3(1), 994–1013 (2011). 10.3390/cancers3010994 [DOI] [PMC free article] [PubMed] [Google Scholar]
- 95. Whiteman, H.J. , Weeks, M.E. , Dowen, S.E. , Barry, S. , Timms, J.F. , Lemoine, N.R. , Crnogorac‐Jurcevic, T. : The role of S100P in the invasion of pancreatic cancer cells is mediated through cytoskeletal changes and regulation of cathepsin D. Cancer Res. 67(18), 8633–8642 (2007). 10.1158/0008-5472.can-07-0545 [DOI] [PubMed] [Google Scholar]
- 96. Pandey, R. , Zhou, M. , Islam, S. , Chen, B. , Barker, N.K. , Langlais, P. , Srivastava, A. , Luo, M. , Cooke, L.S. , Weterings, E. , Mahadevan, D. : Carcinoembryonic antigen cell adhesion molecule 6 (CEACAM6) in Pancreatic Ductal Adenocarcinoma (PDA): an integrative analysis of a novel therapeutic target. Sci. Rep. 9(1), 1–14 (2019). 10.1038/s41598-019-54545-9 [DOI] [PMC free article] [PubMed] [Google Scholar]
- 97. Zhang, D. , Simmen, R.C. , Michel, F.J. , Zhao, G. , Vale‐Cruz, D. , Simmen, F.A. : Secretory leukocyte protease inhibitor mediates proliferation of human endometrial epithelial cells by positive and negative regulation of growth‐associated genes. J. Biol. Chem. 277(33), 29999–30009 (2002). 10.1074/jbc.m203503200 [DOI] [PubMed] [Google Scholar]
- 98. Qu, J. , Zheng, B. , Ohuchida, K. , Feng, H. , Chong, S.J.F. , Zhang, X. , Liang, R. , Liu, Z. , Shirahane, K. , Mizumoto, K. , Gong, P. , Nakamura, M. : PIK3CB is involved in metastasis through the regulation of cell adhesion to collagen I in pancreatic cancer. J. Adv. Res. 33, 127–140 (2021). 10.1016/j.jare.2021.02.002 [DOI] [PMC free article] [PubMed] [Google Scholar]
- 99. Chen, K. , He, Y. , Liu, Y. , Yang, X. : Gene signature associated with neuro‐endocrine activity predicting prognosis of pancreatic carcinoma. Molecular genetics & genomic medicine 7(7), e00729 (2019). 10.1002/mgg3.729 [DOI] [PMC free article] [PubMed] [Google Scholar]
- 100. Zanconato, F. , Cordenonsi, M. , Piccolo, S. : YAP/TAZ at the roots of cancer. Cancer Cell 29(6), 783–803 (2016). 10.1016/j.ccell.2016.05.005 [DOI] [PMC free article] [PubMed] [Google Scholar]
- 101. Zhang, Z. , Chen, Y. , Tang, J. , Xie, X. : Frequent loss expression of dab2 and promotor hypermethylation in human cancers: a meta‐analysis and systematic review. Pakistan J. Med. Sci. 30(2), 432 (2014). 10.12669/pjms.302.4486 [DOI] [PMC free article] [PubMed] [Google Scholar]
- 102. Bilska, A. , Kusio‐Kobiałka, M. , Krawczyk, P.S. , Gewartowska, O. , Tarkowski, B. , Kobyłecki, K. , Nowis, D. , Golab, J. , Gruchota, J. , Borsuk, E. , Dziembowski, A. , Mroczek, S. : Immunoglobulin expression and the humoral immune response is regulated by the non‐canonical poly (A) polymerase TENT5C. Nat. Commun. 11(1), 1–17 (2020). 10.1038/s41467-020-15835-3 [DOI] [PMC free article] [PubMed] [Google Scholar]
- 103. Rouillard, A.D. , Gundersen, G.W. , Fernandez, Nicolas, F. , Wang, Z. , Monteiro, et al.: The Harmonizome: A Collection of Processed Datasets Gathered to Serve and Mine Knowledge about Genes and Proteins. Database. Oxford Academic; (2016) [DOI] [PMC free article] [PubMed] [Google Scholar]
Associated Data
This section collects any data citations, data availability statements, or supplementary materials included in this article.
Supplementary Materials
Supporting Information S1
Supporting Information S2
Supporting Information S3
Supporting Information S4
Supporting Information S5
Supporting Information S6
Supporting Information S7
Data Availability Statement
The data that support the findings of this study are available in Array Express at https://www.ebi.ac.uk/arrayexpress/, reference number GSE68086. These data were derived from the following resources available in the public domain: https://www.ebi.ac.uk/arrayexpress/experiments/E‐GEOD‐68086/?query=GSE68086.