

Abstract
Hypoxia, through hypoxia inducible factor (HIF), drives cancer cell invasion and metastatic progression in various cancer types. In epithelial cancer, hypoxia induces the transition to amoeboid cancer cell dissemination, yet the molecular mechanisms, relevance for metastasis, and effective intervention to combat hypoxia-induced amoeboid reprogramming remain unclear. Here, we identify calpain-2 as key regulator and anti-metastasis target of hypoxia-induced transition from collective to amoeboid dissemination of breast and head and neck (HN) carcinoma cells. Hypoxia-induced amoeboid dissemination occurred through low ECM-adhesive, predominantly bleb-based amoeboid movement, which was maintained by a low-oxidative and -glycolytic energy metabolism (“eco-mode”). Hypoxia induced calpain-2 mediated amoeboid conversion by de-activating beta1 integrins, through enzymatic cleavage of the focal adhesion adaptor protein talin-1. Consequently, targeted downregulation or pharmacological inhibition of calpain-2 restored talin-1 integrity, beta1 integrin engagement and reverted amoeboid to elongated phenotypes under hypoxia. Calpain-2 activity was required for hypoxia-induced amoeboid conversion in the orthotopic mouse dermis, and upregulated in invasive HN tumor xenografts in vivo, and attenuation of calpain activity prevented hypoxia-induced metastasis to the lungs. This identifies the calpain-2/talin-1/beta1 integrin axis as druggable mechanosignaling program that conserves energy yet enables metastatic dissemination which can be reverted by interfering with calpain activity.
eTOC blurb
Te Boekhorst et al. identify the transition to blebbing-amoeboid migration as an energy-conserving migration mode induced by hypoxia signaling, through calpain-2-mediated cleavage of talin-1, β1 integrin deactivation and decreased oxidative metabolism. This indicates that blebbing-amoeboid movement represents an “eco-mode” of cell migration.
Graphical Abstract
Introduction
Cancer cell invasion initiates a multistep cascade to metastasis, which converts local neoplasia into a life-threatening systemic disease.1–3 For tissue invasion, cancer cells deploy a range of collective and individual cell migration strategies. Collective invasion of multicellular groups occurs when cells are held together by cell-cell adhesion, whereas single-cell migration lacks cell-cell cohesion and connectivity.4 Mesenchymal single-cell migration depends on effective integrin-mediated adhesion to the extracellular matrix (ECM), which supports spindle-like cell elongation and force generation.5 Amoeboid movement of roundish or ellipsoid cells engages only weak adhesion to the ECM and relies upon kinetic deformation of the cell body for passage through 3D tissue.6 In addition, protrusion types differ between amoeboid migration modes. Amoeboid-moving leukocytes and cancer cells develop actin-rich pseudopodia and filopodia at the leading edge, which generate protrusive cell elongation and directional motion.7,8 Primordial germ cells and a subset of roundish-moving cancer cells extend bleb-like membrane protrusions which provide transient anchorage by their irregular surface topology.7–11 While each migration mode operates according to distinct physicochemical principles, the relevance of each mode in the tumor microenvironment and during metastasis of cancer cells remains largely unclear.
Collective and single-cell migration programs are adaptive, allowing cells to switch between migration modes. Known conversions occur between collective and single-cell migration, including epithelial-to-mesenchymal or epithelial-to-amoeboid transition, as well as transitions between mesenchymal and amoeboid single-cell migration programs.3 Experimentally, migration mode switching can be induced by modulating mechanotransduction, e.g. inhibition of integrins or matrix metalloproteinases (MMPs), increasing or decreasing actomyosin contractility,12–15, or in response to physical and molecular triggers.16 The mechanisms mediating the epithelial-to-mesenchymal transition (EMT) have been investigated in detail. However, the stimuli and intracellular regulators supporting the conversion to amoeboid migration remain unclear.
Hypoxia, a microenvironmental stressor in solid tumors, induces invasion and metastasis in cancer cells17–20 and induces amoeboid migration in epithelial cancer cells by largely EMT-independent mechanisms.21 Hypoxic and metabolically perturbed tumor regions surround necrotic zones in the tumor core but are also present in the tumor margins near the invasive front.22 After HIF-stabilization, invasive tumor cells retain sustained hypoxia-related transcriptional programs and metastatic ability22–26, however the molecular mechanisms mediating transition to amoeboid migration and their relevance for hypoxia-induced metastasis remain unexplored.
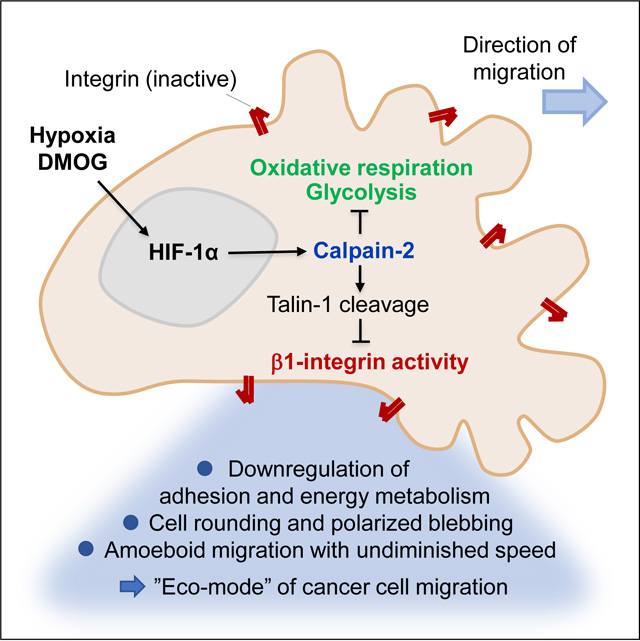
We used invasive and metastatic epithelial breast cancer and head and neck squamous carcinoma cells (HN-SCC), which invade collectively into 3D fibrillar collagen in tumoroid culture upon normoxia and undergo amoeboid conversion in response to hypoxia or pharmacological stabilization of HIF-1. We examined the induced amoeboid variants, pathways regulating mode switching, and their implications for metastatic organ colonization. Hypoxia/HIF stabilization induces conversion to blebbing-amoeboid movement by upregulating activity of the cysteine protease calpain-2, which cleaves the focal adhesion adapter talin-1, limits β1 integrin activity, reduces overall energy consumption, and strongly enhances metastasis.
Results
Hypoxia induces blebbing amoeboid migration
To identify the amoeboid programs induced by hypoxia, 4T1 and UT-SCC38 cells that invade fibrillar collagen in 3D tumoroid culture by a predominantly collective pattern under normoxia (21% O2), were exposed to severe hypoxia (0.2% O2) or pharmacological HIF1-stabilization using DMOG (1 mM)27 (Figure 1A). The upregulation of HIF was verified for both cell models by Western blot analysis (Figure S1A). Hypoxia and HIF stabilization induced the detachment of both initially elongated and rounded cells (Video S1). Rounded cells migrated with (i) actin-rich pseudopodal or (ii) blebbing protrusions (Figure 1B, arrowheads), whereas less frequent elongated cells were spindle-shaped or retained blebs, pseudopodal and/or filopod-like protrusions in coexistence (Figure 1B). In response to hypoxia or HIF stabilization, the absolute increase of detaching and blebbing-amoeboid moving cells per tumoroid was 3- to 6-fold, compared to control conditions (Figure 1C, Video S1). To determine the adaptive response to hypoxic stress in a standardized manner, we quantified the relative abundance of migration modes for each challenge condition. In control culture, the abundance of detached single cells was 40–60% for elongated spindle-shaped cells, and 20–30% for amoeboid-like, roundish cells with pseudopodal and bleb-based protrusions (Figure 1D). Upon hypoxia or HIF stabilization, elongated (10–30%) and amoeboid pseudopodal (10–20%) subsets diminished, but the amoeboid-blebbing mode increased to 50–80% (Figure 1D, Figure S1B, C; EF≤2). Cell rounding and emergence of blebs coincided (Figure S1D), indicating that hypoxia signaling activates a bleb-based migration program.
Figure 1. Hypoxia/HIF-induced amoeboid blebbing migration and cell viability.

A, Brightfield micrographs of tumoroids invading into collagen at 72 h (4T1) and 96 h (UT-SCC38) under the conditions indicated. Insets, individually migrating cells. Scale bars, 100 μm (overviews), 10 μm (insets). B, Representative confocal micrographs of UT-SCC38 cells 96 h after HIF-stabilization (left panels; scale bar, 10 μm). Protrusion type and number upon HIF stabilization (right panel; 44 cells, n=3). C, Morphology-based subtypes after 72 h (4T1) or 96 h (UT-SCC38). For classification criteria see STAR methods. Means ± s.d. of absolute cell number per subtype and tumoroid (5 tumoroids/experiment, n=3). **** P<0.0001 (two-way ANOVA). D, Frequency of single-cell migration subtypes per tumoroid. Means ± s.d. (5 tumoroids/experiment, n=3). **** P<0.0001, ** P<0.002, * P=0.015 (two-way ANOVA). E, Time-dependent phenotype of migrating 4T1 cells (time-lapse microscopy, 48 h observation period). Migration modes were classified for 3-h time windows. Data show 23 (E), 16 (P) and 13 (B) cells from 10 tumoroid quadrants. ** P=0.002 (Log-rank test). F, Time-dependent elongation of individual 4T1 cells. Elongation factor (EF) was detected at 1-h intervals for the duration that cells were detectable after detachment (8–24h). One cell per row. G, Time-dependent direct or step-wise (asterisks) transitions between migration modes (left panel) and aggregated phenotypes scored 48– 72 h after HIF-stabilization (right panel; 38 cells). Abbreviations: E, elongated; P pseudopodal-rounded; B, blebbing-rounded; N, normoxia; H, hypoxia; V, vehicle control (DMSO); D, DMOG.
Detached blebbing cells were actively moving (Video S1), proliferative (Figure S1E), and lacked signs of apoptosis, including cleaved caspase-3, nuclear fragmentation (Figure S1F), or cell collapse, and fragmentation (Video S1). In low- or mid-density collagen (1.7 or 2.5 mg/mL), the different migration modes induced by HIF stabilization developed comparable median speeds (0.1 – 0.3 μm/min) and migration persistence (Figure S1G, H, J), which was further comparable to rare detached and individually moving cells in control culture (Figure S1G, I, cell J). In higher-density collagen (4 mg/mL), all subtypes slowed down, with blebbing amoeboid cells migrating with lowest velocity (Figure S1I). Thus, hypoxia-induced transition to blebbing-amoeboid migration occurs at undiminished speed in low- to mid- density ECM. This bleb-based amoeboid phenotype is reminiscent of previously identified constitutive amoeboid cells in other experimental models of metastatic cancer dissemination.10,28
Transitions and morpho-kinetic stability of blebbing amoeboid migration
Invasion plasticity induced by EMT29,30 or adhesion-targeting antibody15 elicits collective to single-cell transition in a durable manner (days). We thus tested the stability of HIF-induced single-cell migration modes. Blebbing amoeboid migration in 4T1 cells was stable for up to 72 hours after HIF stabilization, whereas 20–50% of initially elongated or pseudopodal-amoeboid cells abandoned their mode over time (Figure 1E). In time-gated elongation analysis, blebbing-amoeboid cells retained a rounded shape (EF <2) over several days and did not reconvert to elongated phenotype, while pseudopodal (EF 1 to 4) or elongated, spindle-like (EF 3 to >10) subsets converted to rounded morphology (Figure 1F). As outcome after 3 days of HIF stabilization, collective, elongated and pseudopodal migration modes transitioned to blebbing amoeboid migration in 4T1 (Figure 1G, Video S2) and UT-SCC38 cells (Figure 1D, Figure S1K). These data indicate that under metabolic stress collectively invading epithelial cancer cells can transit to blebbing-amoeboid migration, either directly, or via a phase of metastable elongated and/or pseudopodal states.
Hypoxia and HIF stabilization reduce β1 integrin activity
Hypoxia-induced amoeboid conversion may result from decreased adhesion to the ECM substrate and/or increased actomyosin contractility through Rho/ROCK signaling.15,13,31,32 To determine whether modulating adhesion, with or without modulating contractility, is sufficient to mediate rounded cell migration, we carried out mechanochemical simulations using a 2D phase-field model of cells moving across a 2D substrate (Figure S2A). This model allows to modulate adhesion-dependent friction and contractility and determine the consequences for cell shape and speed33 (Figure S2B) and possible phenotypic instabilities.34 At intermediate contractility, cell elongation positively correlated with adhesion-dependent friction (Figure 2A). This predicts that decreasing cell-substrate adhesion may be sufficient to induce rounding. We further tested whether reducing friction and cell elongation could occur without compromising the speed of migration. At low friction, steeply decreasing cell length was associated with only moderately reduced speed (Figure 2A, gray area). Thus, in silico analysis predicts that diminished adhesion alone can result in cell rounding with near-undiminished speed, consistent with the concept of low-adhesive amoeboid migration.31
Figure 2. Reduced β1 integrin activity in blebbing-amoeboid cells.

A, In-silico modelling of cell shape (aspect ratio) and speed in dependence of friction of individual cells migrating at intermediate contractility using a two-dimensional phase field simulation. B, Total and active β1 integrin protein content in 24–48h (4T1) and 72–96h (UT-SCC38) 2D monolayer culture (left panel, representative Western blot) and densitometric ratio of total β1 integrin/β-actin and active/total β1 integrin (right panel). Data represent the mean ± s.d. and dots the individual results (n=3–4). D, densitometric analysis. **** P<0.001, *** P=0.004, ** P=0.002–0.004 (unpaired t-test, two-sided). C, Active and total β1 integrin surface expression (MFI) in adherent and detached 4T1 cells (48h). Cartoon, workflow of harvesting adherent and weakly adhesive cells from 2D culture. Representative flow cytometry histogram (left panel) and ratio of active/total β1 integrin surface expression normalized to the ratio of vehicle control (right panel). Columns show the median and data points from independent experiments (n=3). ** P=0.007, * P=0.03 (unpaired t-test, two-sided). D, Confocal micrographs of active (mAb 9EG7) and total β1 integrin (mAb EP1041Y) expression of 4T1 tumoroids invading into 3D collagen (left panel) and the ratio of active/total β1 integrin per invading 4T1 single cell (right panel). Data show ratios per cell (106 cells); horizontal lines, median. Insets, single cell phenotypes (arrowheads). Scale bars, 100 μm (overview), 10 µm (inset). **** P<0.0001 (Mann-Whitney test, two-sided). E, Brightfield micrographs of invading tumoroids after 72 h (left panel) and morphology-based single-cell subtypes (right panel) for indicated conditions in the presence or absence of β1 integrin-activating mAb 9EG7. Insets, single-cells. Data show the means ± s.d. (5 tumoroids/experiment, n=3). **** P<0.0001, *** P=0.0008, ** P<0.006, * P<0.03 (two-way ANOVA). Abbreviations: E, elongated; P pseudopodal-amoeboid; B, blebbing-amoeboid; N, normoxia; H, hypoxia; V, vehicle (DMSO); D, DMOG.
We thus examined in tumoroid culture whether hypoxia/HIF signaling causes amoeboid transition by downregulating adhesion. Cell adhesion to type I collagen is predominantly mediated by integrins α1β1, α2β1, α10β1 and α11β1.35 Hypoxia or HIF stabilization both reduced the β1 integrin activation epitope in cell lysates of 4T1 cells (detected by mAb 9EG7) and UT-SCC38 cells (mAb TS2/16) in comparison to control cells, whereas total β1 protein levels remained unchanged (Figure 2B). To test whether decreased β1 integrin activation scales with weakened cell adhesion, weakly and firmly adherent cells were separated by mild washing of hypoxic or normoxic 2D monolayer cultures (Figure 2C, Figure S2C). HIF-stabilization downregulated active β1 integrin (by 50%) in detached cells, while adhesive cells expressed high active β1 integrin levels (Figure 2C, Figure S2D). In hypoxic 3D tumoroid culture, β1 integrin activation epitope (9EG7) was decreased in individualized migrating cells, compared with normoxic culture (Figure 2D, arrowheads). Hypoxia and HIF stabilization thus dampen β1 integrin activation in cell subsets that weakly adhere in 2D culture and undergo single-cell migration in 3D culture.
Diminished β1 integrin activity is required for blebbing-amoeboid conversion
Amoeboid migration occurs with weak or even absent integrin-mediated adhesion.7,31,36 We thus tested whether amoeboid migration in response to HIF stabilization was still supported by β1 integrins. The migration speed of detached UT-SCC38 single cells in the presence of adhesion-perturbing anti-β1 integrin mAb 4B4 was dose-dependently reduced, with 80% decline (from 0.1 μm/min to 0.02 μm/min) for high dose of mAb 4B4 but only mild reduction at a low dose (Figure S2E). As an independent reference for the principal efficacy at this concentration in an integrin-dependent cell model,11 mAb 4B4 at low dose profoundly decelerated the migration speed of mesenchymal HT1080 fibrosarcoma cells (Figure S2E).
To test whether diminished β1 integrin function was required for the transition to amoeboid migration, β1 integrin was ectopically activated by mAb 9EG7 (4T1) or TS2/16 (UT-SCC38) added after HIF stabilization, when cells had detached from the tumoroid. Activation of β1 integrin decreased the frequency of round, bleb-rich phenotypes and enforced elongated morphologies with pseudopodal protrusions (Figure 2E; Figure S2F, Video S3). In contrast, integrin inhibition by mAb 4B4 induced blebbing-amoeboid migration in control culture (Figure S2G). These data indicate that hypoxia/HIF signaling induces bleb-based amoeboid migration in 4T1 and UT-SCC38 cells by partially de-activating β1 integrin function.
Elevated calpain-2 function mediates blebbing-amoeboid migration
Cell-intrinsic mechanisms that can limit integrin function include (i) inhibition of intracellular phosphatases, which interrupts focal adhesion cycles37, and (ii) activation of the calcium-activated serine protease calpain-2, which cleaves the focal adhesion components talin, paxillin, and FAK.38,39 Calpain-2 expression and activity are elevated throughout the metastatic cascade in epithelial cancers.40–47 We therefore explored the role of calpain as a putative regulator of integrin deactivation. Calpain-2 protein expression, determined by Western Blot analysis, remained unchanged in hypoxic and DMOG-treated 2D bulk culture (Figure S3A). However, using the fluorogenic calpain substrate t-BOC-L-Leucyl-L-Methionine amide (CMAC) and detection by flow cytometry at single-cell level, the intracellular calpain activity was increased (up to 1.5-fold) by hypoxia and DMOG, and this effect was reverted by calpain-inhibitor PD150606 (Figure 3A). This indicates that calpain activity is regulated by hypoxia signaling.
Figure 3. Calpain-2-dependent β1 integrin activation and blebbing-amoeboid conversion after HIF stabilization.

A, Calpain activity (cleaved CMAC intensity) detected by flow cytometry in 4T1 cells 48 h after HIF-stabilization with DMOG (left panel) or hypoxia (right panel), in the absence or presence of PD150606. Representative histograms with MFIs (top panels) and mean MFI ± s.d. normalized to controls (lower panels; n=3). Shadowed lines, unstained controls. * P=0.02 (unpaired t-test, two-sided). B, Calpain-2 expression in 4T1 subpopulations 48–72h after HIF stabilization. Data represent the mean MFI ± s.d. from n=3 (unpaired t-test, two-sided). C, Correlation of calpain-2 and active β1 integrin surface protein content in 4T1 subpopulations 48–72h after treatment (top panel, representative quadrant histograms). Cell fraction expressing calpain-2high and active β1 integrinlow levels normalized to vehicle control (lower panel). Columns show the means ± s.d. (n=3). * P=0.029 (unpaired t-test, two-sided). D, Topography (left panel) and in situ cytometry (right panel) of cleaved CMAC intensity in 4T1 cells detached from tumoroids (72 h after HIF-stabilization). Inset, amoeboid-blebbing cell; F-actin, phalloidin. CTCF, corrected total cell fluorescence from 118 cells pooled from n=2. **** P≤0.0001 (Mann-Whitney Test, two-sided). E, Elongation factor (EF) distribution (left panel) and correlation with calpain activity (right panel) of detached 4T1 cells. * P=0.028 (Mann-Whitney test, two-sided). F, Topography (left panel) and cytometry (right panel) of calpain activity of 4T1 tumoroids in collagen in the absence or presence of PD150606 (72 h after HIF-stabilization). Data (134 cells pooled from n=2) are represented as in (D). **** P≤0.0001 (Mann-Whitney Test, two-sided). G, EF distribution of 4T1 cells (left panel) and correlation with calpain function (right panel) in the presence of PD150606 (100 μM) (right panel). Data show 134 cells from n=2. ** P=0.0051, * P=0.028 (Mann-Whitney test, two-sided). H, Migration morphologies of siCtrl- or siCAPN2-transfected single-cells 72 h (4T1, mouse si-ID#2) and 96 h (UT-SCC38, human si-ID#3) after treatment. Data represent the means ± s.d. (5 tumoroids/experiment, n=3). ** P<0.002, * P<0.05, ns P>0.95 (two-way ANOVA). I, Representative micrographs (left panel) and distribution of single-cell migration subtypes (right panel) of 4T1 tumoroids in collagen with or without 50 μM PD150606 (72 h after HIF-stabilization). Insets, single-cell phenotypes. Data represent the means ± s.d. (5 tumoroids/experiment, n=3). *** P=0.0007, * P=0.05, ns P>0.31 (two-way ANOVA). J, Active and total β1 integrin surface expression in 4T1 cells after treatment with DMOG and PD150606 (100 μM). Data represent the mean MFI ± s.d. from n=3 (Mann-Whitney Test, two-sided). Abbreviations: E, elongated; P, pseudopodal-amoeboid; B, blebbing-amoeboid; N, normoxia; H, hypoxia; V, vehicle (DMSO); D, DMOG; PD, PD150606. Horizontal lines (D,E,F,G), median. Scale bars (D,F,H,J), 100 μm (overviews), 10 μm (insets).
To examine whether calpain-2 protein levels differed between differentially adhesive subpopulations, we measured calpain-2 protein expression levels in weakly and firmly adhesive cells after treatment with DMOG. Calpain-2 protein was upregulated in the weakly adhesive subset and downregulated in strongly adhesive cells, compared to control cells (Figure 3B). In weakly adherent cells, high calpain-2 protein levels coincided with reduced active β1 integrin surface content, and the frequency of calpain-2hi/β1activelo cells was increased after DMOG treatment (Figure 3C). Thus, hypoxia/HIF signaling induces calpain-2 expression and function in low-adhesive cells.
To detect whether calpain activity is increased in amoeboid-moving cells, we applied the calpain reporter CMAC to 3D tumoroid culture. Hypoxia and DMOG treatment caused calpain activation in collective invasion strands preceding cell detachment as well as individually migrating cells, whereas calpain activity was low in control culture (Figure 3D, Figure S3B, C). Using the median of cell elongation (EF <2) as a cut-off to discriminate between elongated and rounded cells (Fig 3e, left graph), DMOG induced highest calpain activity elevation in rounded individual cells, whereas elongated cells typically contained low calpain activity (Figure 3E). In a subset of elongated-moving cells, high calpain activity preceded cell rounding (Figure S3D, Video S4). Consistently, calpain inhibitor PD150606 diminished calpain activity to control level (Figure 3F) and reverted cell rounding to elongated cell shapes despite ongoing HIF stabilization with DMOG (Figure 3G). This data suggests that calpain activation in collective and mesenchymal-elongated invasion precedes transition to amoeboid migration.
To test whether the transition to blebbing amoeboid migration indeed depends on calpain-2 activity, we transiently downregulated calpain-2 by RNA interference (Figure S3E-G) and measured the effect on amoeboid conversion. Calpain-2 downregulation prevented blebbing-amoeboid but induced elongated phenotypes in DMOG-treated culture (Figure 3H). Consistently, PD150606 prevented HIF- induced amoeboid conversion in 3D tumoroid culture (Figure 3i) and restored active β1 integrin surface level in low-adhesive cells in 2D culture (Figure 3J). Calpain-2 activation therefore dampens integrin activity and mediates HIF-induced amoeboid conversion.
Calpain-2 activation mediates transition to blebbing-amoeboid migration by talin-1 cleavage
We next addressed whether, after HIF activation, calpain-2 deactivates β1 integrins by its canonical function, i.e., cleaving focal adhesion complex proteins. Talin-1 is the central mechanosensitive adaptor protein in integrin-mediated focal contacts and an important calpain-2 target to induce focal adhesion turnover.48,49 Hypoxia and HIF stabilization with DMOG both induced the cleavage of talin-1, detected as a proteolytic talin-1 fragment of 190kDa corresponding to the main calpain-2 mediated talin-1 cleavage product38,39. This resulted in an increased ratio between cleaved and full-length talin-1 (Figure 4A). The cleaved/uncleaved talin-1 ratio induced by hypoxia or DMOG in 4T1 and UT-SCC38 cells was reverted by calpain inhibition with PD150606 (by 40 – 80%; Figure 4B). DMOG-induced talin cleavage was further reverted (by 50%) by transient siRNA-mediated calpain-2–specific downregulation (Figure 4C). Thus, hypoxia/HIF signaling induces proteolytic cleavage of talin-1 in dependence of calpain-2.
Figure 4. Calpain-2-induced talin-1 cleavage-dependent phenotypic conversion to blebbing amoeboid migration.

A, Talin-1 protein expression, including full length (270 kDa) and cleavage fragment (190kDa), after 48–72 h (4T1) and 96 h (UT-SCC38) of hypoxic culture or HIF-stabilization with DMOG. Representative Western blots with densitometry values (“D”) (top panel) and band intensity by densitometric analysis of the change of the ratio talin-1 cleaved / full-length as the means ± s.d. normoxic or vehicle control culture from n=4–5 independent experiments. * P=0.01, ** P=0.001 (4T1), ** P=0.007 (UT-SCC38) (unpaired t-test, two-sided). B, Full-length and cleaved Talin-1 content in 4T1 cells in hypoxia (48h) or HIF-stabilization (24h) and UTSCC38 cells after HIF- stabilization (72h) alone or combined with calpain inhibition (PD150606, 100 μM). C) Talin-1 cleavage product in 4T1 cells after transient siRNA (100nM)-mediated downregulation of calpain-2. Data in (B,C) show representative Western blots from at least 3–4 independent experiments. Quantification was performed as in (a). * P=0.01–0.03, ** P=0.005 (b), ** P=0.001 (c), **** P<0.0001 (unpaired t-test, two-sided). D, Representative brightfield micrographs of 4T1 tumoroids expressing GFP or calpain-uncleavable GFP-talin (T432L) invading into 3D collagen. Insets show single-cell migration phenotypes after 72 h of culture. Scale bar, 100 μm (overviews), 10μm (insets). E, Morphology of individualized cells expressing calpain-uncleavable talin (L432G) during hypoxia- or DMOG-treatment. Morphometric subtypes: E, elongated; P pseudopodal-amoeboid; B, blebbing-amoeboid. Data represent the means ± s.d. (5 tumoroids/experiment, n=3). *** P < 0.0009, ** P < 0.003 and * P < 0.04 (two-way ANOVA). F, Subcellular localization of uncleavable talin. Representative confocal micrographs of detached 4T1 cells expressing GFP-TalinL432G during migration in 3D collagen 72 h after transfection and simultaneous HIF-stabilization. Arrowheads, focalized clusters. Scale bar, 100 μm (overview), 50 μm (inset).
To test whether the calpain-2/talin axis is required for transition to blebbing-amoeboid migration, we transiently expressed GFP-TalinL432G, which resists calpain-mediated cleavage but retains wildtype talin function and stabilizes focal adhesions, in 4T1 cells. The cleavage-resistance of GFP-TalinL432G was confirmed by Western blot analysis for control and HIF stabilization conditions (Figure S4A, B) and uniform expression in all cells was verified in 3D tumoroid invasion culture (Figure S4C). After ectopic expression, GFP-TalinL432G prevented cell rounding, abolished bleb formation, and induced spindle-shaped elongation despite HIF stabilization in both 4T1 and UT-SCC38 cells, whereas individually migrating GFP-transfected control cells remained rounded (Figure 4D, E). GFP-TalinL432G focalized at the tips of cell extensions and along the cell body of elongated cells (Figure 4F), consistent with its canonical localization in focalized cell-matrix interactions.48 In summary, calpain-2 cleaves talin-1 to enable cell rounding and blebbing-amoeboid migration.
Amoeboid conversion induced by HIF signaling is associated with an energy-conserving metabolic state
Cell migration is an energy consuming process.50–52 However, hypoxia/HIF signaling typically occurs alongside nutrient deprivation and metabolic challenge, which may limit energy production required for cell migration.53 Because hypoxia/HIF challenge induced conversion to amoeboid movement with efficient single-cell speeds in low- to mid-density 3D fibrillar collagen (Figure S1F, G), we examined whether HIF-induced amoeboid conversion is energy-conservative and maintains migration despite metabolic stress.
Glycolysis and mitochondrial respiration by oxidative phosphorylation secure cellular ATP production.54 To quantify metabolic adaptations in 3D culture, we generated collagen droplets containing one invading 4T1 tumoroid each and measured oxidative and glycolytic activity (Figure 5A, Figure S5A). HIF stabilization decreased oxygen consumption (OCR) in tumoroids (Figure 5B), reducing the basal and maximum mitochondrial respiration and mitochondrial ATP production by 50–70% (Figure 5C). HIF-stabilization further decreased glycolytic activity measured by extracellular acidification (ECAR) in 3D tumoroid culture (Figure 5D). Lactate release, the product of glycolysis, however remained unchanged under steady state conditions (Figure S5B). This suggests that HIF signaling induces metabolic pathways, besides glycolysis, to maintain lactate secretion (e.g. glutaminolysis)55 and can therefore decrease oxidative phosphorylation without compensatory increase of glycolysis (Figure 5E), not unlike energetic silencing56,57 and/or switching to alternative energy sources (e.g., amino acids, lipids).58
Figure 5. Metabolic adaptation associated with HIF-induced amoeboid reprogramming.
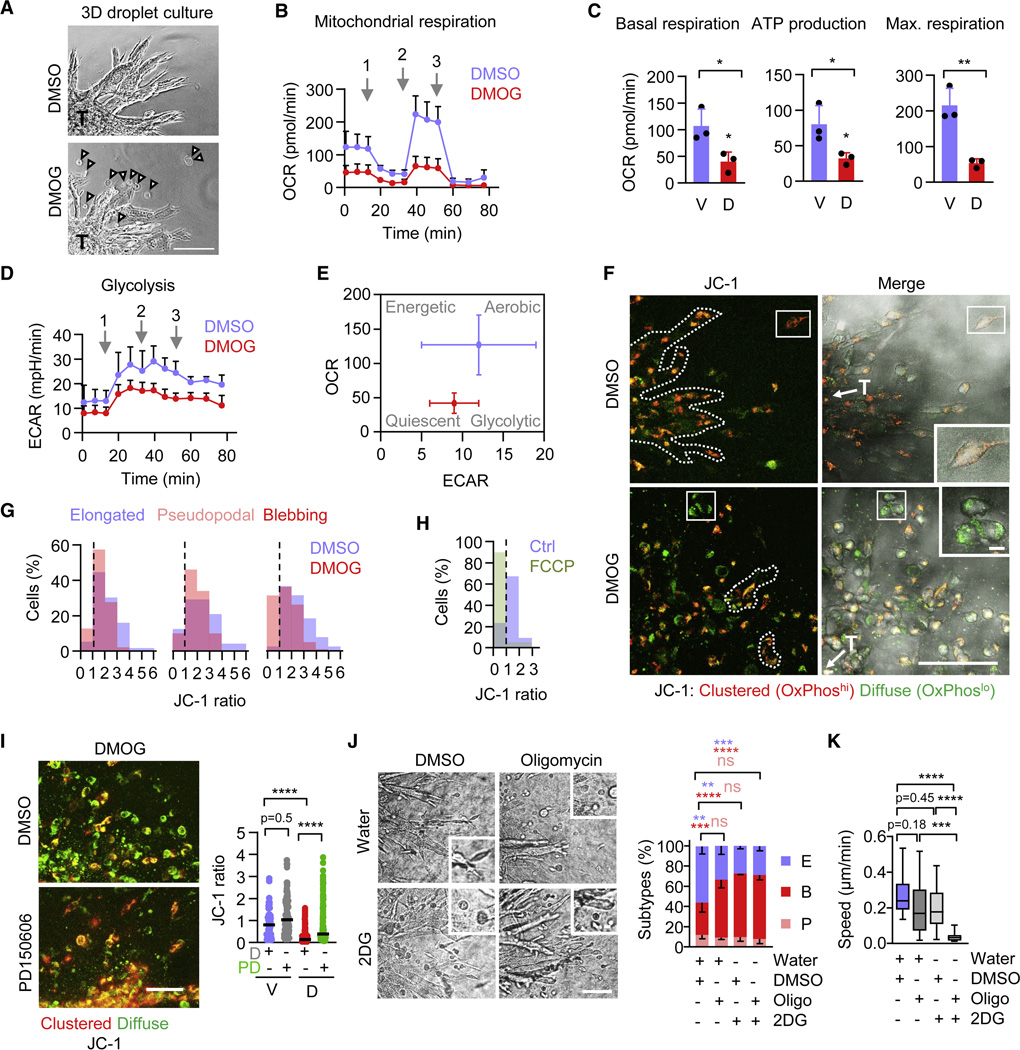
A, Representative micrographs of 4T1 tumoroids (T) invading within collagen droplets used for Seahorse XF Mito Stress test. Arrowheads, detached invading single cells. Scale bar, 100 μm. B, Time-dependent oxygen consumption rate (OCR) of 4T1 tumoroids in collagen 48 h after HIF-stabilization. Arrows, time of addition of (1) oligomycin (2 μM), (2) FCCP (1 μM) and (3) rotenone and antimycin A (2 μM each). Data represent the means ± s.d. (5–10 tumoroids/experiment, n=3). C, Mitochondrial basal respiration, ATP production and maximum respiratory capacity of 4T1 tumoroids 48 h after HIF-stabilization measured by OCR. Data are represented as in (B). V, vehicle (DMSO); D, DMOG. * P<0.03, ** P=0.005 (unpaired t-test, two-sided). D, Time-dependent extracellular acidification rate (ECAR) of 4T1 tumoroids 48 h after HIF-stabilization. Arrows and data are represented as in (B). E, Energy map of 4T1 tumoroids showing altered glycolytic (ECAR) and mitochondrial (OCR) activity after HIF-stabilization compared to control cultures. Date compiled from (B) and (E). F, Representative confocal micrographs depicting mitochondrial activity detected by JC-1 (10 μg/ml) of 4T1 invasion into collagen 72 h after HIF-stabilization. Red fluorescence denotes high and green fluorescence low mitochondrial activity. T, tumoroid. Scale bars, 100 μm (overview), 10 μm (insets). G, Resulting JC-1 ratio (red/green) distribution within elongated (E), amoeboid-pseudopodal (P) and amoeboid-blebbing (B) 4T1 single-cell migration subsets from 103 (E), 74 (P) 137 (B) cells pooled from n=3. H, JC-1 ratio distribution of detached invading 4T1 single cells treated with a mitochondrial oxidative phosphorylation uncoupler FCCP (200nM) (63 cells, n=1). I, Representative confocal micrographs of mitochondrial activity detected by JC-1 (10 μg/ml) of 4T1 invasion into collagen 72 h after HIF-stabilization and calpain inhibition using PD150606 (50 μM, 4h) or DMSO (D). Data represent individual cells; horizontal lines, median. Vehicle+DMSO (V+D), 124; V+PD, 128; D+DMSO, 245; D+PD, 208 cells pooled from 3 independent experiments. *** P<0.0001 (Kruskal-Wallis test). J, Representative brightfield micrographs of 4T1 tumoroids invading into 3D collagen under the indicated conditions (left panel). Oligomycin (2 μM) and 2DG (5 mM) treatment was performed for 15h starting at 48h after invasion onset. Insets show single-cell migration phenotypes after 60 h of culture. Scale bar, 100 μm (overviews), 10μm (insets). Frequency of single-cell migration subtypes per tumoroid (right panel). Data represent the means ± s.d. of morphologic classifiers (5 tumoroids per condition each experiment, n=3). **** P<0.0001, ns P=0.99 (two-way ANOVA). K, Migration speed of individual 4T1 cells in intermediate-density collagen after amoeboid conversion for the time period from 48 to 60 h. Treatment conditions were as in (J). Box and whiskers show the median, 25/75 percentile and minimum/maximum; 125 cells, 2–4 tumoroids/experiment, n=1–2). **** P<0.0001 (Kruskal-Wallis test). Abbreviations: E, elongated; P, pseudopodal-amoeboid; B, blebbing-amoeboid; V, vehicle (DMSO); D, DMOG; PD, PD150606; Oligo, (Oligomycin); 2DG, 2-Deoxy-D-Gucose.
To verify that mitochondrial activity decreased in migrating cells, we measured the mitochondrial membrane potential in 3D tumoroid culture using the ratiometric fluorophore tetraethylbenzimidazolylcarbocyanine iodide (JC-1) (Figure S5C). HIF stabilization reduced the JC-1 ratio from 0.5–6 (control) to 0.5–4 (DMOG) in all invading single cells (Figure 5F, G), but reduction of oxidative phosphorylation was particularly strong in elongated and blebbing rounded-moving subsets (Figure S5D). Notably, very low mitochondrial activity (JC-1 ratio <1) was detected in a subset of amoeboid blebbing cells (30% of the total population), while this subset was absent in control cultures (Figure 5G, dashed line; Figure S5D). In addition, as a technical control for the JC-1 assay, the oxidative phosphorylation uncoupling agent FCCP induced a cell subset with similarly low mitochondrial activity (JC-1 ratio <1) under normoxic conditions (Figure 5H, dashed line). Thus, HIF-induced blebbing amoeboid cancer cells migrate with very low mitochondrial activity.
Calpain subtypes, including calpain 1, 2 and 10, are localized in mitochondria, where they cleave mitochondrial proteins and contribute to the mitochondrial stress response and apoptosis induction.59 Activation of mitochondrial-localized calpain-10 cleaves electron transport chain proteins and decreases mitochondrial respiration.60 Whether calpain activity in response to HIF stabilization also affects oxidative energy metabolism in migrating cells, without inducing cell death (compare Figure S1), remains unclear. PD150606 interferes with the Ca2+-binding domain of calpains and targets calpain-1 and −2, among others, but does not inhibit calpain-10 activity.60 In 3D invasion culture treated with DMOG, calpain-2 inhibitor PD150606 partially reverted the decreased JC-1 ratio, alongside with increased cell elongation (compare Figure 3E, G) and mildly increased the JC-1 ratio in vehicle control culture (Figure 5I). Likewise, PD150606 partially rescued HIF-mediated decreased oxygen consumption (OCR) in tumoroids (Figure S5F). This implicates HIF-mediated calpain-2 activation in downregulating oxidative phosphorylation.
To examine directly, whether conversion to blebbing-amoeboid migration is compatible with, or even induced by, perturbation of cell metabolism, we inhibited oxidative phosphorylation and glycolysis, alone and in combination, and monitored the migration mode and speed. Inhibition of oxidative phosphorylation with oligomycin, which inhibited mitochondrial respiration by more than 60% in 3D tumoroid invasion culture (Figure 5B, C), increased the fraction of blebbing-amoeboid cells (Figure 5J). Inhibition of glycolysis by 2-Deoxy-D-Glucose (2DG), which efficiently reduced both oxidative (by 30%) and glycolytic flux (by 60%) in 3D tumoroid culture (Figure S5G-I), near-doubled the blebbing-amoeboid fraction (Figure 5J). When combined, oligomycin and 2DG did not further increase the rate of cell rounding compared to each individual condition (Figure 5J). Importantly, individual interference with oligomycin or 2DG caused only moderate reduction (minus 20–30%) of migration speed, however their combined administration abrogated migration completely (Figure 5K; Video S5). Thus, blebbing-amoeboid migration is a direct consequence of moderately reduced oxidative or glycolytic metabolism, whereas severe impairment of metabolism results in migration arrest.
Calpain activity, blebbing-amoeboid conversion and relevance for metastasis in vivo
Calpain is activated in both early invasive primary tumors and metastatic lesions and further has been implicated in predicting poor prognosis in clinical epithelial cancers.40–43,47 To explore whether calpain is activated in the invasion zone of epithelial tumors in vivo, we applied the calpain sensor CMAC to fresh-frozen sections of human HN-31 and Detroit562 HN-SCC after 6 to 8 weeks of orthotopic growth in nude mice. The invasion pattern of both tumors comprised multicellular nests and groups, typical for cross-sectioned collective invasion strands,61 and scattered individual cells, which displayed notable rounded morphology (median EF 1.2 to 1.5) (Figure 6A, arrowheads; Figure 6B, Figure S6A). Compared to stromal regions, calpain activity was elevated in all tumor portions, including multicellular nests and rounded tumor cells (Figure 6C, Figure S6A). Thus, similar to collective strands and detached single cells in 3D culture, calpain activity is high in disseminated amoeboid-like cells in HN-SCC tumors.
Figure 6. Calpain activity and function during tissue invasion and experimental metastasis in vivo.

A, Representative micrograph of calpain activity (cleaved CMAC intensity) in ex vivo orthotopic human HN-SCC tumor xenograft tissue. Insets and filled arrowheads, CMAC-positive roundish- shaped single cells. Open arrowheads, multicellular clusters. The image represents 3 tumor regions from 1 HN-31 tumor. Scale bar, 100 μm (overview), 10 μm (insets). B, Elongation factor (EF) of single CMAC-positive cells from HN-SCC xenograft. Horizontal line, median. 15 HN-31 from 4 and 5 Detroit562 cells from 1 tumor region (n=1 tumor sample). C, Cleaved CMAC intensity in HN-31 tumor and stromal compartments, including cell-free matrix (ECM, 6 regions), 8 small cells, 8 myofibers, 13 collective cells (CC) and 10 single cells (SC) in the tumor compartment from 1 tumor region. Horizontal lines, median. *** P=0.0001, ** P<0.003, * P<0.04 (Kruskal-Wallis test). D, Representative multi-photon projections (left panels) and morphology and protrusion analysis (right panels) of Lifeact-GFP expressing UT-SCC38 and UT-SCC58 single-cells migrating in the mouse dermis (SHG signal, collagen) after pre-treatment with DMOG and calpain inhibitor PD150606 (100 μM) or DMSO (workflow in Figure S6B). Dots represent individual cells and horizontal lines the median from 111 UT-SCC38 and 45 UT-SCC58 cells from four tumor regions (n=1 mouse). **** P<0.0001 (Mann-Whitney test, two-sided). Scale bar, 50 µm (overviews), 10 μm (insets). E, Macro-metastases (circles) on the lung surface of mice (left panel) and quantification (right panel) 14 days after tail-vein injection of 4T1 cells pretreated with normoxia or hypoxia with or without PD150606 (100 μM); workflow in Figure S6D). Data show the mean ± s.d, data points represent individual lungs (n=3–4 lungs). **** P<0.0001 (one-way ANOVA). F, Representative micrographs from mid-sections of whole lungs. Cytokeratin-8 (CK8), 4T1 nodules.
To directly test whether calpain controls cell shape in vivo, UT-SCC38 and UT-SCC58 cells were pretreated with HIF stabilizer DMOG, implanted into the collagen-rich mouse dermis, and monitored by intravital microscopy (Figure S6B). DMOG-pretreated cells developed round shapes with multiple blebs in contact with collagen fibrils and bundles (Figure 6D, Figure S6C), and some cells intercalated between collagen structures (Figure S6C). Coexposure with DMOG and calpain inhibitor PD150606 diminished bleb-like protrusions and favored elongated morphologies with pointed protrusions towards collagen fibrils (Figure 6D, Figure S6C). These data confirm calpain-dependent blebbing-amoeboid phenotypes in connective tissue in vivo.
Hypoxia is a strong inducer of metastatic activity,62 and calpain-2 activation predicts disease progression and poor prognosis in epithelial cancer.47 To investigate whether hypoxia-induced metastasis depends on calpain, 4T1 cells were maintained in hypoxic or normoxic two-day culture in vitro in the absence or presence of low-dose calpain inhibitor PD150606, injected into the tail vein of nude mice, and analyzed for lung metastasis 14 days later (Figure S6D). Hypoxia enhanced lung metastasis profoundly, and this effect was reverted by calpain inhibition to baseline levels obtained by normoxic control culture (Figure 6E, F). Exposure to PD150606 did not compromise cell viability or proliferation rates during pretreatment (Figure S6E, F) nor the colony-forming capacity in vitro (Figure S6G). Thus, calpain activity controls hypoxia-induced metastatic organ colonization and outgrowth.
Discussion
Combining in vitro, in vivo, and in silico analysis of epithelial cancer cell migration, we here show that hypoxia/HIF signaling provides a microenvironmental trigger for rapid plasticity of mechanocoupling and adaptation of invasion, i.e., the transition from collective or mesenchymal to blebbing-amoeboid migration.
We here show that HIF-induced blebbing-amoeboid conversion is distinct from, and should not be confused with, morphologically similar apoptotic blebbing, based on: (i) intact cell viability over several days, (ii) ongoing occasional cell proliferation, (iii) asymmetry of blebs to the leading cell edge providing polarized interactions with collagen fibers in the direction of migration (compare Video S2), (iv) induction of the calpain/talin axis but not of caspase activity, and (v) the ability of blebbing cells to translocate up to hundreds of micrometers per day. These findings support the concept that blebbing-amoeboid migration is an evolutionary-conserved program induced by cell stress, including Dictyostelium discoideum amoebae under nutrient starvation,63 migrating primordial germ cells forming the gonade in zebrafish embryos,64 melanoma cells,65–67 and, shown here, epithelial cancer cells during hypoxia.
Mesenchymally and collectively invading cancer cells can undergo amoeboid conversion in response to various experimental conditions, including inhibition of MMPs, extreme confinement, targeted inhibition of integrins or deprivation of ECM ligands, and augmenting Rho-mediated actomyosin contractility.11,15,31,68,69 HIF signaling thus represents an upstream trigger inducing integrin antagonization and blebbing-amoeboid migration. HIF signaling is induced by a range of microenvironmental triggers, including hypoxia and acidosis,70 growth factors, and cell transformation through PI3K/Akt/mTOR and MEK/ERK pathways.71 Thus, beyond hypoxia, other cell-autonomous and microenvironmental conditions may elicit amoeboid conversion and escape.
Mechanistically, the calpain-2/talin-1 axis was sufficient in downregulating integrin activity and inducing low-adhesive amoeboid migration. Calpain-2 regulates focal adhesion turnover in the cell rear, e.g., in adhesive fibroblasts, where it locally weakens adhesion bonds and facilitates uropod sliding without affecting overall cell adhesion and elongation.38,40 By contrast, HIF-activated calpain-2 de-regulates integrin function throughout the cell, affecting both leading and trailing cell poles. Thus, calpain-2 causes global cell de-adhesion and amoeboid conversion, as a cell-intrinsic process. Beyond regulating integrin-cytoskeletal interactions, calpain-2 cleaves other proteins involved in cell migration, including cadherins and β-catenin,38 hence weakening cell-cell junctions and favoring individualization.
We further identified amoeboid-blebbing motion as an energy-conserving migration mode. Actomyosin treadmilling and focal adhesion signaling are ATP-consuming processes important in mesenchymal migration.72 Active calpain-2 dampens the cell adhesion machinery and calpain inhibitor PD150606, which inhibits calpains 1, 2 and 9,73 partially reverted the HIF-mediated decrease of oxidative respiration. This may suggest that cytoplasmic and mitochondrial calpain substrates contribute to amoeboid conversion, by connecting mechano-adaptation with mitochondrial respiration. Calpains are known to contribute to the mitochondrial stress response during cell damage, resulting in cell death as an end-point.74 Possibly, when activated within cell-intrinsic regulation downstream of HIF signaling, controlled increase of calpain activity affects oxidative energy metabolism without inducing cell death, to enable cell survival and amoeboid escape from the metabolically challenged microenvironment.
Amoeboid movement retains actomyosin contractility and cortical actin dynamics, while integrin and protease systems are dispensable,11 and, thus, can be regarded as the molecularly and metabolically least demanding migration mode. Indeed, perturbing cell metabolism, by downregulating glycolysis or oxidative phosphorylation by 60–70%, induced blebbing-amoeboid movement directly. This indicates a bidirectional interaction of low energy metabolism and amoeboid movement (“eco-mode”). Thus, cancer cells adjust their migration direction and efficacy51 as well as the migration mode to accommodate both performance and energy requirements.
In addition to the blebbing-amoeboid movement induced by HIF signaling via the calpain-2/talin axis, we noted a different type of rounded cell movement, particularly present in vehicle treated control conditions. This mode comprises rounded cells with high JC-1 ratio (Figure 5F, G) and further is insensitive to calpain inhibitor PD150606 (Figure 3I) or calpain-2 downregulation (Figure 3H) as well as to the expression of cleavage-resistant talin (Figure 4E). This preliminary data suggests that epithelial cancer cells can develop at least two types of amoeboid movement, with differing molecular and energetic mechanisms present during metabolic challenge. Future work will be required to address the divergent mechanisms underlying cell-intrinsic and metabolic stress-induced heterogeneity of cancer cell migration in epithelial and other tumor types.13,75,76
The upstream mechanisms that regulate calpain activity in response HIF signaling remain to be shown. Hypoxia/HIF may regulate calpain activity through multiple routes, including calpain-2 transcription,77–79 activity regulation via the calpain subunits S1 or S2 or its endogenous inhibitor calpastatin, as well as calcium homeostasis or protein phosphorylation.38 Our kinetic analyses implicate the HIF-induced calpain response as a durable program, supporting hypermetastatic ability beyond the period of hypoxic challenge. Under continuous hypoxia, blebbing amoeboid migration remained stable over several days, without reversion to other migration modes. HIF stabilization, as pretreatment regime, secured blebbing invasion in the normoxic dermis over several hours and mediated metastatic lung colonization over several days, despite discontinuation of hypoxia/HIF trigger, in a calpain-2 dependent manner. Thus, targeting calpain-2 may limit HIF-promoted metastatic dissemination as secondary prevention in high-risk patients and patients with a high load of circulating tumor cells.
STAR Methods
RESOURCE AVAILABILITY
Lead contact
Further information and requests for resources and reagents should be directed to Peter Friedl (pfriedl@mdanderson.org, peter.friedl@radboudumc.nl).
Materials availability
This study did not generate new unique reagents.
Data and code availability
Western blot source data for all independent experiments used for quantification are published with this manuscript as Data S1. All other data reported in this paper will be shared by the lead contact upon request.
All original code has been deposited at Github (https://github.com/yanjun07/phaseField) and is publicly available as of the date of publication. DOIs are listed in the key resources table.
Any additional information required to reanalyze the data reported in this paper is available from the lead contact upon request.
KEY RESOURCES TABLE
| REAGENT or RESOURCE | SOURCE | IDENTIFIER |
|---|---|---|
| Antibodies | ||
| rabbit polyclonal anti-HIF1α | Novus Biologicals | Cat#NB100-479 |
| rabbit polyclonal anti–calpain-2 large subunit | Cell Signaling | Cat#2539 |
| chicken polyclonal anti-β-actin | Abcam | Cat#13822 |
| rabbit polyclonal anti-β-actin | Cell Signaling | Cat#4967 |
| rabbit polyclonal anti–talin-1 | Sigma Aldrich | Cat#T3287, Clone8d4 |
| rabbit monoclonal anti-mouse CD29 | Millipore / Abcam | Cat#04-1109, clone EP1041Y / ab179471, clone 1A27 |
| mouse monoclonal anti-CD29 | Merck Millipore | Cat#MAB2079Z, clone HUTS-4 |
| mouse monoclonal anti-CD29 | Beckman Coulter | Cat#6603113, clone 4B4 |
| rat monoclonal anti-CD29 | BD Biosciences | Cat#553715, clone 9EG7 |
| rat IgG2a | BD Biosciences | Cat#553927, clone R5-95 |
| armenian hamster monoclonal anti-CD29 (FITC-conjugated) | BioLegend | Cat#102206, clone HMβ1-1 |
| armenian hamster IgG (FITC-conjugated) | BioLegend | Cat#400906, clone HTK888 |
| rabbit monoclonal anti-cleaved caspase-3 | Cell Signaling | Cat#9664 |
| mouse anti-CD29 | BioLegend | Cat#303010, cloneTS2/16 |
| goat anti-rabbit (conjugated to horseradish peroxidase) | Jackson | Cat#211-032-171 |
| goat anti-mouse (conjugated to horseradish peroxidase) | Jackson | Cat#115-0450174 |
| goat anti-chicken (conjugated to horseradish peroxidase) | Jackson | Cat#103-035-155 |
| rabbit-on-rodent HRP-polymer | Biocare Medical | Cat#RMR622 |
| goat anti-rat IgG AF488 | Thermo Fisher Scientific | Cat#A21247 |
| goat anti-rabbit IgG AF633 | Thermo Fisher Scientific | Cat#A21071 |
| IRDye® 680RD Goat anti-Mouse IgG Secondary Antibody | Licor | 926-68070 |
| IRDye® 680RD Goat anti-Rabbit IgG Secondary Antibody | Licor | 926-68071 |
| Goat anti-Rat IgG Secondary Antibody Alexa Fluor 680 | Thermo Fisher Scientific | Cat#A21096 |
| Biological samples | ||
| Human HN-31 tumor xenograft | Jeffrey Myers Laboratory, MD Anderson Cancer Center | N/A |
| Human Detroit-261 tumor xenograft | Jeffrey Myers Laboratory, MD Anderson Cancer Center | N/A |
| Chemicals, peptides, and recombinant proteins | ||
| Dimethyl oxalylglycine (DMOG) | Cayman Chemical | 71210-100 |
| PD150606 | Cayman Chemical / Sigma Aldrich | 13859, CAS: 179528-45-1 / D5946 |
| Etoposide | Sigma Aldrich | E1383, CAS: 33419-42-0 |
| Oligomycin A | Selleckchem | S1478 |
| 2-Deoxy-D-glucose | Sigma Aldrich | D8375, CAS: 154-17-6 |
| Carbonyl cyanide-4-(trifluoromethoxy)phenylhydrazone (FCCP) | Sigma Aldrich | C2920-10MG |
| Rotenone | Sigma Aldrich | R8875, CAS: 83-79-4 |
| Antimycin-a | Sigma Aldrich | A8674, CAS: 1397-94-0 |
| Tetraethylbenzimidazolylcarbocyanine iodide (JC-1) | Sigma Aldrich / Enzo LifeSciences | T4069-5MG / ENZ-52304 |
| t-BOC-L-leucyl-L-methionine amide (CMAC) | Thermo Fischer Scientific | A6520 |
| Methyl cellulose | Sigma Aldrich | M6385 |
| Collagen I, High Concentration, Rat Tail, 100mg |
Corning | Cat#354249 |
| Bovine Type I Atelo-Collagen Solution, 3 mg/ml |
Advanced Biomatrix | Cat#5005-100ML |
| LIVE/DEAD fixable stain | Thermo Fisher Scientific | Cat#L34976 |
| MISSION siRNA transfection reagent | Sigma Aldrich | S1452 |
| OptiMEM | Thermo Fisher Scientific | Cat# 31985062 |
| Lipofectamine 2000 | Thermo Fisher Scientific | Cat# 11668019 |
| Rodent Decloaker | Biocare Medical | SKU: RD913 |
| Sodium oxamate | Sigma Aldrich | CAS: 565-73-1 |
| Protease inhibitor cocktail | Roche | 926-68071 |
| Novex™ 4–20% Tris-Glycine Mini Gels | Thermo Fisher Scientific | XP04200BOX |
| cOmplete ULTRA Tablets (Protease inhibitor cocktail) |
Roche | 05892791001 |
| PhosSTOP | Sigma Aldrich | PHOSS-RO |
| Immobilon-PSQ Membrane, PVDF | Merck Millipore | Cat#ISEQ85R |
| Bradford Reagent | Sigma Aldrich | B6916 |
| Phalloidin | Thermo Fisher Scientific | A22283 |
| DAPI | Thermo Fisher Scientific | D21490 |
| Critical commercial assays | ||
| Lactate Colorimetric/Fluorometric Assay Kit | BioVision | K607 |
| Experimental models: Cell lines | ||
| Mouse breast carcinoma: 4T1 cells | ATCC | CRL-2539; STR with matching profile; no interspecies cross contamination |
| Human head and neck squamous carcinoma: UT-SCC38 cells | Turku University and Turku University Hospital, 20521 Turku, Finland | STR with unique profile; no interspecies cross contamination |
| Human head and neck squamous carcinoma: UT-SCC58 cells | Obtained from Raider Grenman, University of Turku, Finland | STR with unique profile; no interspecies cross contamination |
| Human head and neck squamous carcinoma: UT-SCC38 Lifeact-GFP cells | Friedl Laboratory | N/A |
| Human head and neck squamous carcinoma: UT-SCC58 Lifeact-GFP cells | Friedl Laboratory | N/A |
| Human head and neck squamous carcinoma: Detroit 562 cells | ATCC | CCL-138 |
| Human head and neck squamous carcinoma: HN-31 cells | Provided by Dr. John Ensley, Wane State University, Detroit, MI | N/A |
| Experimental models: Organisms/strains | ||
| Swiss nu/nu nudes | MD Anderson Housing and Breeding Center in the Experimental Radiation Oncology Department, MD Anderson Cancer Center | N/A |
| Athymic nude | ENVIGO | 069 |
| Oligonucleotides | ||
| MISSION siRNA targeting mouse CAPN2 (siRNA ID-#1): SASI_Mm01_00183464, sequence start 1243 | Sigma Aldrich | Cat#NM_009794 |
| MISSION siRNA targeting mouse CAPN2 (siRNA ID-#2): SASI_Mm01_00183465, sequence start 1820, | Sigma Aldrich | Cat#NM_009794 |
| MISSION siRNA targeting mouse CAPN2 (siRNA ID-#3): SASI_Mm01_00183467, sequence start 2132 | Sigma Aldrich | Cat#NM_009794 |
| MISSION siRNA targeting human CAPN2 (siRNA ID-#1): SASI_Hs01_00059357, Sequence start 1053, | Sigma Aldrich | Cat#NM_001748 |
| MISSION siRNA targeting human CAPN2 (siRNA ID-#2): SASI_Hs01_00059364, Sequence start 810 | Sigma Aldrich | Cat#NM_001748 |
| MISSION siRNA targeting human CAPN2 (siRNA ID-#3): SASI_Hs01_00059356, Sequence start 2234 | Sigma Aldrich | Cat#NM_001748 |
| MISSION siRNA universal negative control | Sigma Aldrich | Cat#SIC001 |
| Recombinant DNA | ||
| pEGFP N1 | ClonTech | Cat#6085-1 |
| plasmid DNA construct GFP-TalinL432G | Addgene | Cat#26725 |
| Software and algorithms | ||
| Fiji | ImageJ | https://imagej.net/software/fiji/ |
| GraphPad Prism 8 | GraphPad | https://www.graphpad.com/scientific-software/prism/ |
| Autozell version 080912 | Center for Computing and Communication Technologies [TZI], University of Bremen, Germany | Proprietary code; can be obtained on specific request |
| MATLAB | MathWorks | https://www.mathworks.com/products/matlab.html. |
| Python version 3.8. | Python Software Foundation | https://www.python.org/ |
| Matplotlib Version 3.4.3. | Matplotlib package | https://matplotlib.org/. |
| Phase Field 2D Cell Motility Simulation v1.0. | Center for Theoretical Physical Biology, Rice University / Northeastern University, USA | https://github.com/yanjun07/phaseField |
EXPERIMENTAL MODEL AND SUBJECT DETAILS
Cell lines and culture
Murine 4T1 breast carcinoma cells (CRL-2539, ATCC), a model for local invasion and distant metastasis, 80 were cultured in RPMI (RPMI1640; Sigma Aldrich, unless stated otherwise) containing 10% fetal bovine serum (FBS; Sigma Aldrich), penicillin (100 U/mL), streptomycin (100 μg/mL; PAA), and sodium pyruvate (1 mM; Thermo Fisher Scientific). Human UT-SCC38 (fully epithelial, locally invasive, non-metastatic) and UT-SCC58 (locally invasive, metastatic) head and neck squamous carcinoma cells (HNSCC),81 as well as UT-SCC38 Lifeact-GFP and UT-SCC58 Lifeact-GFP cells, were cultured in Dulbecco’s modified Eagle medium (DMEM; Sigma Aldrich), supplemented with 10% FBS (Sigma Aldrich), penicillin (100 U/mL), streptomycin (100 μg/mL; PAA), and sodium pyruvate (1 mM; Gibco). Compared to UT-SCC38 cells which are fully epithelial,21 4T1 cells have undergone partial EMT,75 and develop a higher proportion of elongated cells at baseline tumoroid culture.
Human Detroit 562 (ATCC) and HN-31 (originally provided by Dr. John Ensley, Wane State University, Detroit, MI) HNSCC cell lines were cultured in DMEM (Gibco) supplemented with 10% FCS (Sigma Aldrich). Stable Detroit 562 cell lines expressing control vector for short hairpin RNAs (shRNAs) were established as described previously.82 The tumor cell identity was verified by short tandem repeat (STR) DNA profiling (IDEXX BioResearch) and no interspecies contamination was detected. Cells were routinely tested negative for mycoplasma contamination (Myco Alert, Lonza).
Animal models
Orthotopic implantation of human HN-SCC xenografts was performed into the tongue of 6- to 8- week-old male athymic nude mice (ENVIGO). Tumor cell implantation into the dorsal skin-fold chamber and intravital multiphoton imaging was performed in 8- to 10-week-old male athymic nude mice (MD Anderson Housing and Breeding Center in the Experimental Radiation Oncology Department, MD Anderson Cancer Center). Animals were kept in single housing after window transplantation surgery. Experimental lung metastasis studies were performed in 8- to 10-week-old female athymic nude mice (MD Anderson Housing and Breeding Center, Department of Experimental Radiation Oncology, MD Anderson Cancer Center). Littermates were randomly assigned to experimental groups. All animal experiments and intravital microscopy protocols were approved by the Animal Care and Use Committee (ACUC) of the University of Texas MD Anderson Cancer Center.
METHOD DETAILS
Hypoxia culture and DMOG treatment
For cell function studies, cells were cultured as 2D monolayers or tumoroids in 3D collagen lattices in normoxia (21% O2) or hypoxia (0.2% O2, CB53 incubator, Binder GmbH) for 72 hours (4T1) or 96 hours (UT-SCC38),21 unless indicated otherwise. For pharmacological activation of HIF in culture, cells were treated with DMSO (0.1, solvent control) or the prolyl-hydroxylase inhibitor DMOG (1 mM) for 72 hours (4T1) or 96 hours (UT-SCC38).
Cell isolation from 2D culture
Subconfluent monolayers were grown under normoxic and hypoxic conditions or DMSO and DMOG for 72 hours (4T1) or 96 hours (UT-SCC38), unless otherwise stated. For separation of low- and high-adhesive cell populations, the supernatant medium was gently removed and low-adhesive cells were harvested by manual horizontal circular washing with warm PBS (100 cycles, 37 °C). Cells that remained plate-attached after washing (i.e., the highly adhesive population) were detached using trypsin-EDTA (2mM, 37 ˚C), and the low- and high-adhesive subsets were used separately or pooled for further analyses (cell viability, flow cytometry, Western blotting).
Cell viability and proliferation analysis from 2D culture (treatment workflow underlying experimental metastasis assay)
4T1 cells were cultured under normoxia or hypoxia in the presence of calpain inhibitor PD150606 (100 μM, unless stated otherwise) or solvent (DMSO) for 48 hours. DMSO and PD150606 were refreshed after every 20 hours. Cell viability was detected by Trypan Blue exclusion. The proliferation ratio reflects the total cell number harvested at the end-point divided by the number of cells seeded.
Colony formation assay
A chilled well-plate was coated with a smooth bottom layer of reconstituted basement membrane (rBM) (matrigel; BD Bioscience) by centrifugation with slow acceleration (4 °C, 300 x g, 10 min) and solidification (37 °C, 30 min). 4T1 cells were cultured under normoxia or hypoxia in the presence of calpain inhibitor PD150606 (100 μM) or solvent (DMSO) for 2 days (refreshed every 20 hours and 2 hours before harvesting). Low- and high-adhesive cells were harvested (by PBS rinse and trypsin-EDTA (2 mM), respectively), pooled, resuspended in medium containing 5% rBM solution and added onto polymerized rBM for 5-day culture (37 °C, 5% CO2), with medium refreshment at day 3. Colonies were fixed (2 % pre-warmed PFA, 5 min), followed by incubation in 4 % PFA (10 min) and staining with DAPI. Colonies were imaged by epifluorescence and brightfield microscopy (Olympus IX-71, EM-CCD camera). Z-stacks were displayed as composites of maximum projections.
Immunoblotting
Western blot analysis of protein expression was performed using subconfluent 2D cell monolayers. Cells were washed twice with ice-cold PBS, followed by protein extraction with lysis buffer (10 mM Tris, pH 8.0; 1 mM EDTA, pH 8.0; 150 mM NaCl; 0.1% NP-40), supplemented with a protease and Phosphate inhibitor cocktail. For detection of active β1 integrin epiope, cells were lysed under non-reducing conditions (no β-mercaptoethanol in lysis buffer). Protein concentration was determined by the Bradford assay. Lysates containing 40 μg of protein were loaded on Novex 4%-to-20% Tris-Glycine Mini Gels and transferred by electroblotting (120 V, 1 hour) in transfer buffer (28 mM Tris-HCL; 39 mM Glycine; 20% methanol v/v) onto SQ-PVDF membranes. Immunodetection was performed using primary antibody dilutions (1/100 – 1/1000) and HRP conjugated secondary antibodies (1/2000 – 1/10000 dilutions) in combination with the SuperSignal West Pico Chemiluminescent Substrate and CL-Xposure films or with Alexa Fluor/IRDye 680 secondary antibodies in combination with the Typhoon Biomolecular Imager (Amersham). Densitometry of bands was performed after normalization to the β-actin loading control for each protein followed by normalization to the reference protein using Fiji/Image J.
Flow cytometry
For detection of β1 integrin levels, cells were cultured as subconfluent monolayers and detached by trypsin-EDTA (2 mM), washed in PBS and stained with LIVE/DEAD stain (30 min, 4°C). 4T1 cells were stained with primary antibodies and matching IgG controls dissolved in FACS buffer (2% FBS/2mM EDTA in PBS; 1 hour, 4 °C), washed with FACS buffer, incubated with secondary antibody dissolved in FACS buffer (30 – 60 min, 4 °C), and analyzed by flow cytometry (BD FACS CANTO II; BD Biosciences). Quantification of the median fluorescence intensity (MFI) was calculated by linear subtraction of IgG control MFIs followed by total β1 integrin content and/or normalization to MFIs of DMSO, as indicated. All data analysis was performed using FlowJo (version 10.3.).
Tumoroid invasion assay in 3D collagen matrices
Multicellular tumoroids were generated from subconfluent culture using the hanging-drop assay (20% methylcellulose; 500 cells/25 μL drop; overnight tumoroid assembly).83 Tumoroids were embedded in mid-density non-pepsinized rat-tail collagen type I (2.5 mg/ml, average pore size 4 μm2), low-density bovine collagen (1.7 mg/mL, 20 μm2), or high-density rat-tail collagen (4 mg/mL, 1 μm2).12 After collagen polymerization (37 °C, 10 – 20 min), 3D cultures were treated with DMOG (1 mM) or DMSO (0.1%, vehicle control) dissolved in respective cell culture media or placed in incubators with 21% normoxic or 0.2% hypoxic oxygen levels. Migration morphology and efficacy were monitored by brightfield time-lapse microscopy (Leica) or endpoint analysis after 72 hours (4T1) or 96 hours (UT-SCC38).
For cell counting of tumoroid 3D invasive cultures, tumoroid- collagen droplets were incubated with collagenase type I at 37 ˚C and cells were disaggregated by trypsin-EDTA (2mM).
Pharmacological treatment of 3D tumoroid migration cultures
The molecular dependencies of cell migration modes and the migration efficacy of individual cells were tested in 3D collagen cultures after 48 hours (4T1) or 72 hours (UT-SCC38) in DMSO/DMOG or normoxia or hypoxia conditions. At these time points, single-cell migration was established. The following reagents and compounds were added to the culture media: β1 integrin–blocking antibody 4B4 (0.5–5 μg/mL for reducing speed; 10 μg/mL for probing morphology), β1 integrin–activating antibody TS2/16 (20 μg/mL, UT-SCC38), β1 integrin activating antibody 9EG7 (5 μg/mL, 4T1), calpain inhibitor PD150606 (50 or 100 μM), 2-Deoxy-D-glucose (5mM for inhibition of glycolysis, no additional sodium pyruvate was added), ATP-sytnhase inhibitor oligomycin (2 μM for inhibition of OXPHOS) and etoposide (200 μM). Tumoroid cultures in 3D collagen were incubated (37˚C) with compound and monitored by single time-point or, for up to 20 hours, time-lapse brightfield microscopy (Leica). All antibodies and inhibitors used in live-cell assays were purchased as azide-free compounds or dialyzed (Slide-A-Lyzer mini dialysis device, 20 MWCO).
Transient transfection of cell monolayers and 3D tumoroid cultures
Cells in monolayer culture were incubated (20 hours, 37˚C) with a mission-siRNA transfection mix (100 nM siCAPN2 or siControl, 128 μL MISSION siRNA transfection reagent, 1.2 mL serum-free medium, 6.8 mL complete medium, 200,000 cells, per 10cm2 dish) or with a plasmid DNA transfection mix (6 μg GFP-TalinL432G or pEGFP plasmid DNA, 15 μL Lipofectamine 2000, 500 μl OptiMEM, 9 mL complete medium, 75,000 cells, per 10 cm2 dish). The transfection medium was removed and transfected cells were used for further analysis.
For molecular intervention followed by 3D matrix culture, cell transfection was performed during 3D tumoroid aggregation. A mission-siRNA transfection mixture (100 nM of mission-siRNA siCAPN2 or siControl, 32 μL MISSION siRNA transfection reagent, 200ul serum-free medium) or a plasmid DNA transfection mixture (4 μg GFP-TalinL432G or pEGFP plasmid DNA, 10 μL Lipofectamine 2000, 75 μL OptiMEM) was added to the cell suspension (50,000 cells, suspended in aggregation medium containing 20 % methylcellulose) plated as hanging drops (500 cells per 25 μL per drop) for cell aggregation (18 hours, 37°C). Tumoroids were washed with medium and used for 3D collagen culture.
Time-lapse microscopy
3D tumoroid cultures were placed and maintained (37°C) in wax-sealed migration cambers.12 Brightfield time-lapse microscopy was performed using DM IL LED microscopes using 20x/0.30 HI Plan objectives (Leica Microsystems), equipped with STC-405 cameras (Sentech). Image acquisition was obtained by the 16-Channel Recorder software (SVS-Vistek GmbH 2004) at 4 min intervals.
Immunostaining and confocal microscopy
For immunofluorescence staining, 3D collagen cultures (100 μL) were fixed (2% PFA, 5 min, 37°C; followed by 4 % PFA, 10 min, 37°C), washed (PBS, 3×10 min), permeabilized and blocked (PBS/0.1 % BSA/10 % normal goat serum /0.3 % Triton X-100, 1 hour, RT), and incubated with primary antibody (in 0.1 % PBS/BSA/0.3 % Triton X-100, 18 hours, 4˚C). Cultures were washed eight times (PBS, 1 hour each), incubated with DAPI and secondary antibody (18 hours, 4°C in PBS/0.1 % BSA/ 0.3% Triton X-100), washed three times (PBS, 10 min each), and imaged as whole-mount 3D samples. Confocal fluorescence and reflectance microscopy were performed by sequential single-channel confocal scanning using a CS APO 40x NA 1.15 objective (TCS SP5 Confocal Microscope, Leica Microsystems) and an inter-slice distance of 2 μm.
For detection of active β1 integrin levels in situ, 3D collagen cultures (100 μL) of 4T1 tumoroids were incubated with active β1 integrin antibody 9EG7 diluted in medium (15 min, 37˚C), washed (warm PBS, 3×5 min each) and fixed in 2% PFA (5 min, 37°C) followed by 4 % PFA (10 min, 37°C). Samples were blocked (1 hour, blocking buffer: 0.1 % PBS/BSA/10% normal goat serum) and incubated with DAPI, phalloidin, primary and secondary antibody dissolved in blocking buffer (18 hours, 4˚C). Structured illumination microscopy using a 20x/0.8 objective (Zeiss LSM880/AiryScan) was performed for detecting phalloidin, active β1 and total β1 integrin signals at an inter-slice distance of 1 μm.
Calpain activity assays
For detection of calpain activity in subconfluent monolayers, cells were detached with trypsin-EDTA (2mM), washed (PBS), incubated in the dark with LIVE/DEAD dye (Thermo Fisher Scientific) together with CMAC (10 μM, 20 min, 37°C), washed (PBS), incubated with calpain inhibitor PD150606 (100 μM in medium, 2 hours, 37°C) or DMSO vehicle and fixed (0.5% PFA/PBS, 18 hours, 4°C). CMAC substrate cleavage was detected by flow cytometry (LSRII, BD) using 355nm laser excitation and detected through a 440/40 filter (excitation/emission peaks at 351/430 nm). As reference for baseline fluorescence, cell autofluorescence was used and subtracted from the MFI of cleaved CMAC intensity using FlowJo (version 10.3). Calpain activity in 3D tumoroid culture or in human tumor xenografts was detected using multiphoton microscopy (LaVision BioTec) using a 25x NA 1.05 water objective (Olympus). Live tumoroid-containing 3D collagen cultures were washed (PBS, 5 min), incubated with CMAC (20 μM, 30 min, 37°C), and fixed (2% PFA in PBS, 5 min, 37°C; followed by 4 % PFA, 10 min, 37°C). For calpain inhibition, 3D tumoroid cultures were incubated with calpain inhibitor PD150606 (100 μM, 37°C, 20 hours), and inhibitor was refreshed 2 hours before fixation. For shape analysis of CMAC-stained cells, 3D samples were incubated with AlexaFluor 546-conjugated phalloidin (1 hour, RT). Calpain activity in human tumor xenografts was detected in fresh-frozen cryosections (50 μm), which were thawed (5 min, 20°C), incubated with CMAC (100 μM, 45 min, 37°C), washed twice (PBS, 5 min each) and fixed (2% PFA, 5 min, 37°C followed by 4% PFA, 10 min, 37°C). Images were acquired as 3D stacks with 2 μm inter-slice distance using excitation at 730 nm (20 mW power under the objective) and simultaneous 2-channel emission of cleaved/uncleaved CMAC was obtained using customized 427/10 filter (Semrock) and dichroic filter 405 nm (Semrock), respectively. Further channels were AlexaFluor 546-conjugated phalloidin (excitation: 1090nm; detection: 620/50), second harmonic generation (excitation: 1090nm; detection: 525/50).
Metabolism in 3D culture
Oxygen consumption rates (OCR) and extracellular acidification rates (ECAR) in 3D tumoroid invasion cultures were quantified using the Seahorse Bioscience XFe24 analyzer (Agilent). Individual 4T1 tumoroids were placed in collagen droplets (rat-tail collagen, 4 mg/mL) in XF24 V28 plates (Agilent) and treated with DMOG (1 mM) or solvent (DMSO) 48 hours prior to metabolic analysis. Thirty minutes before the measurements, the culture medium was replaced by XF Base medium (Agilent) supplemented with 2 mM L-glutamine, 1 mM pyruvate, 12 mM glucose (pH 7.4, 37°C), and OCR and ECAR were measured for 2 min periods with 3 min wait intervals. Three basal activity measurements were followed by treatment with oligomycin (2 μM), FCCP (1 μM), and a combination of Rotenone (2 μM) and Antimycin-a (2 μM) in triplicate measurements.
For detection of lactate release, tumoroid invasion cultures were maintained (48 hours) under normoxic and hypoxic conditions or treated with DMOG (1 mM) or control vehicle (DMSO). The supernatant was harvested, treated with sodium oxamate (100 μM, LDH inhibitor) to prevent lactate-to-pyruvate conversion, and secreted lactate was determined colorimetrically (Lactate kit K607; Biovision). In brief, a reaction mix containing the sample, enzyme mix and buffer was generated and incubated (20°C, 30 min, in darkness). Absorbance was measured at OD 570 nm and corrected by subtracting the background absorbance and the basic lactate-supplement from the medium and was normalized to the number of tumoroids.
Live-cell microscopy of mitochondrial activity in 3D culture
To evaluate the mitochondrial membrane depolarization status, JC-1 dye (10 μg/mL) or solvent (DMSO) were added (for 60 min) to 3D invasion culture. For pharmacological uncoupling of mitochondrial oxidative phosphorylation, FCCP (200nM) or solvent (ethanol, 1:5,000) was added (40 min after start of JC-1 incubation, for 20 min total). Live tumoroid cultures were washed (HBSS, 3 × 5 min) and confocal microscopy (LSM880, Zeiss; 37˚C) was performed in phenol-red free medium as 3D stacks (2 μm inter-slice distance) with the following settings: 488nm excitation, detection (Ch2GaAsP detector) at 511 to 567 nm (green) and 575 to 624nm (red).
Image analysis and single cell cytometry of 3D culture
Brightfield, confocal, and multiphoton microscopy images were analyzed and processed using Fiji/ImageJ (version 1.51). Excluded from analysis were: dead cells, detected by cellular or nuclear fragmentation or condensation; mitotic cells, detected by cell swelling and/or rounding; and post- mitotic cells, including oppositely polarized cell doublets.
Protrusion types and number and the frequency of migrating single cells exhibiting a classified protrusion type were counted using the phalloidin channel from confocal maximum intensity z-projections (40x/1.15 objective). Migration morphology of subtypes was classified from brightfield movies or still images (20x/0.30 HI Plan objective) acquired as z-series from non-overlapping tumoroid quadrants (4T1) or whole tumoroids (UT-SCC38). Scoring was performed by two independent operators in a non-blinded fashion and results of selected experiments were verified by double-blinded analysis, based on the following morphological criteria: Elongated (E), cell body is at least twofold longer than wide (equivalent to EF≥2), with spindle-shaped morphology and 1 or several pointed pseudopodal protrusions at either cell pole; amoeboid pseudopodal (P), roundish cell shape (equivalent to EF<2) with indentations (deformation marks) and 1 or several pointed, pseudopodal protrusions; amoeboid blebbing (B), roundish cell shape (equivalent to EF>2) with multiple bleb-shaped protrusions and absence of pointed protrusions.
The total number of 4T1 subtypes per tumoroid was obtained from tumoroid quadrants and multiplied by 4. Migration paths and speed of single cells were digitized using Autozell (software version 080912; Center for Computing and Communication Technologies [TZI], University of Bremen, Bremen, Germany). The average migration speed was calculated by the length of the xy-path divided by the time. Only viable cells were included in the analysis. Cell elongation of detached cells was measured from stand-still images as the ratio of the maximum cell length over the maximum cell width.
The activation status of β1 integrin on individually migrating cells in 3D collagen culture was obtained by manually segmenting detached cells, creation of the summed intensity z-projection, and automated segmentation of the nucleus (DAPI channel) and F-actin (phalloidin channel). The merged DAPI and phalloidin channels were used for defining the cell area from which the raw integrated density of both active and total β1 integrin epitope was quantified.
Calpain activity in invading cells was quantified from maximum intensity z-projections. Single detached cells were segmented manually from the phalloidin channel using the shape tool. Cleaved and uncleaved CMAC substrate intensities were calculated as corrected total cell fluorescence (CTCF) with the formula: CTCF = Integrated Density – (Area of selected cell X Mean fluorescence of background readings). The signal ratio of cleaved/uncleaved CMAC was proportional to cleaved CMAC signal intensities only (427/10 emission), thus representing calpain activity by single channel detection. To identify calpain activity in migration subsets, CTCF per cell and cell elongation (maximum cell length/maximum cell width; phalloidin channel) were co-registered.
Mitochondrial membrane depolarization in invading single cells was obtained using JC-1. Summed intensity z-projections were created and the region of interest (single detached cells) were drawn manually using the shape tool on the brightfield channel. The mean intensity of the red and green JC-1 channels per cell were obtained to calculate the JC-1 ratio (red/green intensity).
Computational modelling of cell elongation
A two-dimensional phase field model was used to simulate cells with different contractility and cell-substrate friction, which jointly regulate the cell shape, actin flow field, and traction force toward the substrate.33 In this model, cell contractility and cell-substrate friction lead to an elongated cell shape. The cell boundary was defined by a set of partial differential equations for the phase field φ which minimize its energy. For a single cell, its Hamiltonian (energy) can be written in form of equation (1):
| (1) |
where the first term is related to the cell perimeter, and the second term represents the energy for the curvature integrated over the membrane. The phase field evolves with time, simulating the movement of the cell via coupling of the actomyosin cytoskeleton and adhesion to the substrate to the phase field. This coupling involves active force generation through both actin polymerization and the activity of myosin motors. The detailed dynamics for the phase field systems underlying our simulations were taken from Shao et al.33
To regulate the intracellular contractility and friction between the cell and the substrate, three parameters were used: myosin contraction coefficient , effective viscosity of actin flow , and gripping coefficient . A larger will lead to a larger contractility, and a larger (or ) results in a larger friction. We assume a relationship between and in the form of equation (2) to simplify the model,
| (2) |
For each run, the simulation was initialized with different changes according to equation (2) and . After initialization, the cell starts to move according to the dynamic equations. Cell shape and speed weres recorded at steady state. The elongation factor of cells with different and was calculated based on images as the ratio cell length/width. The average speed of cells with different and was calculated and represented as 3D landscape plot (speed vs. and ). Mathematical algorithms are unpublished but can be provided upon reasonable request.
Orthotopic human HN-SCC xenograft model
Animal experiments were approved by the Animal Care and Use Committee (ACUC) of the University of Texas MD Anderson Cancer Center (00001148-RN00 and 00001522-RN00). Orthotopic human HN-SCC xenografts in nude mice were established as described.84 HN-31 and Detroit 562 cells were injected (5 × 10⁴ in 30 μL serum-free DMEM; Gibco) into the dorsal part of the tongue of 6- to 8- week-old male athymic nude mice (ENVIGO). Mice were euthanized by CO2 asphyxiation 30 days post-injection or when losing more than 20% of their pre-injection body weight. Tongues containing primary tumors were resected at the endpoint and cryopreserved.
Tumor cell implantation in vivo and intravital multiphoton imaging
Intravital microscopy protocols were approved by the Animal Care and Use Committee (ACUC) of the University of Texas MD Anderson Cancer Center (00001002). A dorsal skin-fold chamber containing an optical imaging window was transplanted onto 8- to 10-week-old male athymic nude mice (MD Anderson Housing and Breeding Center in the Experimental Radiation Oncology Department, MD Anderson Cancer Center). Prior to injection, UT-SCC38 or UT-SCC58 cells expressing H2B-mCherry/Lifeact-GFP were cultured in the presence of DMOG (1 mM) with or without calpain inhibitor PD150606 (100 μM) for 48 hours. DMOG and PD150606 were refreshed after 20 hours and 2 hours before cell harvesting. Both weakly and firmly adhesive cells were harvested (PBS rinse, trypsin-EDTA (2mM) respectively), filtered through a FACS cell strainer cap (35 μm, Thermo Fisher) and injected as individual cells (1×10⁴ cells in PBS/mouse) intradermally into the optical imaging window 2 days after transplantation surgery. Four hours (UT-SCC58) and 20 hours (UT-SCC38) post- injection, intra-vital multiphoton microscopy was performed (3D z-stacks, 2 μm interslice distance, 3–5 regions, 1 animal/ cell line) with the following excitation and detection settings: Lifeact-GFP (920 nm, 20mW, BP 525/50); H2B-mCherry (1090 nm, 50mW, BP620/50); second harmonic generation (SHG; collagen) (1090 nm, 50mW, BD 525/50), third harmonic generation (1180 nm, 70mW, BP 387/15). Image analysis, 3D reconstruction and maximum intensity projections were performed using Fiji/ImageJ (version 1.51). Dying cells (nuclear fragmentation) and non-migrating cells (lacking actin-rich protrusions) were excluded from the analysis.
Experimental lung metastasis
Animal experiments were approved by the Animal Care and Use Committee (ACUC) of the University of Texas MD Anderson Cancer Center (00001002). 2 days prior to tail-vein injection, cells were cultured under normoxic or hypoxic conditions in the presence of calpain inhibitor PD150606 (100 μM) or vehicle control (0.1% DMSO). PD150606 was refreshed after every 20 hours. Two hours after the last refreshment, weakly and firmly adhesive cells were harvested (PBS rinse, trypsin-EDTA [2mM] respectively), filtered through a FACS cell strainer cap (35 μm, Thermo Fisher) washed (PBS), and injected (30 G needle) as individual cells (500,000 cells in 100 μL/ mouse) into the tail vein of 8- to 10-week-old female athymic nude mice (MD Anderson Housing and Breeding Center, Department of Experimental Radiation Oncology, MD Anderson Cancer Center). Fourteen days post-injection, mice were euthanized and subjected to whole-lung perfusion fixation (10 % neutral buffered formalin, 5 min). Lung macrometastases were manually counted, defined as whitish colonies on the lung surface. Metastasis by epithelial cells was immunohistochemically confirmed, by submerging the lungs in formalin (10%, 5–7 days) followed by sectioning (4 μm thickness; Research Histology Core Laboratory, MD Anderson Cancer Center). Antigen retrieval was performed in citrate buffer (Rodent Decloaker) and anti-cytokeratin 8 antibody (30 min incubation) was detected using rabbit-on-rodent HRP detection polymer (15 min incubation) visualized with diaminobenzidine, counterstained with hematoxylin and imaged with panoramic digital scanner (3DHISTECH, sysmex, Norderstedt, Germany; 40X objective).
Data quantification and statistical analysis
Bar graphs represent the means and standard deviation and scatter diagrams the median and interquartile range (25%−75%) of individual cell data points from pooled experiments. Statistical analysis was performed using the two-tailed non-paired t test (two groups) or one- or two-way ANOVA (more than two groups). For non-parametric distributions determined by normality testing, Mann-Whitney U (two groups) or Kruskal-Wallis multiple comparison with Dunn’s correction (multiple groups) were used, unless otherwise indicated. The statistical details of experiments, definition of significance and statistical method used can be found in the figure legends. Statistical analysis was performed using GraphPad Prism 8 software (GraphPad Software, Inc., San Diego, CA).
Supplementary Material
All Western blots performed in independent experiments and used for densitometry and calculations are provided as source data file.
Time-lapse brightfield microscopy of UT-SCC38 tumoroid invasion into 3D fibrillar collagen I in the presence of DMSO (solvent) or DMOG to pharmacologically stabilize HIF. Time (h : min). Field size 416 × 312 µm.
Time-lapse brightfield microscopy of 4T1 tumoroid invasion into 3D fibrillar collagen I. Arrowheads, initial and resulting subtype. Time (min). Field size 278 × 165 µm.
Time-lapse brightfield microscopy of 4T1 tumoroid invasion into 3D fibrillar collagen I in the presence of DMOG with β1-integrin activating mAb (clone 9EG7) or with IgG control. Time (h : min). Field size 416 × 312 µm.
Time-lapse multiphoton microscopy of 4T1 tumoroid invasion into 3D collagen invasion culture starting 48h after HIF stabilization with DMOG (1mM) and after incubation with calpain sensor CMAC (20 μM, 1 hr). Time (h : min). Field size 243 × 338 µm.
Time-lapse brightfield microscopy of 4T1 tumoroid invasion into 3D collagen invasion culture in the presence of DMSO+water (solvent), oligomycin, 2-Deoxy-D-glucose, and oligomycin and 2-Deoxy-D-glucose in combination. Time (h : min). Field size 1000 × 753 µm.
Highlights.
Hypoxia/HIF-signaling converts collective invasion to blebbing-amoeboid migration
Calpain-2 cleaves talin-1, inactivates β1 integrins and induces amoeboid conversion
Amoeboid movement occurs with reduced oxidative metabolism and glycolysis
Calpain-2 inhibition prevents amoeboid transition and HIF-induced metastasis
Acknowledgements
We gratefully acknowledge Dr. Jeffrey N. Myers, Department of Head and Neck Surgery, MD Anderson Cancer Center for generous supply with samples from HN-31 and Detroit256 HNSCC tumor xenografts. We also gratefully thank Manon Vullings and Dr. Gert-Jan Bakker, Department of Cell Biology, Radboud Institute of Molecular Life Sciences, for help with 3D tumoroid culture and multiphoton imaging of calpain activity of invasive tumoroids, Miranda van Triest, University Medical Center Utrecht, for help with metabolic analyses of inhibitory 2-Deoxy-D-Glucose effects, and Dr. Bettina Weigelin, Department of Genitourinary Medical Oncology, MD Anderson Cancer Center for help with intradermal injections of UT-SCC38 and UT-SCC58 cell lines. This work was supported by the European Research Council (617430-DEEPINSIGHT), NWO-Science-XL 2019.022, NIH-U54 CA210184–01 to PF. PF and BMTB were further supported by the Cancer Genomics Center. VtB was supported by the Rosalie B. Hite Fellowship for Cancer Research. MM was supported by the Boehringer Ingelheim Fonds. Immunohistochemistry analyses were provided by the Tissue Biospecimen & Pathology Resource Core, supported by the NIH/NCI CCSG grant (5P30CA016672).
Footnotes
Declaration of Interests
The authors declare no conflict of interest.
Publisher's Disclaimer: This is a PDF file of an unedited manuscript that has been accepted for publication. As a service to our customers we are providing this early version of the manuscript. The manuscript will undergo copyediting, typesetting, and review of the resulting proof before it is published in its final form. Please note that during the production process errors may be discovered which could affect the content, and all legal disclaimers that apply to the journal pertain.
REFERENCES
- 1.Sahai E (2007). Illuminating the metastatic process. Nat. Rev. Cancer 7, 737–49. [DOI] [PubMed] [Google Scholar]
- 2.Cheung KJ, Padmanaban V, Silvestri V, Schipper K, Cohen JD, Fairchild AN, Gorin MA, Verdone JE, Pienta KJ, Bader JS, et al. (2016). Polyclonal breast cancer metastases arise from collective dissemination of keratin 14-expressing tumor cell clusters. Proc. Natl. Acad. Sci. 113, 201508541. [DOI] [PMC free article] [PubMed] [Google Scholar]
- 3.Friedl P, and Alexander S (2011). Cancer invasion and the microenvironment: plasticity and reciprocity. Cell 147, 992–1009. [DOI] [PubMed] [Google Scholar]
- 4.te Boekhorst V, Preziosi L, and Friedl P (2016). Plasticity of Cell Migration In Vivo and In Silico. Annu. Rev. Cell Dev. Biol. 32, 491–526. [DOI] [PubMed] [Google Scholar]
- 5.Friedl P, and Wolf K (2009). Proteolytic interstitial cell migration: a five-step process. Cancer Metastasis Rev. 28, 129–35. [DOI] [PubMed] [Google Scholar]
- 6.Paluch EK, Aspalter IM, and Sixt M (2016). Focal Adhesion–Independent Cell Migration. Annu. Rev. Cell Dev. Biol. 32, 469–490. [DOI] [PubMed] [Google Scholar]
- 7.Lämmermann T, Bader BL, Monkley SJ, Worbs T, Wedlich-Söldner R, Hirsch K, Keller M, Förster R, Critchley DR, Fässler R, et al. (2008). Rapid leukocyte migration by integrin- independent flowing and squeezing. Nature 453, 51–55. [DOI] [PubMed] [Google Scholar]
- 8.Yoshida K, Izumi M, Kashiwagi H, Hayashi M, Read P, Barrett M, Gibson J, Burnitz M, Myers C, Somlyo A, et al. (2006). Dissection of amoeboid movement into two mechanically distinct modes. J. Cell Sci. 119, 3833–3844. [DOI] [PubMed] [Google Scholar]
- 9.Charras GT (2008). A short history of blebbing. J. Microsc. 231, 466–78. [DOI] [PubMed] [Google Scholar]
- 10.Sahai E, and Marshall CJ (2003). Differing modes of tumour cell invasion have distinct requirements for Rho/ROCK signalling and extracellular proteolysis. Nat. Cell Biol. 5, 711–9. [DOI] [PubMed] [Google Scholar]
- 11.Wolf K, Mazo I, Leung H, Engelke K, von Andrian UH, Deryugina EI, Strongin AY, Bröcker E-B, and Friedl P (2003). Compensation mechanism in tumor cell migration: mesenchymal-amoeboid transition after blocking of pericellular proteolysis. J. Cell Biol. 160, 267–77. [DOI] [PMC free article] [PubMed] [Google Scholar]
- 12.Wolf K, Te Lindert M, Krause M, Alexander S, Te Riet J, Willis AL, Hoffman RM, Figdor CG, Weiss SJ, and Friedl P (2013). Physical limits of cell migration: control by ECM space and nuclear deformation and tuning by proteolysis and traction force. J. Cell Biol. 201, 1069–84. [DOI] [PMC free article] [PubMed] [Google Scholar]
- 13.Sanz-Moreno V, Gadea G, Ahn J, Paterson H, Marra P, Pinner S, Sahai E, and Marshall CJ (2008). Rac activation and inactivation control plasticity of tumor cell movement. Cell 135, 510–23. [DOI] [PubMed] [Google Scholar]
- 14.Zaman MH, Trapani LM, Sieminski AL, Siemeski A, Mackellar D, Gong H, Kamm RD, Wells A, Lauffenburger DA, and Matsudaira P (2006). Migration of tumor cells in 3D matrices is governed by matrix stiffness along with cell-matrix adhesion and proteolysis. Proc. Natl. Acad. Sci. U. S. A. 103, 10889–94. [DOI] [PMC free article] [PubMed] [Google Scholar]
- 15.Hegerfeldt Y, Tusch M, Bröcker E-B, and Friedl P (2002). Collective cell movement in primary melanoma explants: plasticity of cell-cell interaction, beta1-integrin function, and migration strategies. Cancer Res. 62, 2125–30. [PubMed] [Google Scholar]
- 16.Clark AG, and Vignjevic DM (2015). Modes of cancer cell invasion and the role of the microenvironment. Curr. Opin. Cell Biol. 36, 13–22. [DOI] [PubMed] [Google Scholar]
- 17.Krishnamachary B, Zagzag D, Nagasawa H, Rainey K, Okuyama H, Baek JH, and Semenza GL (2006). Hypoxia-Inducible Factor-1-Dependent Repression of E-cadherin in von Hippel-Lindau Tumor Suppressor-Null Renal Cell Carcinoma Mediated by TCF3, ZFHX1A, and ZFHX1B. Cancer Res. 66, 2725–2731. [DOI] [PubMed] [Google Scholar]
- 18.McKeown SR (2014). Defining normoxia, physoxia and hypoxia in tumours—implications for treatment response. Br. J. Radiol. 87, 20130676. [DOI] [PMC free article] [PubMed] [Google Scholar]
- 19.Yang M-H, Wu M-Z, Chiou S-H, Chen P-M, Chang S-Y, Liu C-J, Teng S-C, and Wu K-J (2008). Direct regulation of TWIST by HIF-1α promotes metastasis. Nat. Cell Biol. 10, 295–305. [DOI] [PubMed] [Google Scholar]
- 20.Semenza GL (2012). Hypoxia-inducible factors: Mediators of cancer progression and targets for cancer therapy. Trends Pharmacol. Sci. 33, 207–214. [DOI] [PMC free article] [PubMed] [Google Scholar]
- 21.Lehmann S, te Boekhorst V, Odenthal J, Bianchi R, van Helvert S, Ikenberg K, Ilina O, Stoma S, Xandry J, Jiang L, et al. (2017). Hypoxia Induces a HIF-1-Dependent Transition from Collective-to-Amoeboid Dissemination in Epithelial Cancer Cells. Curr. Biol. 27, 392–400. [DOI] [PubMed] [Google Scholar]
- 22.Lehmann S, Stiehl DP, Honer M, Dominietto M, Keist R, Kotevic I, Wollenick K, Ametamey S, Wenger RH, and Rudin M (2009). Longitudinal and multimodal in vivo imaging of tumor hypoxia and its downstream molecular events. Proc. Natl. Acad. Sci. U. S. A. 106, 14004–9. [DOI] [PMC free article] [PubMed] [Google Scholar]
- 23.Büchler P, Reber HA, Lavey RS, Tomlinson J, Büchler MW, Friess H, and Hines OJ (2004). Tumor hypoxia correlates with metastatic tumor growth of pancreatic cancer in an orthotopic murine model1. J. Surg. Res. 120, 295–303. [DOI] [PubMed] [Google Scholar]
- 24.Buffa FM, Harris AL, West CM, and Miller CJ (2010). Large meta-analysis of multiple cancers reveals a common, compact and highly prognostic hypoxia metagene. Br. J. Cancer 102, 428–435. [DOI] [PMC free article] [PubMed] [Google Scholar]
- 25.Ye IC, Fertig EJ, DiGiacomo JW, Considine M, Godet I, and Gilkes DM (2018). Molecular Portrait of Hypoxia in Breast Cancer: A Prognostic Signature and Novel HIF-Regulated Genes. Mol. Cancer Res. 16, 1889–1901. [DOI] [PMC free article] [PubMed] [Google Scholar]
- 26.Bhandari V, Hoey C, Liu LY, Lalonde E, Ray J, Livingstone J, Lesurf R, Shiah Y-J, Vujcic T, Huang X, et al. (2019). Molecular landmarks of tumor hypoxia across cancer types. Nat. Genet. 51, 308–318. [DOI] [PubMed] [Google Scholar]
- 27.Elvidge GP, Glenny L, Appelhoff RJ, Ratcliffe PJ, Ragoussis J, and Gleadle JM (2006). Concordant regulation of gene expression by hypoxia and 2-oxoglutarate-dependent dioxygenase inhibition: the role of HIF-1alpha, HIF-2alpha, and other pathways. J. Biol. Chem. 281, 15215–26. [DOI] [PubMed] [Google Scholar]
- 28.Sanz-Moreno V, Gaggioli C, Yeo M, Albrengues J, Wallberg F, Viros A, Hooper S, Mitter R, Féral CC, Cook M, et al. (2011). ROCK and JAK1 Signaling Cooperate to Control Actomyosin Contractility in Tumor Cells and Stroma. Cancer Cell 20, 229–245. [DOI] [PubMed] [Google Scholar]
- 29.Schmidt JM, Panzilius E, Bartsch HS, Irmler M, Beckers J, Kari V, Linnemann JR, Dragoi D, Hirschi B, Kloos UJ, et al. (2015). Stem-Cell-like Properties and Epithelial Plasticity Arise as Stable Traits after Transient Twist1 Activation. Cell Rep. 10, 131–139. [DOI] [PubMed] [Google Scholar]
- 30.Dongre A, and Weinberg RA (2019). New insights into the mechanisms of epithelial–mesenchymal transition and implications for cancer. Nat. Rev. Mol. Cell Biol. 20, 69–84. [DOI] [PubMed] [Google Scholar]
- 31.Bergert M, Erzberger A, Desai RA, Aspalter IM, Oates AC, Charras G, Salbreux G, and Paluch EK (2015). Force transmission during adhesion-independent migration. Nat. Cell Biol. 17, 524–529. [DOI] [PMC free article] [PubMed] [Google Scholar]
- 32.Sahai E, and Marshall CJ (2003). Differing modes of tumour cell invasion have distinct requirements for Rho/ROCK signalling and extracellular proteolysis. Nat. Cell Biol. 5, 711–9. [DOI] [PubMed] [Google Scholar]
- 33.Shao D, Levine H, and Rappel W-J (2012). Coupling actin flow, adhesion, and morphology in a computational cell motility model. Proc. Natl. Acad. Sci. 109, 6851–6856. [DOI] [PMC free article] [PubMed] [Google Scholar]
- 34.Camley BA, and Rappel W-J (2017). Physical models of collective cell motility: from cell to tissue. J. Phys. D. Appl. Phys. 50. [DOI] [PMC free article] [PubMed] [Google Scholar]
- 35.Campbell ID, and Humphries MJ (2011). Integrin structure, activation, and interactions. Cold Spring Harb. Perspect. Biol. 3, a004994. [DOI] [PMC free article] [PubMed] [Google Scholar]
- 36.Friedl P, Entschladen F, Conrad C, Niggemann B, and Zänker KS (1998). CD4+ T lymphocytes migrating in three-dimensional collagen lattices lack focal adhesions and utilize beta1 integrin-independent strategies for polarization, interaction with collagen fibers and locomotion. Eur. J. Immunol. 28, 2331–43. [DOI] [PubMed] [Google Scholar]
- 37.Arregui CO, Balsamo J, and Lilien J (1998). Impaired Integrin-mediated Adhesion and Signaling in Fibroblasts Expressing a Dominant-negative Mutant PTP1B. J. Cell Biol. 143, 861–873. [DOI] [PMC free article] [PubMed] [Google Scholar]
- 38.Franco SJ, and Huttenlocher A (2005). Regulating cell migration: calpains make the cut. J. Cell Sci. 118, 3829–38. [DOI] [PubMed] [Google Scholar]
- 39.Franco SJ, Rodgers MA, Perrin BJ, Han J, Bennin DA, Critchley DR, and Huttenlocher A (2004). Calpain-mediated proteolysis of talin regulates adhesion dynamics. Nat. Cell Biol. 6, 977–983. [DOI] [PubMed] [Google Scholar]
- 40.Storr SJ, Carragher NO, Frame MC, Parr T, and Martin SG (2011). The calpain system and cancer. Nat. Rev. Cancer 11, 364–374. [DOI] [PubMed] [Google Scholar]
- 41.Storr SJ, Thompson N, Pu X, Zhang Y, and Martin SG (2015). Calpain in Breast Cancer: Role in Disease Progression and Treatment Response. Pathobiology 82, 133–141. [DOI] [PubMed] [Google Scholar]
- 42.Zhang S, Deen S, Storr SJ, Chondrou PS, Nicholls H, Yao A, Rungsakaolert P, and Martin SG (2019). Calpain system protein expression and activity in ovarian cancer. J. Cancer Res. Clin. Oncol. 145, 345–361. [DOI] [PMC free article] [PubMed] [Google Scholar]
- 43.Gao X, Mao Y-H, Xiao C, Li K, Liu W, Li L-Y, and Pang J (2018). Calpain-2 triggers prostate cancer metastasis via enhancing CRMP4 promoter methylation through NF-κB/DNMT1 signaling pathway. Prostate 78, 682–690. [DOI] [PubMed] [Google Scholar]
- 44.Lakshmikuttyamma A, Selvakumar P, Kanthan R, Kanthan SC, and Sharma RK (2004). Overexpression of m-calpain in human colorectal adenocarcinomas. Cancer Epidemiol. Biomarkers Prev. 13, 1604–9. [PubMed] [Google Scholar]
- 45.Leloup L, and Wells A (2011). Calpains as potential anti-cancer targets. Expert Opin. Ther. Targets 15, 309–23. [DOI] [PMC free article] [PubMed] [Google Scholar]
- 46.Spirina LV, Kondakova IV, Choynzonov EL, Chigevskaya SY, Shishkin DA, and Kulbakin DY (2013). Expression of vascular endothelial growth factor and transcription factors HIF-1, NF-kB expression in squamous cell carcinoma of head and neck; association with proteasome and calpain activities. J. Cancer Res. Clin. Oncol. 139, 625–33. [DOI] [PMC free article] [PubMed] [Google Scholar]
- 47.Storr SJ, Lee KW, Woolston CM, Safuan S, Green AR, Macmillan RD, Benhasouna A, Parr T, Ellis IO, and Martin SG (2012). Calpain system protein expression in basal-like and triple-negative invasive breast cancer. Ann. Oncol. 23, 2289–96. [DOI] [PMC free article] [PubMed] [Google Scholar]
- 48.Klapholz B, and Brown NH (2017). Talin – the master of integrin adhesions. J. Cell Sci. 130, 2435–2446. [DOI] [PubMed] [Google Scholar]
- 49.Critchley DR, and Gingras AR (2008). Talin at a glance. J. Cell Sci. 121, 1345–7. [DOI] [PubMed] [Google Scholar]
- 50.Zhang J, Goliwas KF, Wang W, Taufalele PV, Bordeleau F, and Reinhart-King CA (2019). Energetic regulation of coordinated leader–follower dynamics during collective invasion of breast cancer cells. Proc. Natl. Acad. Sci. 116, 7867–7872. [DOI] [PMC free article] [PubMed] [Google Scholar]
- 51.Zanotelli MR, Rahman-Zaman A, VanderBurgh JA, Taufalele PV, Jain A, Erickson D, Bordeleau F, and Reinhart-King CA (2019). Energetic costs regulated by cell mechanics and confinement are predictive of migration path during decision-making. Nat. Commun. 10, 4185. [DOI] [PMC free article] [PubMed] [Google Scholar]
- 52.SJ D, VMK T, J F, SA K, JT G, D R, MH Z, ST W, A K, M DM, et al. (2020). Epithelial layer unjamming shifts energy metabolism toward glycolysis. Sci. Rep. 10. [DOI] [PMC free article] [PubMed] [Google Scholar]
- 53.Eales KL, Hollinshead KER, and Tennant DA (2016). Hypoxia and metabolic adaptation of cancer cells. Oncogenesis 5, e190–e190. [DOI] [PMC free article] [PubMed] [Google Scholar]
- 54.Zheng J (2012). Energy metabolism of cancer: Glycolysis versus oxidative phosphorylation (Review). Oncol. Lett. 4, 1151–1157. [DOI] [PMC free article] [PubMed] [Google Scholar]
- 55.B S, XL S, A A, CM S, H L, and J M. (2016). Addiction to Coupling of the Warburg Effect with Glutamine Catabolism in Cancer Cells. Cell Rep. 17, 821–836. [DOI] [PMC free article] [PubMed] [Google Scholar]
- 56.Jia D, Lu M, Jung KH, Park JH, Yu L, Onuchic JN, Kaipparettu BA, and Levine H (2019). Elucidating cancer metabolic plasticity by coupling gene regulation with metabolic pathways. Proc. Natl. Acad. Sci. U. S. A. 116, 3909–3918. [DOI] [PMC free article] [PubMed] [Google Scholar]
- 57.Jose C, and Bellance N (2011). Choosing between glycolysis and oxidative phosphorylation: A tumor’s dilemma? Biochim. Biophys. Acta - Bioenerg. 1807, 552–561. [DOI] [PubMed] [Google Scholar]
- 58.Kamphorst JJ, Cross JR, Fan J, de Stanchina E, Mathew R, White EP, Thompson CB, and Rabinowitz JD (2013). Hypoxic and Ras-transformed cells support growth by scavenging unsaturated fatty acids from lysophospholipids. Proc. Natl. Acad. Sci. 110, 8882–8887. [DOI] [PMC free article] [PubMed] [Google Scholar]
- 59.Ozaki T, Yamashita T, and Ishiguro S ichi (2009). Mitochondrial m-calpain plays a role in the release of truncated apoptosis-inducing factor from the mitochondria. Biochim. Biophys. Acta - Mol. Cell Res. 1793, 1848–1859. [DOI] [PubMed] [Google Scholar]
- 60.Arrington DD, Van Vleet TR, and Schnellmann RG (2006). Calpain 10: A mitochondrial calpain and its role in calcium-induced mitochondrial dysfunction. Am. J. Physiol. - Cell Physiol. 291, 1159–1171. [DOI] [PubMed] [Google Scholar]
- 61.Khalil AA, Ilina O, Gritsenko PG, Bult P, Span PN, and Friedl P (2017). Collective invasion in ductal and lobular breast cancer associates with distant metastasis. Clin. Exp. Metastasis 34, 421–429. [DOI] [PMC free article] [PubMed] [Google Scholar]
- 62.Nobre AR, Entenberg D, Wang Y, Condeelis J, and Aguirre-Ghiso JA (2018). The Different Routes to Metastasis via Hypoxia-Regulated Programs. Trends Cell Biol. 28, 941–956. [DOI] [PMC free article] [PubMed] [Google Scholar]
- 63.Dubravcic D, van Baalen M, and Nizak C (2014). An evolutionarily significant unicellular strategy in response to starvation in Dictyostelium social amoebae. F1000Research 3, 133. [DOI] [PMC free article] [PubMed] [Google Scholar]
- 64.Goudarzi M, Banisch TU, Mobin MB, Maghelli N, Tarbashevich K, Strate I, van den Berg J, Blaser H, Bandemer S, Paluch E, et al. (2012). Identification and Regulation of a Molecular Module for Bleb-Based Cell Motility. Dev. Cell 23, 210–218. [DOI] [PubMed] [Google Scholar]
- 65.Parri M, Taddei ML, Bianchini F, Calorini L, and Chiarugi P (2009). EphA2 Reexpression Prompts Invasion of Melanoma Cells Shifting from Mesenchymal to Amoeboid-like Motility Style. Cancer Res. 69, 2072–2081. [DOI] [PubMed] [Google Scholar]
- 66.Gadea G, Sanz-Moreno V, Self A, Godi A, and Marshall CJ (2008). DOCK10-Mediated Cdc42 Activation Is Necessary for Amoeboid Invasion of Melanoma Cells. Curr. Biol. 18, 1456–1465. [DOI] [PubMed] [Google Scholar]
- 67.Cantelli G, Orgaz JL, Rodriguez-Hernandez I, Karagiannis P, Maiques O, Matias-Guiu X, Nestle FO, Marti RM, Karagiannis SN, and Sanz-Moreno V (2015). TGF-β-Induced Transcription Sustains Amoeboid Melanoma Migration and Dissemination. Curr. Biol. 25, 2899–914. [DOI] [PMC free article] [PubMed] [Google Scholar]
- 68.Liu Y-J, Le Berre M, Lautenschlaeger F, Maiuri P, Callan-Jones A, Heuzé M, Takaki T, Voituriez R, and Piel M (2015). Confinement and Low Adhesion Induce Fast Amoeboid Migration of Slow Mesenchymal Cells. Cell 160, 659–672. [DOI] [PubMed] [Google Scholar]
- 69.Sanz-Moreno V, Gadea G, Ahn J, Paterson H, Marra P, Pinner S, Sahai E, and Marshall CJ (2008). Rac activation and inactivation control plasticity of tumor cell movement. Cell 135, 510–23. [DOI] [PubMed] [Google Scholar]
- 70.Chiche J, Brahimi-Horn MC, and Pouysségur J (2010). Tumour hypoxia induces a metabolic shift causing acidosis: a common feature in cancer. J. Cell. Mol. Med. 14, 771–794. [DOI] [PMC free article] [PubMed] [Google Scholar]
- 71.Masoud GN, and Li W (2015). HIF-1α pathway: role, regulation and intervention for cancer therapy. Acta Pharm. Sin. B 5, 378–389. [DOI] [PMC free article] [PubMed] [Google Scholar]
- 72.Bernstein BW, and Bamburg JR (2003). Actin-ATP hydrolysis is a major energy drain for neurons. J. Neurosci. 23, 1–6. [DOI] [PMC free article] [PubMed] [Google Scholar]
- 73.Low KE, Karunan Partha S, Davies PL, and Campbell RL (2014). Allosteric inhibitors of calpains: Reevaluating inhibition by PD150606 and LSEAL. Biochim. Biophys. Acta - Gen. Subj. 1840, 3367–3373. [DOI] [PubMed] [Google Scholar]
- 74.Hurst S, Hoek J, and Sheu SS (2017). Mitochondrial Ca2+ and regulation of the permeability transition pore. J. Bioenerg. Biomembr. 49, 27–47. [DOI] [PMC free article] [PubMed] [Google Scholar]
- 75.Ilina O, Gritsenko PG, Syga S, Lippoldt J, La Porta CAM, Chepizhko O, Grosser S, Vullings M, Bakker GJ, Starruß J, et al. (2020). Cell–cell adhesion and 3D matrix confinement determine jamming transitions in breast cancer invasion. Nat. Cell Biol. 22, 1103–1115. [DOI] [PMC free article] [PubMed] [Google Scholar]
- 76.Friedl P, and Wolf K (2010). Plasticity of cell migration: a multiscale tuning model. J. Cell Biol. 188, 11–9. [DOI] [PMC free article] [PubMed] [Google Scholar]
- 77.Cui W, Zhou J, Dehne N, and Brüne B (2015). Hypoxia induces calpain activity and degrades SMAD2 to attenuate TGFβ signaling in macrophages. Cell Biosci. 5, 36. [DOI] [PMC free article] [PubMed] [Google Scholar]
- 78.Edelstein CL, Yaqoob MM, Alkhunaizi AM, Gengaro PE, Nemenoff RA, Wang KKW, and Schrier RW (1996). Modulation of hypoxia-induced calpain activity in rat renal proximal tubules. Kidney Int. 50, 1150–1157. [DOI] [PubMed] [Google Scholar]
- 79.Zheng X, Zhou A-X, Rouhi P, Uramoto H, Borén J, Cao Y, Pereira T, Akyürek LM, and Poellinger L (2014). Hypoxia-induced and calpain-dependent cleavage of filamin A regulates the hypoxic response. Proc. Natl. Acad. Sci. U. S. A. 111, 2560–5. [DOI] [PMC free article] [PubMed] [Google Scholar]
- 80.Pulaski BA, Ostrand-Rosenberg S, Pulaski BA, and Ostrand‐Rosenberg S (2001). Mouse 4T1 Breast Tumor Model. In Current Protocols in Immunology (John Wiley & Sons, Inc.), pp. 20.2.1–20.2.16. [DOI] [PubMed] [Google Scholar]
- 81.Lansford CD, Grenman R, Bier H, Somers KD, Kim SY, Whiteside TL, Clayman GL, Welkoborsky H-J, and Carey TE (1999). Head and Neck Cancers. In Human Cell Culture (Kluwer Academic Publishers; ), pp. 185–255. [Google Scholar]
- 82.Zhou G, Wang J, Zhao M, Xie T-X, Tanaka N, Sano D, Patel AA, Ward AM, Sandulache VC, Jasser SA, et al. (2014). Gain-of-function mutant p53 promotes cell growth and cancer cell metabolism via inhibition of AMPK activation. Mol. Cell 54, 960–74. [DOI] [PMC free article] [PubMed] [Google Scholar]
- 83.Korff T, and Augustin HG (1998). Integration of Endothelial Cells in Multicellular Spheroids Prevents Apoptosis and Induces Differentiation. J. Cell Biol. 143. [DOI] [PMC free article] [PubMed] [Google Scholar]
- 84.Myers JN, Holsinger FC, Jasser SA, Bekele BN, and Fidler IJ (2002). An Orthotopic Nude Mouse Model of Oral Tongue Squamous Cell Carcinoma. Clin. Cancer Res. 8. [PubMed] [Google Scholar]
Associated Data
This section collects any data citations, data availability statements, or supplementary materials included in this article.
Supplementary Materials
All Western blots performed in independent experiments and used for densitometry and calculations are provided as source data file.
Time-lapse brightfield microscopy of UT-SCC38 tumoroid invasion into 3D fibrillar collagen I in the presence of DMSO (solvent) or DMOG to pharmacologically stabilize HIF. Time (h : min). Field size 416 × 312 µm.
Time-lapse brightfield microscopy of 4T1 tumoroid invasion into 3D fibrillar collagen I. Arrowheads, initial and resulting subtype. Time (min). Field size 278 × 165 µm.
Time-lapse brightfield microscopy of 4T1 tumoroid invasion into 3D fibrillar collagen I in the presence of DMOG with β1-integrin activating mAb (clone 9EG7) or with IgG control. Time (h : min). Field size 416 × 312 µm.
Time-lapse multiphoton microscopy of 4T1 tumoroid invasion into 3D collagen invasion culture starting 48h after HIF stabilization with DMOG (1mM) and after incubation with calpain sensor CMAC (20 μM, 1 hr). Time (h : min). Field size 243 × 338 µm.
Time-lapse brightfield microscopy of 4T1 tumoroid invasion into 3D collagen invasion culture in the presence of DMSO+water (solvent), oligomycin, 2-Deoxy-D-glucose, and oligomycin and 2-Deoxy-D-glucose in combination. Time (h : min). Field size 1000 × 753 µm.
Data Availability Statement
Western blot source data for all independent experiments used for quantification are published with this manuscript as Data S1. All other data reported in this paper will be shared by the lead contact upon request.
All original code has been deposited at Github (https://github.com/yanjun07/phaseField) and is publicly available as of the date of publication. DOIs are listed in the key resources table.
Any additional information required to reanalyze the data reported in this paper is available from the lead contact upon request.
KEY RESOURCES TABLE
| REAGENT or RESOURCE | SOURCE | IDENTIFIER |
|---|---|---|
| Antibodies | ||
| rabbit polyclonal anti-HIF1α | Novus Biologicals | Cat#NB100-479 |
| rabbit polyclonal anti–calpain-2 large subunit | Cell Signaling | Cat#2539 |
| chicken polyclonal anti-β-actin | Abcam | Cat#13822 |
| rabbit polyclonal anti-β-actin | Cell Signaling | Cat#4967 |
| rabbit polyclonal anti–talin-1 | Sigma Aldrich | Cat#T3287, Clone8d4 |
| rabbit monoclonal anti-mouse CD29 | Millipore / Abcam | Cat#04-1109, clone EP1041Y / ab179471, clone 1A27 |
| mouse monoclonal anti-CD29 | Merck Millipore | Cat#MAB2079Z, clone HUTS-4 |
| mouse monoclonal anti-CD29 | Beckman Coulter | Cat#6603113, clone 4B4 |
| rat monoclonal anti-CD29 | BD Biosciences | Cat#553715, clone 9EG7 |
| rat IgG2a | BD Biosciences | Cat#553927, clone R5-95 |
| armenian hamster monoclonal anti-CD29 (FITC-conjugated) | BioLegend | Cat#102206, clone HMβ1-1 |
| armenian hamster IgG (FITC-conjugated) | BioLegend | Cat#400906, clone HTK888 |
| rabbit monoclonal anti-cleaved caspase-3 | Cell Signaling | Cat#9664 |
| mouse anti-CD29 | BioLegend | Cat#303010, cloneTS2/16 |
| goat anti-rabbit (conjugated to horseradish peroxidase) | Jackson | Cat#211-032-171 |
| goat anti-mouse (conjugated to horseradish peroxidase) | Jackson | Cat#115-0450174 |
| goat anti-chicken (conjugated to horseradish peroxidase) | Jackson | Cat#103-035-155 |
| rabbit-on-rodent HRP-polymer | Biocare Medical | Cat#RMR622 |
| goat anti-rat IgG AF488 | Thermo Fisher Scientific | Cat#A21247 |
| goat anti-rabbit IgG AF633 | Thermo Fisher Scientific | Cat#A21071 |
| IRDye® 680RD Goat anti-Mouse IgG Secondary Antibody | Licor | 926-68070 |
| IRDye® 680RD Goat anti-Rabbit IgG Secondary Antibody | Licor | 926-68071 |
| Goat anti-Rat IgG Secondary Antibody Alexa Fluor 680 | Thermo Fisher Scientific | Cat#A21096 |
| Biological samples | ||
| Human HN-31 tumor xenograft | Jeffrey Myers Laboratory, MD Anderson Cancer Center | N/A |
| Human Detroit-261 tumor xenograft | Jeffrey Myers Laboratory, MD Anderson Cancer Center | N/A |
| Chemicals, peptides, and recombinant proteins | ||
| Dimethyl oxalylglycine (DMOG) | Cayman Chemical | 71210-100 |
| PD150606 | Cayman Chemical / Sigma Aldrich | 13859, CAS: 179528-45-1 / D5946 |
| Etoposide | Sigma Aldrich | E1383, CAS: 33419-42-0 |
| Oligomycin A | Selleckchem | S1478 |
| 2-Deoxy-D-glucose | Sigma Aldrich | D8375, CAS: 154-17-6 |
| Carbonyl cyanide-4-(trifluoromethoxy)phenylhydrazone (FCCP) | Sigma Aldrich | C2920-10MG |
| Rotenone | Sigma Aldrich | R8875, CAS: 83-79-4 |
| Antimycin-a | Sigma Aldrich | A8674, CAS: 1397-94-0 |
| Tetraethylbenzimidazolylcarbocyanine iodide (JC-1) | Sigma Aldrich / Enzo LifeSciences | T4069-5MG / ENZ-52304 |
| t-BOC-L-leucyl-L-methionine amide (CMAC) | Thermo Fischer Scientific | A6520 |
| Methyl cellulose | Sigma Aldrich | M6385 |
| Collagen I, High Concentration, Rat Tail, 100mg |
Corning | Cat#354249 |
| Bovine Type I Atelo-Collagen Solution, 3 mg/ml |
Advanced Biomatrix | Cat#5005-100ML |
| LIVE/DEAD fixable stain | Thermo Fisher Scientific | Cat#L34976 |
| MISSION siRNA transfection reagent | Sigma Aldrich | S1452 |
| OptiMEM | Thermo Fisher Scientific | Cat# 31985062 |
| Lipofectamine 2000 | Thermo Fisher Scientific | Cat# 11668019 |
| Rodent Decloaker | Biocare Medical | SKU: RD913 |
| Sodium oxamate | Sigma Aldrich | CAS: 565-73-1 |
| Protease inhibitor cocktail | Roche | 926-68071 |
| Novex™ 4–20% Tris-Glycine Mini Gels | Thermo Fisher Scientific | XP04200BOX |
| cOmplete ULTRA Tablets (Protease inhibitor cocktail) |
Roche | 05892791001 |
| PhosSTOP | Sigma Aldrich | PHOSS-RO |
| Immobilon-PSQ Membrane, PVDF | Merck Millipore | Cat#ISEQ85R |
| Bradford Reagent | Sigma Aldrich | B6916 |
| Phalloidin | Thermo Fisher Scientific | A22283 |
| DAPI | Thermo Fisher Scientific | D21490 |
| Critical commercial assays | ||
| Lactate Colorimetric/Fluorometric Assay Kit | BioVision | K607 |
| Experimental models: Cell lines | ||
| Mouse breast carcinoma: 4T1 cells | ATCC | CRL-2539; STR with matching profile; no interspecies cross contamination |
| Human head and neck squamous carcinoma: UT-SCC38 cells | Turku University and Turku University Hospital, 20521 Turku, Finland | STR with unique profile; no interspecies cross contamination |
| Human head and neck squamous carcinoma: UT-SCC58 cells | Obtained from Raider Grenman, University of Turku, Finland | STR with unique profile; no interspecies cross contamination |
| Human head and neck squamous carcinoma: UT-SCC38 Lifeact-GFP cells | Friedl Laboratory | N/A |
| Human head and neck squamous carcinoma: UT-SCC58 Lifeact-GFP cells | Friedl Laboratory | N/A |
| Human head and neck squamous carcinoma: Detroit 562 cells | ATCC | CCL-138 |
| Human head and neck squamous carcinoma: HN-31 cells | Provided by Dr. John Ensley, Wane State University, Detroit, MI | N/A |
| Experimental models: Organisms/strains | ||
| Swiss nu/nu nudes | MD Anderson Housing and Breeding Center in the Experimental Radiation Oncology Department, MD Anderson Cancer Center | N/A |
| Athymic nude | ENVIGO | 069 |
| Oligonucleotides | ||
| MISSION siRNA targeting mouse CAPN2 (siRNA ID-#1): SASI_Mm01_00183464, sequence start 1243 | Sigma Aldrich | Cat#NM_009794 |
| MISSION siRNA targeting mouse CAPN2 (siRNA ID-#2): SASI_Mm01_00183465, sequence start 1820, | Sigma Aldrich | Cat#NM_009794 |
| MISSION siRNA targeting mouse CAPN2 (siRNA ID-#3): SASI_Mm01_00183467, sequence start 2132 | Sigma Aldrich | Cat#NM_009794 |
| MISSION siRNA targeting human CAPN2 (siRNA ID-#1): SASI_Hs01_00059357, Sequence start 1053, | Sigma Aldrich | Cat#NM_001748 |
| MISSION siRNA targeting human CAPN2 (siRNA ID-#2): SASI_Hs01_00059364, Sequence start 810 | Sigma Aldrich | Cat#NM_001748 |
| MISSION siRNA targeting human CAPN2 (siRNA ID-#3): SASI_Hs01_00059356, Sequence start 2234 | Sigma Aldrich | Cat#NM_001748 |
| MISSION siRNA universal negative control | Sigma Aldrich | Cat#SIC001 |
| Recombinant DNA | ||
| pEGFP N1 | ClonTech | Cat#6085-1 |
| plasmid DNA construct GFP-TalinL432G | Addgene | Cat#26725 |
| Software and algorithms | ||
| Fiji | ImageJ | https://imagej.net/software/fiji/ |
| GraphPad Prism 8 | GraphPad | https://www.graphpad.com/scientific-software/prism/ |
| Autozell version 080912 | Center for Computing and Communication Technologies [TZI], University of Bremen, Germany | Proprietary code; can be obtained on specific request |
| MATLAB | MathWorks | https://www.mathworks.com/products/matlab.html. |
| Python version 3.8. | Python Software Foundation | https://www.python.org/ |
| Matplotlib Version 3.4.3. | Matplotlib package | https://matplotlib.org/. |
| Phase Field 2D Cell Motility Simulation v1.0. | Center for Theoretical Physical Biology, Rice University / Northeastern University, USA | https://github.com/yanjun07/phaseField |