

Abstract
Tissue engineering has enabled the development of advanced and physiologically relevant models of cardiovascular diseases, with advantages over conventional 2D in vitro assays. We have previously demonstrated development of a heart on-a-chip microfluidic model with mature 3D anisotropic tissue formation that incorporates both stem cell-derived cardiomyocytes and cardiac fibroblasts within a collagen-based hydrogel. Using this platform, we herein present a model of myocardial ischemia on-a-chip, that recapitulates ischemic insult through exposure of mature 3D cardiac tissues to hypoxic environments. We report extensive validation and molecular-level analyses of the model in its ability to recapitulate myocardial ischemia in response to hypoxia, demonstrating the 1) induction of tissue fibrosis through upregulation of contractile fibers, 2) dysregulation in tissue contraction through functional assessment, 3) upregulation of hypoxia-response genes and downregulation of contractile-specific genes through targeted qPCR, and 4) transcriptomic pathway regulation of hypoxic tissues. Further, we investigated the complex response of ischemic myocardial tissues to reperfusion, identifying 5) cell toxicity, 6) sustained contractile irregularities, as well as 7) re-establishment of lactate levels and 8) gene expression, in hypoxic tissues in response to ischemia reperfusion injury.
Keywords: Heart-on-a-chip, Ischemia, Cardiac, Stem cell, Engineered, Microfluidic
1. Introduction
Cardiovascular diseases (CVDs) are the leading cause of death worldwide [1,2], claiming the life of one person every 36 s in the United States [3]. During myocardial ischemia or infarction, aside from loss of cardiomyocytes (CMs) and impairment of contractile function, ventricular tachyarrhythmia can develop, a common attributor to cardiovascular-related deaths [4]. Myocardial infarction (MI) commonly results from ischemia, which is defined as inadequate blood supply due to partial or full blockages of a coronary artery, leading to tissue injury or cell death when the extent of reduction of arterial flow creates an oxygen deficit for tissue energy demand [5]. When ischemic injury causes a complete cut off of blood flow to the heart, MI ensues. MI is generally followed by post-infarct heart remodeling characterized by the formation of scar tissue in response to ischemic-death of CMs. Such remodeling, an attempt to restore cardiac output after infarction, can become pathologic, worsen cardiac function, and can lead to heart failure [6].
Drastic changes occur in myocardial tissue in response to profound ischemia including changes in tissue functionality, electrophysiological state, and metabolism. These changes are due to severe impacts on relative energy and oxygen availability which induce a complex biological and pathological cascade of events. Ischemia causes an imbalance between oxygen demand and coronary blood flow [7], resulting in abnormal metabolic state with increase in lactate production, low pH, and high intracellular Ca2+ [8]. Specifically, due to the lack of oxygen, cells cannot perform oxidative phosphorylation and thus rely on anaerobic metabolism, causing a loss of net intracellular ATP and an increase of intracellular H+. In response to the drop in pH, the Na+/H+ exchanger produces a large cellular influx of Na+ ions as it excretes the excess H+ [9]. The Na+ ions are then exchanged for Ca2+ by the plasmalemmal Na+/Ca2+ exchanger, resulting in an increase in intracellular Ca2+. ATP is necessary to maintain intracellular homeostasis of Ca2+, therefore intracellular Ca2+ remains pathologically high in ischemic conditions, due to the depletion of available ATP, resulting in detrimental effects on both cellular structure and function [10].
Due to the reduction of available ATP, glycolytic enzymes are activated, causing upregulation of glycolysis and resulting in the conversion of glucose to pyruvate [11,12]. However, pyruvate dehydrogenase activity is reduced [13], so pyruvate is converted to lactate through oxidation of NADH to NAD+ [11]. Lactate is not further metabolized in the absence in oxygen, resulting in high lactate concentrations. The upregulated levels of anaerobic glycolysis and lactate concentration produce an acidic environment, displacing calcium from its binding site on troponin [14,15] resulting in intracellular calcium mishandling and contractile abnormalities [16].
The immediate cellular changes that occur due to myocardial ischemia lead to the suppression of most genes, however a subset of genes, i.e., hypoxia-inducible genes, such as hypoxia-inducible factors (HIFs), are upregulated [17]. Particularly, HIF1 signaling activates a myriad of cascades, and causes the production of angiotensin and TGFβ1, which in turn induce differentiation of resident myocardial fibroblasts into myofibroblasts. Myofibroblasts extensively deposit extracellular matrix (ECM), resulting in the formation of scar tissue, which demarcates CMs from each other. Altogether, myocardial fibrosis and remodeling can lead to desynchronization of heart tissue affecting the syncytium of the tissue. These complex cellular cascades and pathophysiologies that occur in response to myocardial ischemia can result in arrhythmias and potentially heart failure.
After myocardial ischemia, sustained reperfusion is necessary for patient survival as it reestablishes oxygen supply to myocardial tissue. Within seconds after established reperfusion, oxidative phosphorylation returns to normal levels and accumulated metabolites from ischemia are washed out [8,18]. However, it has been found that upon restoration of blood flow, deleterious changes can occur to the cardiac tissue landscape [8,12,15,18–21]. Specifically, ischemia causes H+ to accumulate intracellularly due to anaerobic glycolysis. The restoration of reperfusion enables extracellular transport of H+ in exchange for Na+. Thus, intracellular levels of Na+ increase, which then activates 2 Na+/Ca2+ exchange and causes an influx of Ca2+. High levels of intracellular Ca2+ can lead Ca2+ overload and cell death. These dramatic intracellular changes, in addition to the disruption of mitochondrial membrane potential, lead to the formation of free reactive oxygen species (ROS), which activate pro-inflammatory pathways and result in production of TNFα, a major contributor to the death of CMs [22]. The stimulation of TNFα receptors in CMs also induces contractile dysfunction. Therefore, contractile dysregulation can remain, or worsen, after onset of reperfusion in ischemic tissues [8,18]. Altogether, although blood supply is necessarily restored during reperfusion, a cascade of events is triggered that may worsen the injury of ischemic myocardial tissue.
Current in vitro and preclinical models of human myocardial ischemia present challenges in translating human physiological conditions. 2D in vitro assays fail to recapitulate 3D tissue structures, and results from in vivo animal models often fail to translate when tested in human clinical trials [23]. Cardiovascular research has greatly expanded since the establishment and optimization of CM differentiation of human induced pluripotent stem cells (hiPSCs), which has enabled sourcing of human CMs for in vitro research [24]. However, hiPSC-CMs are notoriously immature, resembling the fetal state, more so than adult [25–27]. As fetal CMs are not sensitive to hypoxia as they rely mainly on glycolysis for their metabolism, it is pertinent to enhance the maturation state of hiPSC-CMs for physiologically relevant disease modeling [28, 29], particularly in modelling ischemic-reperfusion injury (IRI). Recent 2D models have uncovered the importance of maturation in ischemic modeling, for example, a study investigated the use of both immature and mature hiPSC-CMs to model IRI using temporal gradients in oxygen, local pH, and glucose availability [30]. This study demonstrated the inability of immature hiPSC-CMs to model the physiological response to IRI. However, CMs that were matured through culture in glucose-free media for 8 days exhibited physiological cell death in response to reperfusion. Therefore, the switch from glycolysis to oxidative phosphorylation that accompanies enhanced maturation state of CMs is pertinent to accurately model their pathological response to hypoxia [30,31].
To better represent the myocardial structure, 3D in vitro platforms have been used for disease modeling due to their ability to model complex cell- and tissue-level interactions. For example, a study incorporated hiPSC-CMs suspended in a 3D hydrogel among flexible pillars, inducing passive tension on the encapsulated cells [32]. Tissues that formed in these conditions after 3 days were immature, while tissues formed for 2 weeks were deemed as mature. IRI was simulated in these constructs through culture in low pH media with high lactate and anoxic gas for 6 h, then the constructs were supplemented with standard media to simulate reperfusion. The matured constructs responded to reperfusion with pathological cell death levels, further confirmed through increased expression of caspase-3, while the immature constructs were much less sensitive.
In order to establish the conditions for ischemia, most of the mentioned studies have incorporated low pH and/or high lactate levels, in addition to anoxia/hypoxia. While physiologically relevant, high lactate and H+ concentrations are the metabolic consequence of ischemic conditions, not necessarily the direct insult [33]. Therefore, if the concentrations are elevated before induction of hypoxia, the already high levels are likely to further increase as the cells respond to the low oxygen environment. In extended low-flow ischemia, metabolites and waste products accumulate as the duration of flow and oxygen deprivation continues, representing a dynamic environment.
In addition, many of the currently available myocardial tissue models incorporate a mono-culture of CMs. In the healthy heart, human cardiac fibroblasts (hCFs) are vital to sustain normal function, through preserving the structural integrity and responding to mechanical, electrical and biochemical stimuli [34,35]. During injury, such as myocardial ischemia, fibroblasts are essential in the cellular response; specifically, fibroblast populations expand and become the majority of cellular constituents in the infarcted area [34]. They differentiate into myofibroblasts and secrete ECM, express contractile proteins, and respond to autocrine and paracrine factors [35–39], resulting in tissue stiffening and remodeling within the heart that can prove averse to its function [34,35,39,40]. Therefore, to accurately model the molecular and cellular changes that occur during myocardial ischemia, the presence of cardiac fibroblasts is essential.
In this work, our goal was to simulate ischemia-induced cardiac injury due to extended restriction in blood flow during a myocardial infarction in a heart on-a-chip platform, to serve as a potential model for downstream biological mechanistic studies. Specifically, we utilized our recently developed novel heart on-a-chip that enables anisotropic 3D structure (Fig. 1B and C) of human cardiac tissue within a collagen-based hydrogel [41,42]. As fibroblasts are sensitive to the hypoxic environment and contribute to the pathological response of the myocardium [43], the co-cultured nature of this system (combination of CMs differentiated from hiPSCs and hCFs) reinforces the physiological relevancy of the platform for disease modeling. To replicate native myocardial conditions during an ischemic insult, we exposed matured cardiac tissues within the microfluidic devices to various environmental oxygen conditions (Fig. 1A). Previous studies used traditional cell culture oxygen levels to model “physioxia”, however atmospheric level of oxygen is 21%, while normal oxygen levels in the myocardium are around 5–10% [44]. Therefore, in this study, we designated a hyperoxia condition, in which tissues are exposed to normal cell culture levels, i.e., 21% O2, in addition to a physioxia condition in which tissues were exposed to 5% O2. Hypoxia was defined as 1% O2. To better represent the myocardial environment in ischemia, we exposed cardiac on-a-chip tissues to these different oxygen environments for 24 h, a duration sufficient to evaluate the early effects of myocardial ischemia [45], and without media wash out, to simulate accumulation of metabolites for dynamic change of pH and accumulation of lactate. The resultant tissues were analyzed for differential gene expression, fibrotic response, contractile function, and lactate secretion to characterize the effect of hypoxia within the heart on-a-chip. Further mechanistic biological studies were performed through RNA-sequencing of the mRNA transcriptome to highlight differentially regulated pathways implicated in ischemic injury. In addition, the cardiac on-a-chip tissues were exposed to either acute (i.e., 1 h) or chronic (i.e., 24 h) of reperfusion to simulate IRI and resultant tissue viability was assessed. The effect of sustained reperfusion was extensively analyzed for differential gene expression, contractile function, and lactate secretion. In light of the reported findings, we demonstrate our developed heart on-a-chip as a suitable platform for modeling the pathophysiology of cardiac tissue immediately after ischemia as well as after IRI and demonstrate it’s potential for other disease modeling applications.
Fig. 1.
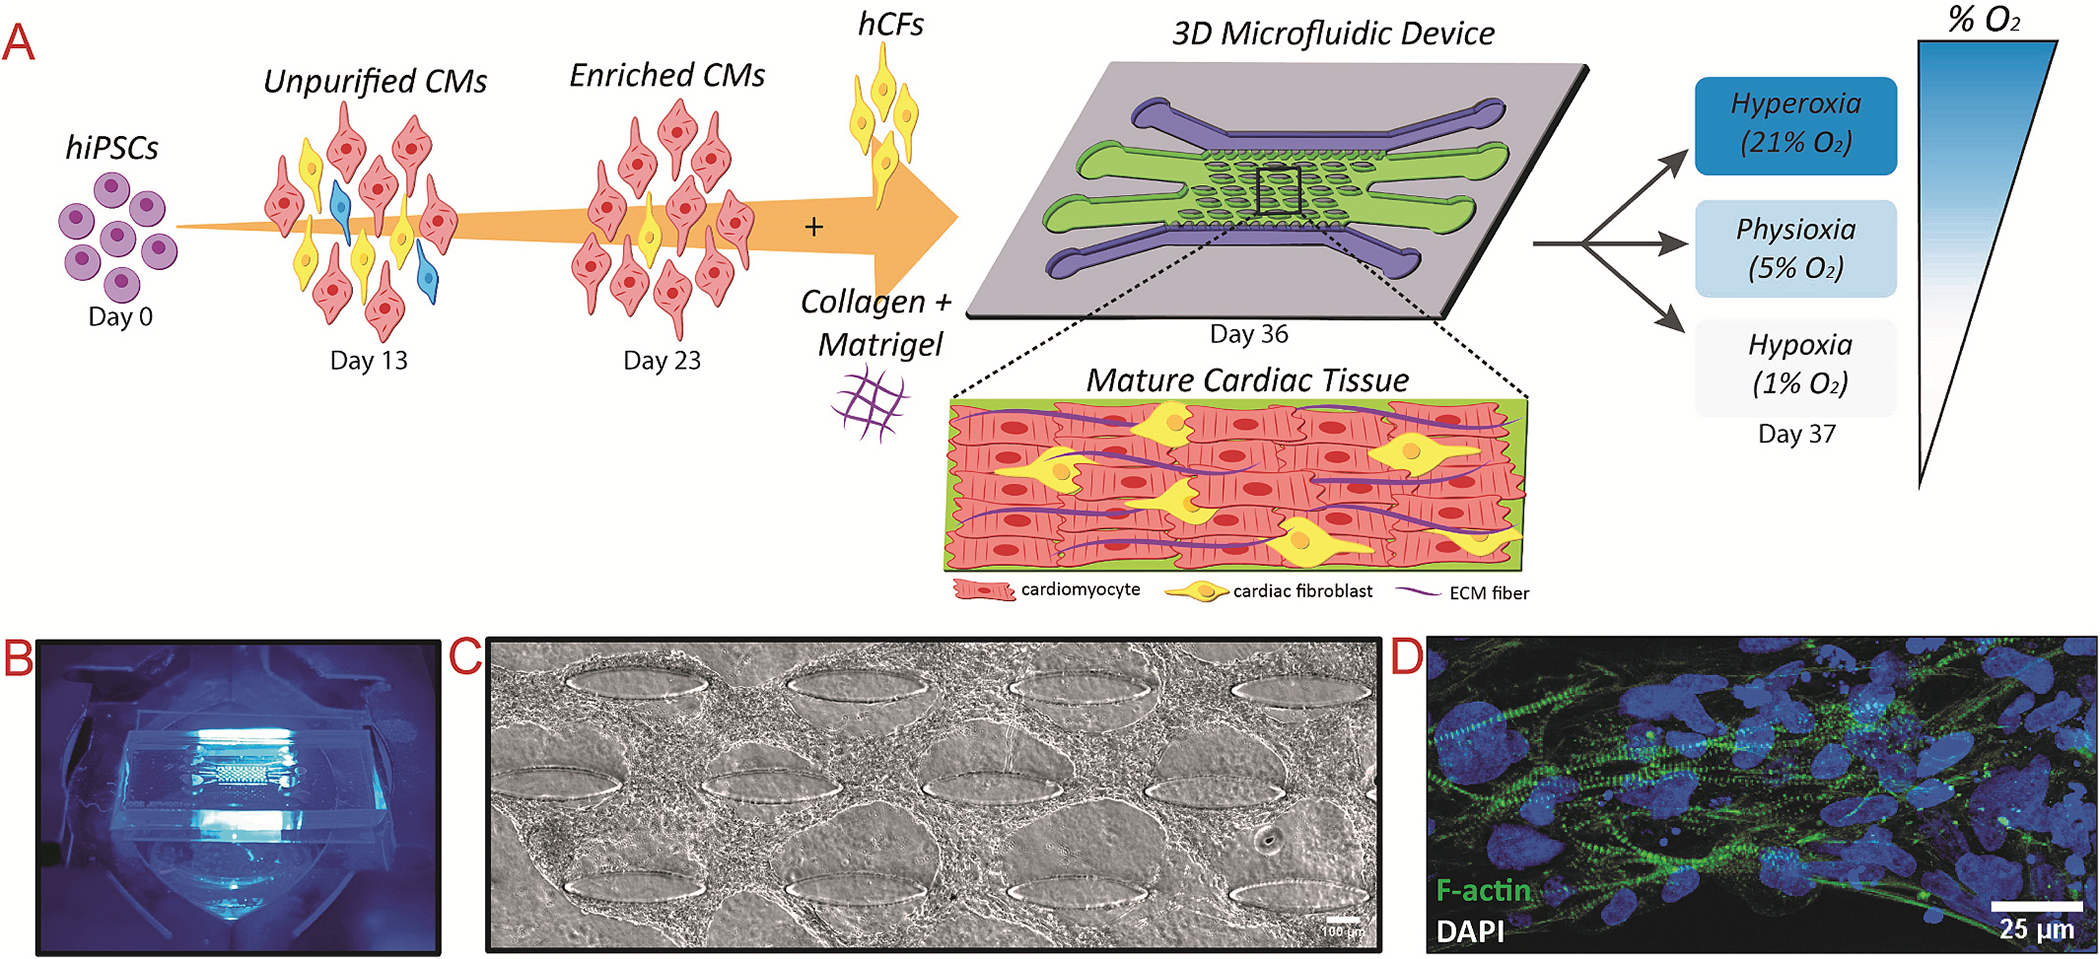
Experimental schematic of modeling myocardial ischemia within microfluidic device platform and formation of aligned cardiac tissue before disease modeling
(A) Schematic of cardiomyocyte differentiation, co-cultured with cardiac fibroblasts, and encapsulated within a collagen: Matrigel® hydrogel before injection into microfluidic device. After 13 days of culture, the cells form aligned tissues around the embedded microposts, and are further exposed to the different experimental conditions. (B) Image of microfluidic device on microscope stage. (C) Phase contrast image of aligned human cardiac tissue after 14 days of culture within microfluidic device. (D) Actin-stained tissues after 14 days of culture show well-defined, striated sarcomeres.
2. Materials and methods
2.1. Microfluidic device fabrication
Photolithography and soft lithography techniques were utilized to create polydimethylsiloxane (PDMS)-based microfluidic devices from silicon wafers with SU8 features, consistent with our previous work [41, 46–49]. Briefly, SU8 2075 was spin-coated on 4” silicon wafers to a thickness of 200 μm, then overlaid with a transparent mask with the device design and exposed to UV, using an EVG 620 aligner. The wafer was developed, prepared for soft lithography through salinization, then coated in PDMS, which was further degassed and cured at 80 °C for 1.5 h. The PDMS channels were peeled off the wafer, then prepared through creation of inlet and outlet ports. Devices were formed through bonding of PDMS channels to coverslips with oxygen plasma. The devices were sterilized through two rounds of autoclave and dehydrated at 80 °C overnight before tissue culture.
2.2. COMSOL simulation of oxygen diffusion
Simulation of the diffusion of oxygen through the 3D cardiac tissue region within the microfluidic chip was performed with COMSOL Multiphysics, as similarly performed in our previous studies [41]. The device was modeled to have 6 inlets/outlets that are open to atmosphere, namely 2 flanking each media channel, and 2 inlets made at opposite sides of the tissue channel. Briefly, the value for the diffusion coefficient of O2 in media at 37 °C was determined as 4 × 10⁻⁹ m2/s, while the diffusion coefficient for the hydrogel was determined as 2.4 × 10⁻⁹ m2/s. The concentration for 21% O2 was set at c = 0.15 mol/m3, 5% O2 was set at c = 0.0357 mol/m3, and 1% O2 was set at c = 0.00714 mol/m3.
2.3. Human cardiac fibroblast culture
Human cardiac fibroblasts (hCFs; Lonza) were cultured in Fibroblast Growth Medium-3 (FGM-3) within T75 cm2 flasks and sub-cultured with 0.05% Trypsin + EDTA up to passage 10.
2.4. Human stem cell culture and cardiomyocyte differentiation
hiPSCs (IMR90–4, WiCell [50]) were cultured in mTeSR1 media for 3 passages before CM differentiation. The differentiation protocol was used as described in our recent publication [41], with a range of 7–10 μM of CHIR99021 utilized to initiate differentiation through Wnt activation on Day 0. On Day 3, the Wnt pathway was inhibited with 5 μM IWP2 until Day 5. From Day 7–13, hiPSC-CMs were cultured in RPMI + B27+insulin. On Days 13 and 16, the cells were washed with PBS 1X, then cultured in RPMI minus glucose +B27+insulin, supplemented with 4 mM lactate, to purify for hiPSC-CMs. The cells were recovered on Day 19 with culture in RPMI + B27+insulin. On Day 21, the hiPSC-CMs were replated, using TrypLE Express to dissociate, into fresh hESC-qualified Matrigel-coated 6-well plates, to further purify the hiPSC-CMs and remove dead cells/debris. The purified hiPSC-CMs were used for 3D cardiac tissue formation within microfluidic devices after Day 23 of in vitro differentiation.
2.5. Development of 3D co-cultured anisotropic cardiac tissue on-a-chip
Co-cultured cardiac tissues encapsulated in a 3D collagen-based matrix were formed as previously described [41,42]. Briefly, hCFs were washed with PBS 1X, incubated in Trypsin at 37 °C for 4–5 min, then collected, buffered with an equal volume of FGM3, and centrifuged at 250×g for 4 min. The supernatant was aspirated and the hCFs were resuspended in FGM3 at a density of 75 × 106 cells/mL. Similarly, hiPSC-CMs were washed with PBS 1X, incubated in TrypLE at 37 °C for 10 min, then collected, buffered with an equal volume of RPMI + B27+insulin, and centrifuged at 300×g for 3 min. The supernatant was aspirated and the hiPSC-CMs were resuspended in 5 mL of RPMI + B27+insulin, then centrifuged again at 300×g for 3 min, to sufficiently wash the CMs of residual TrypLE. The supernatant was aspirated, and the hiPSC-CMs were resuspended at a density of 75 × 106 cells/mL in fresh RPMI + B27+insulin.
The CMs and CFs were mixed at a 4:1 ratio, then suspended within a 2 mg/mL collagen hydrogel, supplemented with 20% Matrigel® as optimized in our previous work [41]. Then the cell:hydrogel mixture was carefully injected into the tissue channel of sterilized microfluidic devices. The devices were flipped, then incubated for 9 min at 37 °C within larger petri dishes filled with DI water to maintain a humidified environment. After 9 min, the devices are placed in the hood and flipped upright, then placed back in the incubator for another 9 min to complete hydrogel polymerization. RPMI + B27+insulin was added to the media channels, and media was changed every day.
For 2D experiments, a 4:1 CM:CF cell suspension was seeded on hESC-qualified Matrigel-coated coverslips within a 6-well plate for the entire experimental period. The coverslips were supplemented with RPMI + B27+insulin, and media was changed every other day. These samples served as the 2D control for BioTracker 520 Green Hypoxia Dye validation and fibrotic marker immunostaining.
2.6. Cardiac tissue exposure to various oxygen levels
On Day 13 of culture within the microfluidic heart on-a-chip platform, the devices were incubated for 24 h according to the designated experimental condition. Specifically, the “hyperoxia” devices were maintained in a standard tissue culture incubator at 21% O2, while the “hypoxia” devices were maintained in a separate tissue culture incubator at 1% O2, both humidified with 5% CO2. An environmental chamber was utilized with a corresponding premade gas to establish the “physioxia” condition. Specifically, the devices were placed in the environmental chamber, which was then flushed with compressed gas, with a composition of 5% O2, 5% CO2, and 90% N2, for 5 min. The inlet and outlet ports were closed, and the entire chamber was placed in an incubator set at 37 °C for the 24 h culture period. Within each condition, 3–4 devices were stored in each medium-sized Petri dish, which were placed within a large Petri dish filled with sterile DI H2O to maintain a humidified environment.
2.7. Validation of oxygen levels
To verify the different levels of oxygen at the cellular level within the experimental conditions, a fluorescent imaging probe based on reductase activity, BioTracker 520 Green Hypoxia Dye, was utilized. As per the manufacturer’s protocol, 25 μg of desiccated BioTracker Dye was resuspended in 43 μL of DMSO to make a 1 mM stock solution. The stock solution was further diluted in culture media, i.e., RPMI + B27+insulin, to make a 5 μM working solution. On Day 13, the 2D co-cultures of CMs and CFs were washed twice with PBS 1X, then incubated in 5 μM working solution of BioTracker for 1 h in the designated oxygen condition. The stain was then aspirated and the cells were washed with PBS 1X, before placed in fresh RPMI + B27+insulin and incubated again for 3 h in the designated oxygen condition, after which they were imaged via Zeiss fluorescent microscope.
2.8. Reperfusion and reoxygenation
In order to study reperfusion and reoxygenation on cardiac tissues, after exposure to the varying oxygen levels, the devices were subsequently subjected to three different conditions: 1) no reperfusion, 2) 1 h of reperfusion, or 3) 24 h of reperfusion. For no reperfusion condition, the tissues were removed from their designated oxygen conditions, then immediately imaged or processed for their according assays. For either 1 h or 24 h of reperfusion, the tissues were removed from their oxygen conditions, then the media was replaced with warmed RPMI + B27+insulin and incubated in a standard tissue incubator for either 1 h or 24 h, respectively, then the tissues were processed for their according assays.
2.9. Microscopy
Phase contrast and immunofluorescence images were acquired using Zeiss Axio Observer Z1 equipped with Apotome2 (Zeiss) and ZenPro software. Time-lapse imaging of 30 s was recorded at 10× objective at 37 °C on Day 14 to analyze spontaneous contraction of the 3D tissue inside the chip immediately after removal from experimental oxygen conditions. To calculate inter-beat interval variability of spontaneous contraction, the method described previously was utilized [41]. Briefly, contraction peaks were extracted, and the time interval between peaks was determined. The standard deviation of the inter-beat interval was calculated and deemed the measure of inter-beat interval variability.
2.10. Immunofluorescent (IF) staining
At Day 14 of culture, samples were washed with 1X PBS and incubated in 4% paraformaldehyde (PFA) immediately after removal from experimental conditions. The devices were incubated at 37 °C for 15 min, then were rinsed 2X with PBS-glycine for 10 min at room temperature (RT). The devices were washed again with PBS-Tween-20 ((PBS-Polyoxyethylene (20) sorbitan monolaurate) (0.05% (v/v) Polyoxyethylene (20) sorbitan monolaurate in PBS) for 10 min at RT. Then, the cells were permeablized with 0.1% Triton-X-100 for 30 min at RT, then subsequently blocked with 10% goat serum (in PBS-Tween-20) for 1 h at RT. To stain for the fibrotic marker αSMA, the primary antibody (rabbit anti-α smooth muscle actin from Abcam, 1:100) was diluted in 10% goat serum and added to the samples at 4 °C overnight. The next day, the samples were washed 3X with PBS-Tween-20 for 20 mintues each at RT. Then, the secondary antibody, either anti-rabbit AlexaFluor488 or AlexaFluor594, was diluted in PBS-Tween-20 (1:500) and centrifuged at 14K RPM for 10 min, then added to the samples. After 1 h of incubation at RT, the samples were washed 5X with PBS-Tween-20 for 10 min each at RT.
To stain for actin cytoskeleton and nuclei, either Alexa Fluor488-or Alexa Fluor647-Phalloidin (1:40) and 4’,6-diamidino-1-phenylindole (DAPI) (1:1000) were added to the samples and incubated at 4 °C overnight. Samples were then washed 3X with PBS-Tween-20 for 20 min each at RT. Antifade Mounting Medium was added to the samples (diluted 1:1 in 1X PBS), and the samples were imaged using fluorescence microscopy (Zeiss Axio Observer Z1 with the Zen Pro software suite) equipped with Apotome2 at 10X and 20× objectives. Z-stacked images were captured and reconstructed in FIJI, a version of ImageJ to form representative 3D images. Alternatively, samples were imaged with the Leica SP8 Confocal Microscope at 63× objective, with z-stacked images captured and reconstructed in FIJI to form representative 3D images.
2.11. Assessment of 3D tissue alignment within the microfluidic chip
Images of F-actin- and DAPI-stained tissues formed within the microfluidic chip were analyzed through FIJI. Fast Fourier Transform (FFT) analysis was performed on F-actin images, while DAPI images were used to assess nuclei alignment. For alignment analysis, first, images were rotated based on phase contrast to set alignment axis at 0°. The DAPI-stained image was thresholded, processed through the Watershed plugin, and particles were identified through the Analyze Particles Plugin. The proportion of nuclei was calculated for each angle, grouped in 10° increments, and graphed in histograms.
2.12. Live/dead viability assay
After 24 h of exposure to the different experimental conditions, tissues in the microfluidic devices were assessed for cell viability. Specifically, devices were washed 2X with PBS 1X, then incubated with 2 μM of Calcein AM and 4 μM of Ethidium homodimer-III (EthD-III) for 35 min at room temperature. The solution was aspirated, and the cells were incubated in fresh RPMI + B27+insulin and imaged with a fluorescent microscope. Tissue viability was calculated based on analysis of acquired images, with number of live (green) cells divided by total cell number (green plus red).
2.13. Nuclear viability assay in response to reperfusion
A recently optimized method for the quantification of cell viability within microfluidic 3D tissues [51] was utilized for reperfusion experiments. Specifically, nuclear staining was used, with Ethidium homodimer III (EthD-III) to identify dead cells, and DAPI to identify the total cell population. After exposure of tissues to designated oxygen conditions and their subsequent reperfusion conditions, the devices were washed with PBS 1X, then incubated with 4 μM EthD-III in RPMI + B27+insulin within a standard tissue incubator for 1 h. Then, the devices were washed with PBS 1X, then fixed with 4% PFA for 20 min. After washing again with PBS 1X, the cells were permeabilized with IF Buffer for 30 min at room temperature. The cells were then incubated with 10% goat serum at room temperature for 1 h, and finally stained with DAPI (1:1000 in PBS-Tween20) for 1 h. Before imaging with Zeiss fluorescent microscope, the devices were washed 2X with PBS 1X. Tissue viability was calculated based on analysis of acquired images, with the equation: 1- [(EthD-III+ and DAPI+ cells)/DAPI+ cells].
2.14. Real-time reverse transcriptase-PCR (qRT-PCR)
In order to extract the cells from the tissues within devices for gene expression analysis, the tissues were first washed with PBS 1X, then incubated with 2 mg/mL collagenase for 30–35 min to digest the ECM. The suspension was collected, and the devices were washed 2–3X with PBS 1X to maximize cell collection. The collected cell suspension pooled from multiple devices per condition was centrifuged at 300×g for 3 min, and supernatant was aspirated. Next, Total RNA was extracted with Total RNA Microprep kit (Zymo) per manufacturer’s protocol. RNA quality and concentration were assessed with either High Sensitivity RNA tapes and/or Epoch Spectrophotometer System. cDNA was synthesized from Total RNA using iScript Reverse Transcriptase Supermix (QuantBio). iTaq Universal SYBR Green Supermix (BioRad) was used to perform qPCR on synthesized cDNA, with 18S as the housekeeping gene. Primers were validated via melt curve and PCR product verification. For qPCR, 8 μM dilution of forward and reverse primers was used for 10 μL reactions within 96-well plates, with 0.1 μL per well of cDNA. The qPCR plates were analyzed with qTower 2.0, and the products were verified on 3% agarose gels, imaged with Azure C400.
2.15. RNA-seq
RNA was extracted from devices using Microprep kit (Zymo), as described above, from tissues within microfluidic devices in the physioxia and hypoxia experimental conditions. After analyzing the RNA quality and concentration on High Sensitivity RNA Tape Station, mRNA was extracted and sequenced by Illumina NextSeq2000 at the Genomics Core Facility at ASU. FASTQ files were aligned to the human reference genome (Ensembl GRCh38 release 102) using STAR (v2.7.6a) and the reads that mapped to mitochondrial genes were excluded. Raw counts for 60,623 genes were then normalized by CPM and genes having read count <2 were excluded. Ensembl IDs were mapped to remove duplicate genes after arranging for gene counts from high to low, leaving 15,821 genes. Genes were considered differentially expressed for FDR<0.05 and log2(FoldChange) > 1 (up-regulated) or log2(FoldChange)<−1 (down-regulated) in hypoxia. A total of 475 differentially expressed genes (DEGs) between hypoxia and physioxia samples were identified using DESeq2 (v1.30.1) with LFC shrink set to normal. Enriched KEGG pathways were identified by performing gene set enrichment analysis by fgsea v1.60.0 on fold changes from DESEQ2 for 15,821 genes. PathfindR (v1.6.1) was employed for visualizing gene network and pathways to assess if DEGs in DESeq2 are associated with a pathway.
2.16. Serum lactate assay
In order to assess the level of lactate secreted by 3D cardiac tissues in the microfluidic chip, culture media was collected after 24 h of exposure to the oxygen conditions, and after 24 h of reperfusion. The media was diluted 1:50 into PBS 1X, then duplicates of each sample were measured with the LactateGlo assay (Promega). Specifically, after 1 h of incubation with freshly prepared lactate detection solution, the Synergy H1 microplate reader was used to measure the luminescence of each sample. A standard curve of different lactate concentrations was performed to determine the amount of lactate in experimental samples.
2.17. Statistical analysis
Paired, two-sided t-tests were used for statistical analysis of inter-beat interval variability and BPM for each condition using R. For gene expression data from qPCR, two-way ANOVA was performed on the DCT values using GraphPad Prism. Two-way ANOVA was performed using GraphPad Prism on the tissue alignment and fibrotic marker expression.
3. Results
3.1. Validation of hypoxia
Prior to proceeding to 3D on-chip tissue experiments, we validated the level of oxygen within the different environments using the fluorescent imaging probe, BioTracker 520 Green Hypoxia Dye. Particularly, cells were incubated for 1 h with the dye, then washed and fresh media added, then incubated for 3 h in the designated environmental conditions. Fig. S1 shows the results of BioTracker 520 Green Hypoxia Dye expression for cells seeded on 2D coverslips exposed for a total of 4 h under the different oxygen conditions. The expression of the BioTracker dye increased as the oxygen level decreased, with the highest expression demonstrated in 1% O2 (hypoxic) conditions, as imaged at 10X (Fig. S1A) and 20× magnification (Fig. S1B). Therefore, each environmental condition accurately exposed the cultured cells to the designated oxygen level, as confirmed through increased expression of BioTracker.
To further confirm the oxygen levels within our 3D cardiac on-a-chip model when incubated in the different oxygen conditions, we performed COMSOL simulation to determine the level of oxygen in the device over time (Fig. S2). The tissues within the microfluidic devices were exposed to the reduction in oxygen concentration by 1 h of incubation and reached equilibrium by 12 h of incubation. Upon verifying the experimental setup, the 3D co-cultured cardiac tissues were formed within the on-chip microfluidic platform. On Day 14, after being exposed to the different oxygen levels for 24 h, the viability of the cardiac tissues was assessed and quantified (Fig. 2A, C). Among all conditions, the average viability (percent live cells over total cells) was around 88–90%, with no significant differences due to oxygen level in literature that reperfusion (Fig. 2C), when tissues are immediately processed after exposure to the different oxygen levels. This finding corroborates previous findings in literature that reperfusion (i.e. reoxygenation) or a shift in pH are major contributors to hypoxia-activated apoptosis [52].
Fig. 2.
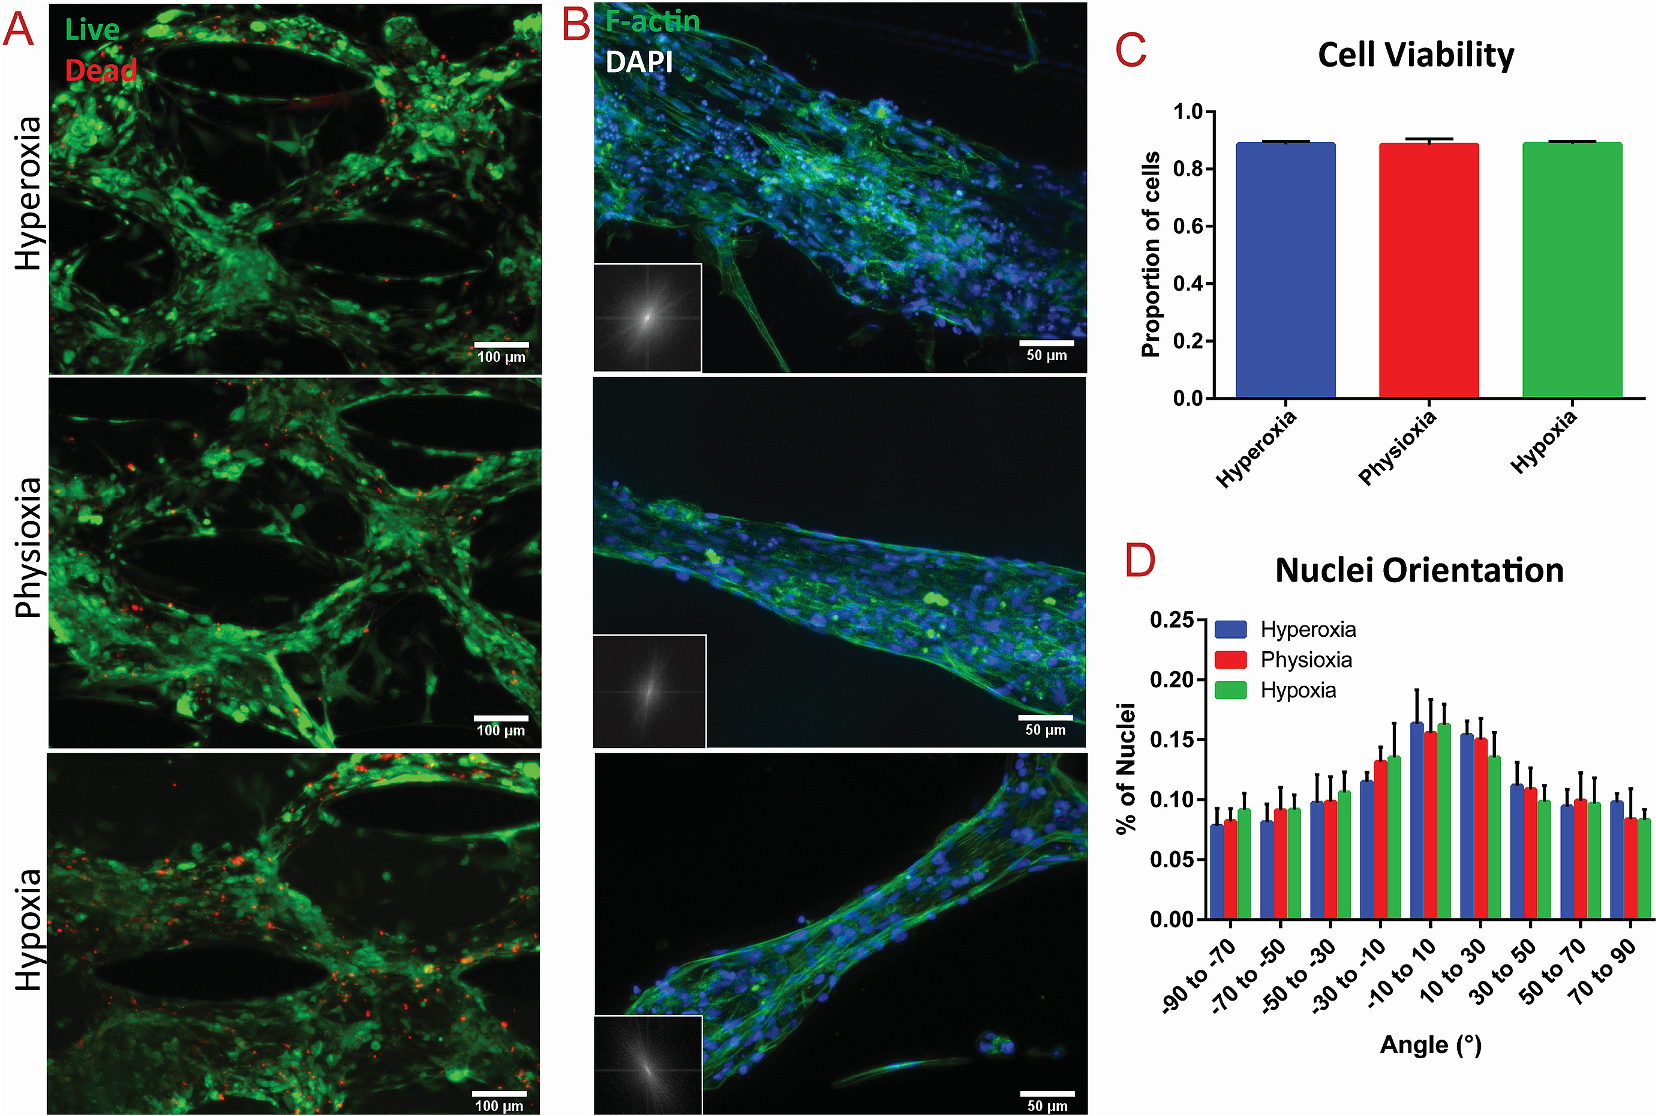
Viability and alignment assessment of cardiac tissues after exposure to varying oxygen levels
(A) Viability assay of cardiac tissues after 24 h of exposure to different oxygen levels, with green = live and red = dead. (B) F-actin staining (green) of cardiac tissues within the vertical spacing between posts within each condition, with FFT analysis in the lower left corner. Corresponding quantification of (C) cell viability assay and (D) nuclei alignment of the cardiac tissues in each condition, extracted from relative immunostaining.
To further investigate the extent of hypoxia required to induce apoptosis within the cardiac on-a-chip model, the devices were incubated in the respective oxygen conditions for an extended period of time (i.e., 48 h). However, due to the small size and associated volume of culture media of the microfluidic devices, the tissues within devices generally require daily media changes. In this experiment, to avoid introduction of reperfusion, we forewent media exchange to allow uninterrupted, extended incubation in the oxygen environments beyond 24 h. Therefore, cell death was expected in all conditions regardless of oxygen levels. We also identified a near significant decrease (p-value of 0.0688) in cell viability in the hypoxic conditions compared to physioxic, demonstrating the induction of apoptosis due to extended hypoxia (Fig. S3).
3.2. Analysis of cardiac tissue alignment in response to oxygen conditions
The structural integrity and anisotropy of the cardiac tissues after exposure to the different oxygen levels was analyzed through F-actin imaging and nuclei alignment. The innate microposts within the tissue region of the microfluidic platform (Fig. 1B) induced high levels of anisotropy, which was pertinent to promote maturation of the encapsulated stem cell-derived CMs [41]. To assess whether deprivation of oxygen disrupted the tissue architecture, Fast Fourier Transform (FFT) was performed of the F-actin stained images, while analysis of nuclei alignment was performed based on DAPI staining (Fig. 2B, D). Highly aligned areas between the vertical spacing of the microposts were analyzed (see Fig. S4 for tissues between horizontal spacing of posts), revealing no significant changes in tissue alignment in exposure to hypoxia (Fig. 2D). To that end, our results demonstrated that the extent of hypoxia without presence of reperfusion did not alter the overall alignment of heart on-a-chip tissues.
3.3. Fibrotic response of 3D tissues to hypoxia
Ischemia has been shown to cause myofibroblast differentiation of resident CFs in the native myocardium [35,39]. Cardiac myofibroblasts express contractile proteins, such as α-smooth muscle actin (αSMA), and respond to various mechanical and biochemical stimuli, particularly after ischemic insults in the remodeling heart [35,38]. To assess the induction of fibrotic and myofibroblast differentiation of the encapsulated CFs in response to ischemia within the microfluidic heart-on-a-chip platform, IF imaging of both αSMA expression and F-actin filaments was performed on the cardiac tissues after exposure to the various oxygen levels. The corresponding integrated density (area times mean grey value) of αSMA and F-actin filaments was measured within 2–3 images per device. Analysis of αSMA signal intensity revealed significantly increased expression of αSMA within tissues exposed to hypoxia, compared to those in the hyperoxic (i.e., standard tissue culture) condition (Fig. 3A). To further hone in on the fibrotic response of the innate tissue, the integrated density of αSMA was normalized to the integrated density of actin within each image acquisition (Fig. 3B). When αSMA expression was normalized to abundance of F-actin fibers, there was a significantly increased fibrotic response within tissues in the hypoxic condition, as compared to both the physioxic and hyperoxic conditions (Fig. 3B).
Fig. 3.
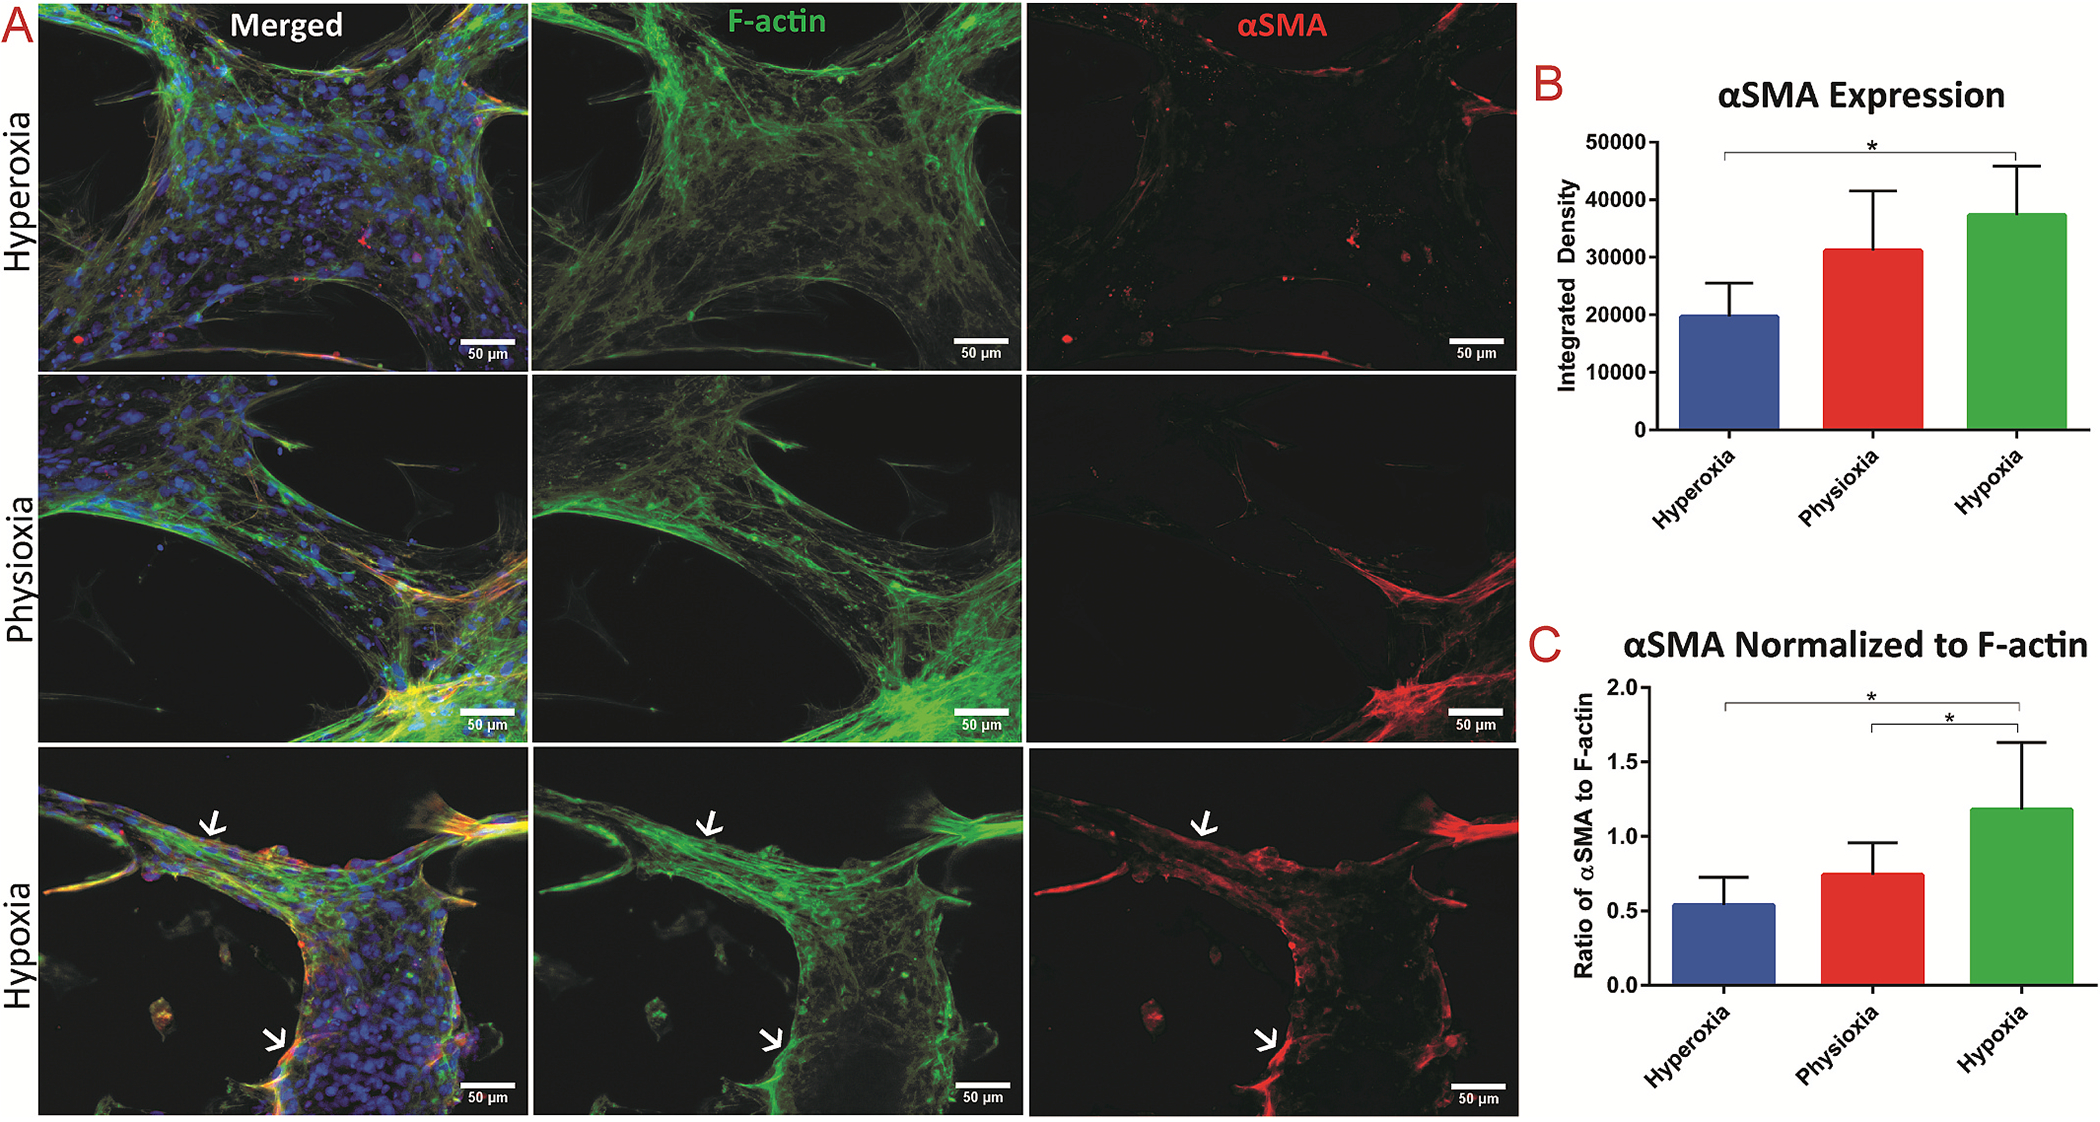
Assessment of fibrotic response in 3D tissues exposed to the varying oxygen levels
(A) Immunostaining of cardiac tissue after exposure to the different oxygen levels of F-actin = green and αSMA = red, with white arrows indicating co-localization of F-actin and αSMA. Quantification of (B) integrated density of αSMA stain and (C) integrated density of αSMA stain normalized to the integrated density of F-actin fibers. * denotes p-value < 0.05.
To tease the role of the 3D environment on ischemic response in cardiac tissues, we investigated the effect of varying oxygen on 2D co-cultured CMs with CFs that were seeded on coverslips and cultured for the 13-day experimental period. On the 13th day, the coverslips were exposed to the different levels of oxygen for 24 h. The cells were fixed, stained for αSMA and F-actin expression (Fig. S5A), and the respective integrated density was quantified. Interestingly, there was no significant difference in αSMA expression, nor in ratio of αSMA to F-actin (Figs. S5B and C). Only the 3D culture of CMs and CFs in collagen: Matrigel hydrogel within the microfluidic platform displayed a significant upregulated expression of αSMA due to hypoxic condition. This is presumably due to the stiff substrate of Matrigel-coated coverslips in the 2D condition [36,37,53], and the extended culture in this stiff condition for 13 days, that there was a baseline expression αSMA on Day 13 already. On Day 14, the relatively high level of expression of αSMA in control condition (i.e., hyperoxia) corroborates the elevated αSMA expression over the 3D control on Day 14, thereby masking any additional fibrotic effect from hypoxic conditions. These findings emphasize the necessity for 3D culture to accurately mimic human physiology [28,29,54]. Additionally, the IF findings demonstrate the utility of our heart on-a-chip model for modeling the pathophysiological fibrotic response to hypoxia.
3.4. Contractile functionality of 3D tissue in response to varying oxygen levels
Myocardial ischemia can result in irregular contractile patterns [55], i.e., arrythmias, due to intracellular calcium mishandling and development of tissue fibrosis [16]. To assess the effect of hypoxic environment on cardiac tissues’ contractile response, real time videos of 30 s duration were recorded of tissue spontaneous contraction immediately after 24 h of exposure to the different oxygen conditions (Fig. 4A). The standard deviation of these time intervals was calculated and determined as the measure of inter-beat interval variability. Contraction analysis reveals no difference between spontaneous beat rates in the various oxygen conditions (Fig. 4B). However, there was a significant increase in inter-beat interval variability between physioxia and hypoxia (Fig. 4C), demonstrating a decrease in synchronicity after 24 h of exposure to hypoxic conditions (Videos S1–3). This was further revealed in the resultant calcium transients of the 3D tissues within the chip (Videos S4–6). A similar detrimental effect on contractile function from hypoxia exposure was demonstrated in studies on rat CMs within engineered heart tissues [56] and hiPSC-derived cardiac organoids for MI modeling [57], altogether corresponding to the observed clinical manifestation of arrhythmias from myocardial ischemia.
Fig. 4.
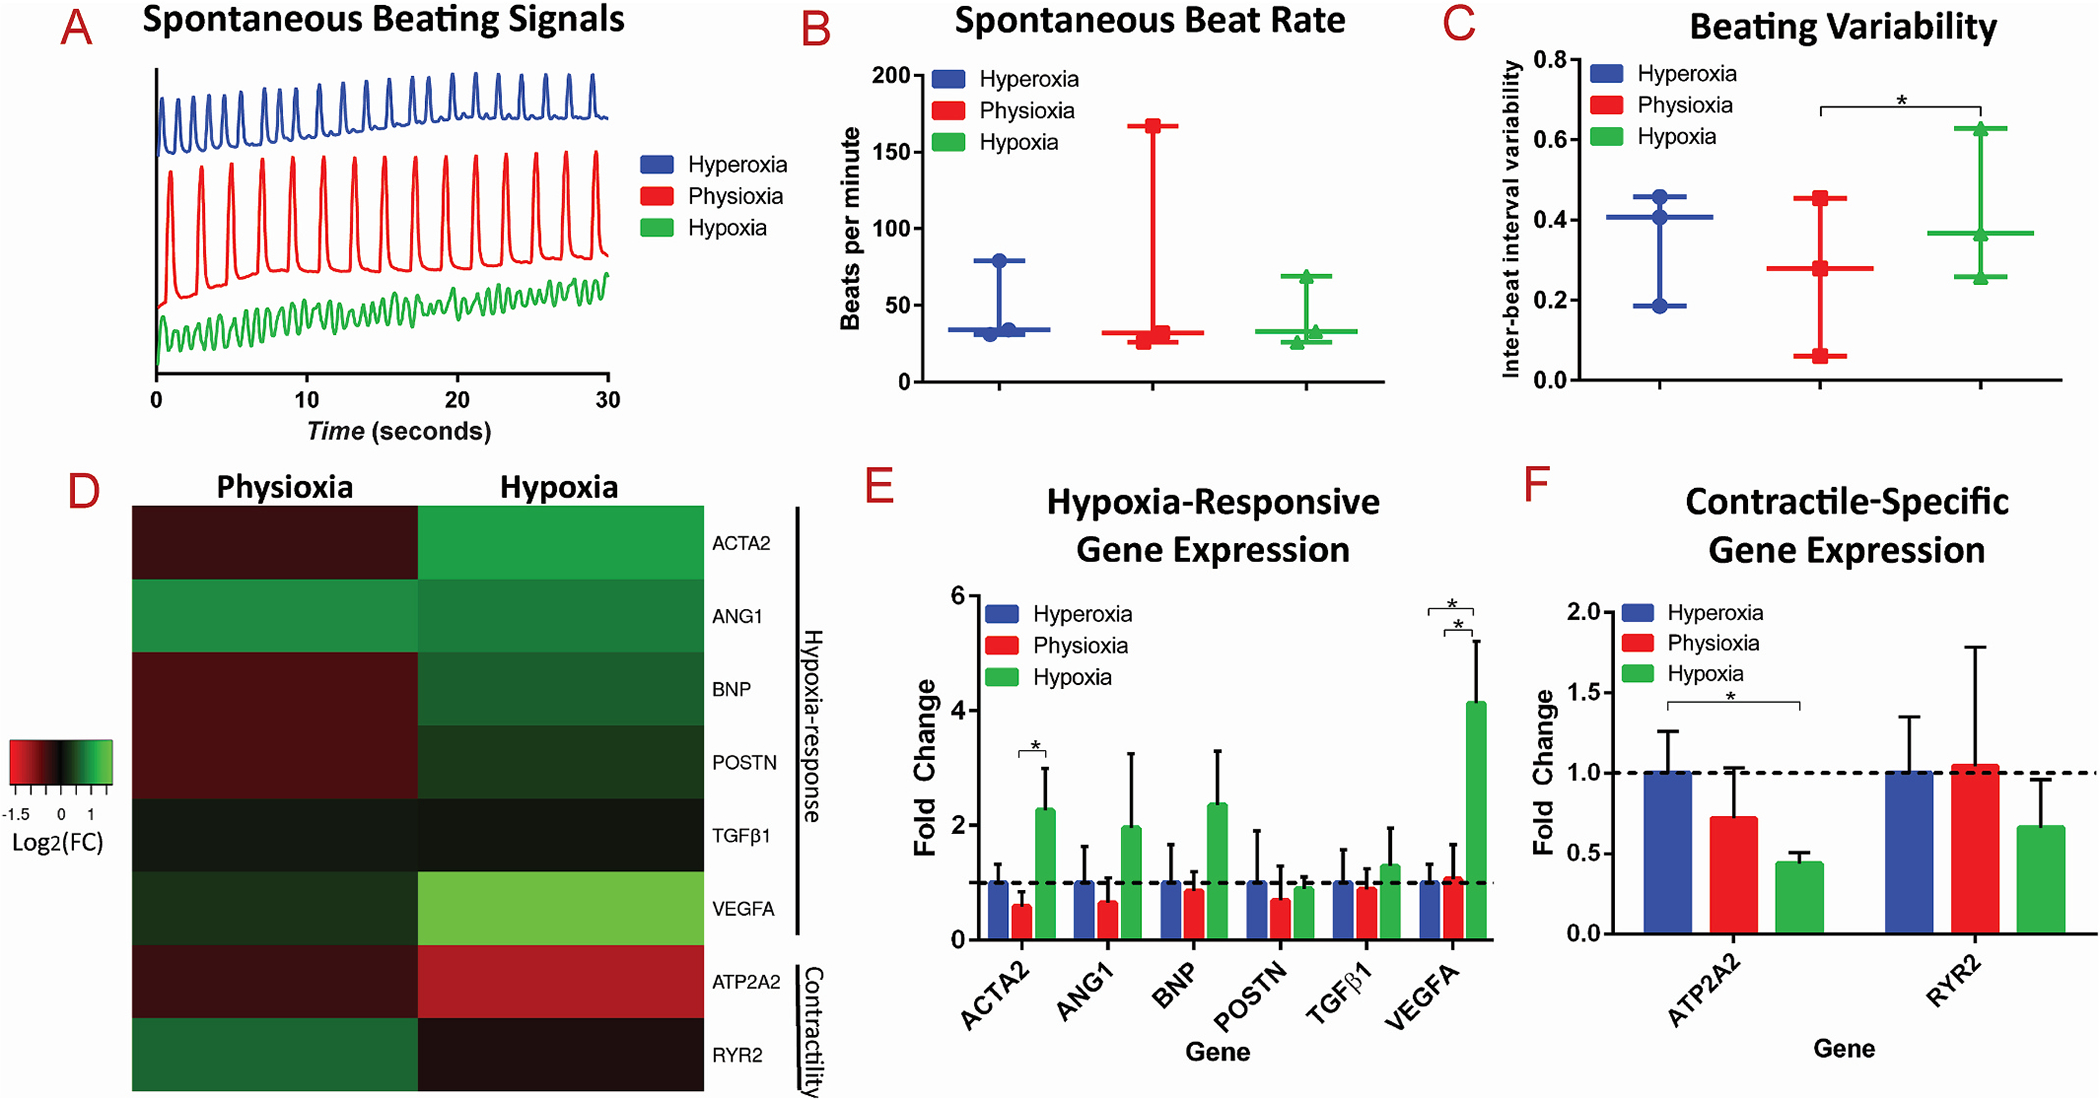
Resultant functional and gene expression analysis of 3D cardiac tissues after exposure to different oxygen levels
(A) Representative spontaneous beating signals, (B) average spontaneous beating rate, and (C) inter-beat interval variability from cardiac tissues exposed to hyperoxic, physioxic, and hypoxic conditions. (D) Heatmap of the Log2 of the expression fold change of hypoxia-responsive and contractile-specific genes. Bar graphs of the fold changes of (E) hypoxia-responsive genes and (F) contractile-specific genes are shown, with * as p-value <0.05.
Supplementary data related to this article can be found online at https://doi.org/10.1016/j.biomaterials.2021.121336
3.5. Transcriptional effect of hypoxia within cardiac tissues
To further probe the effect of hypoxia on the molecular level within 3D cardiac tissues formed in the microfluidic chip in response to varying oxygen levels, quantitative polymerase chain reaction (qPCR) was performed on an array of genes that have been implicated in response to hypoxic conditions, as well as genes involved in contractility (Fig. 4D). Specifically, the differential expression of hypoxia-responsive genes, ACTA2, ANGI, BNP, POSTN, TGFB1 (TGFβ1), and VEGFA (Fig. 4E), and contractile-specific genes, ATP2A2 and RYR2 (Fig. 4F), was assessed. During hypoxia, HIF-1α is stabilized and binds to hypoxia-response elements of target genes, that lead to upregulation of pathways such as glycolysis (through PDK), angiogenesis (through VEGF), and erythropoiesis (EPO) [17,58]. Angiogenic pathways are induced in response to ischemia due to an upregulated expression of VEGFA, which stimulates the remodeling of blood vessels to lead to increased blood flow [59]. Our study demonstrated that gene expression of VEGFA was significantly upregulated in the 3D tissues exposed to hypoxia, as a physiological response to induce angiogenesis to counteract the cellular perception of reduced tissue perfusion. Additionally, expression of ACTA2, the gene involved in fibrotic response that encodes for αSMA protein, was significantly upregulated, in comparison of physioxic tissues to hypoxic tissues (Fig. 4E). This finding confirms the induction of fibrotic response within the hypoxic tissues, as similarly demonstrated from analysis through αSMA immunofluorescent quantification (Fig. 3). Therefore, exposure of cardiac tissues to hypoxic environments for an extended time triggers the biological cascades for both angiogenesis and fibrosis.
It has also been clinically observed that patients secrete higher amounts of B-type natriuretic peptide (BNP) in their blood during myocardial ischemia, therefore it is commonly used as a diagnostic marker in the clinic [60,61], and has been found to be upregulated in vitro in human CMs in response to hypoxia [62]. Therefore, we assayed gene expression levels of BNP of hypoxia tissues and found an upregulation in the transcription of BNP compared to physioxic and hyperoxic levels, however it does not reach significant levels from n = 3 experiments. Similarly, TGFβ1 protein levels have been observed to be upregulated during myocardial ischemia, serving as a transcription factor that initiates transcription to activate a cascade of events, resulting in fibrosis [63]. Therefore, we assayed gene expression levels of TGFB1 and found no significant difference in expression at the transcription level of TGFB1, nor POSTN, a direct target of TGFβ1 as a transcription factor [64, 65], between the various oxygen conditions, despite the corresponding IF that revealed induction of a fibrotic response in hypoxic tissues. To that end, we speculate that the observed upregulation of TGFβ1 protein may not be apparent at the transcriptional level; i.e., a mechanism is occurring either post-transcriptionally, translationally, or post-translationally, which involves upregulation of TGFβ1 protein and induction of fibrotic responses.
Gene expression of ANGI (angiotensin I) was also upregulated in the hypoxic conditions, albeit not to statistical significance from n = 3 experiments. Angiotensin I is the precursor to Angiotensin II, which is involved in the heart renin-angiotensin system, and has been widely implicated in myocardial infarction [66]. The upregulation of ANGI in hypoxic tissues within our model leads to the hypothesis that ANGI was a major regulator of fibrosis in these tissues, as demonstrated through contractile stress fiber formation.
Contractile-specific responses are known to be downregulated in ischemia-reperfusion heart failure [19], therefore we assessed expression of ATP2A2 (sarco-endoplasmic reticulum Ca2+ ATPase) and RYR2 (ryanodine receptor), genes pertinent in calcium-handling and thus contraction. Both contractile-specific genes exhibit a trend of downregulation corresponding with decreasing oxygen levels (Fig. 4F), with a significant downregulation of ATP2A2 in hypoxic conditions, compared to hyperoxia. These findings, within the 3D cardiac tissue-on-chip model, correspond to the clinically observed dysregulation of contractile machinery that occurs in response to ischemia. Additionally, these findings reiterate the discovered disruption in contractile function demonstrated in hypoxic conditions, quantified through inter-beat interval variability, further underlying the adverse role of hypoxia on contractility.
In order to assess the physiological relevance of our cardiac on-a-chip tissue model compared to standard 2D culture, we exposed 2D CM:CFs at a ratio of 4:1 to the different oxygen conditions for 24 h and assayed the transcriptomic response (Fig. S6). Interestingly, of the hypoxia-responsive and contractile-specific genes assayed, we did not observe a statistically significant difference in expression among the three oxygen conditions. There are apparent trends in upregulation of BNP and VEGFA in hypoxia in 2D, however the trend does not reach significance, and the magnitude of fold change is much lower than that observed in the 3D cardiac tissues on-a-chip. This finding further demonstrates the enhanced clinical relevance and possible translatability of this myocardial ischemia on-a-chip model compared to traditional 2D culture.
3.6. Global transcriptomic response of 3D cardiac tissues to hypoxia
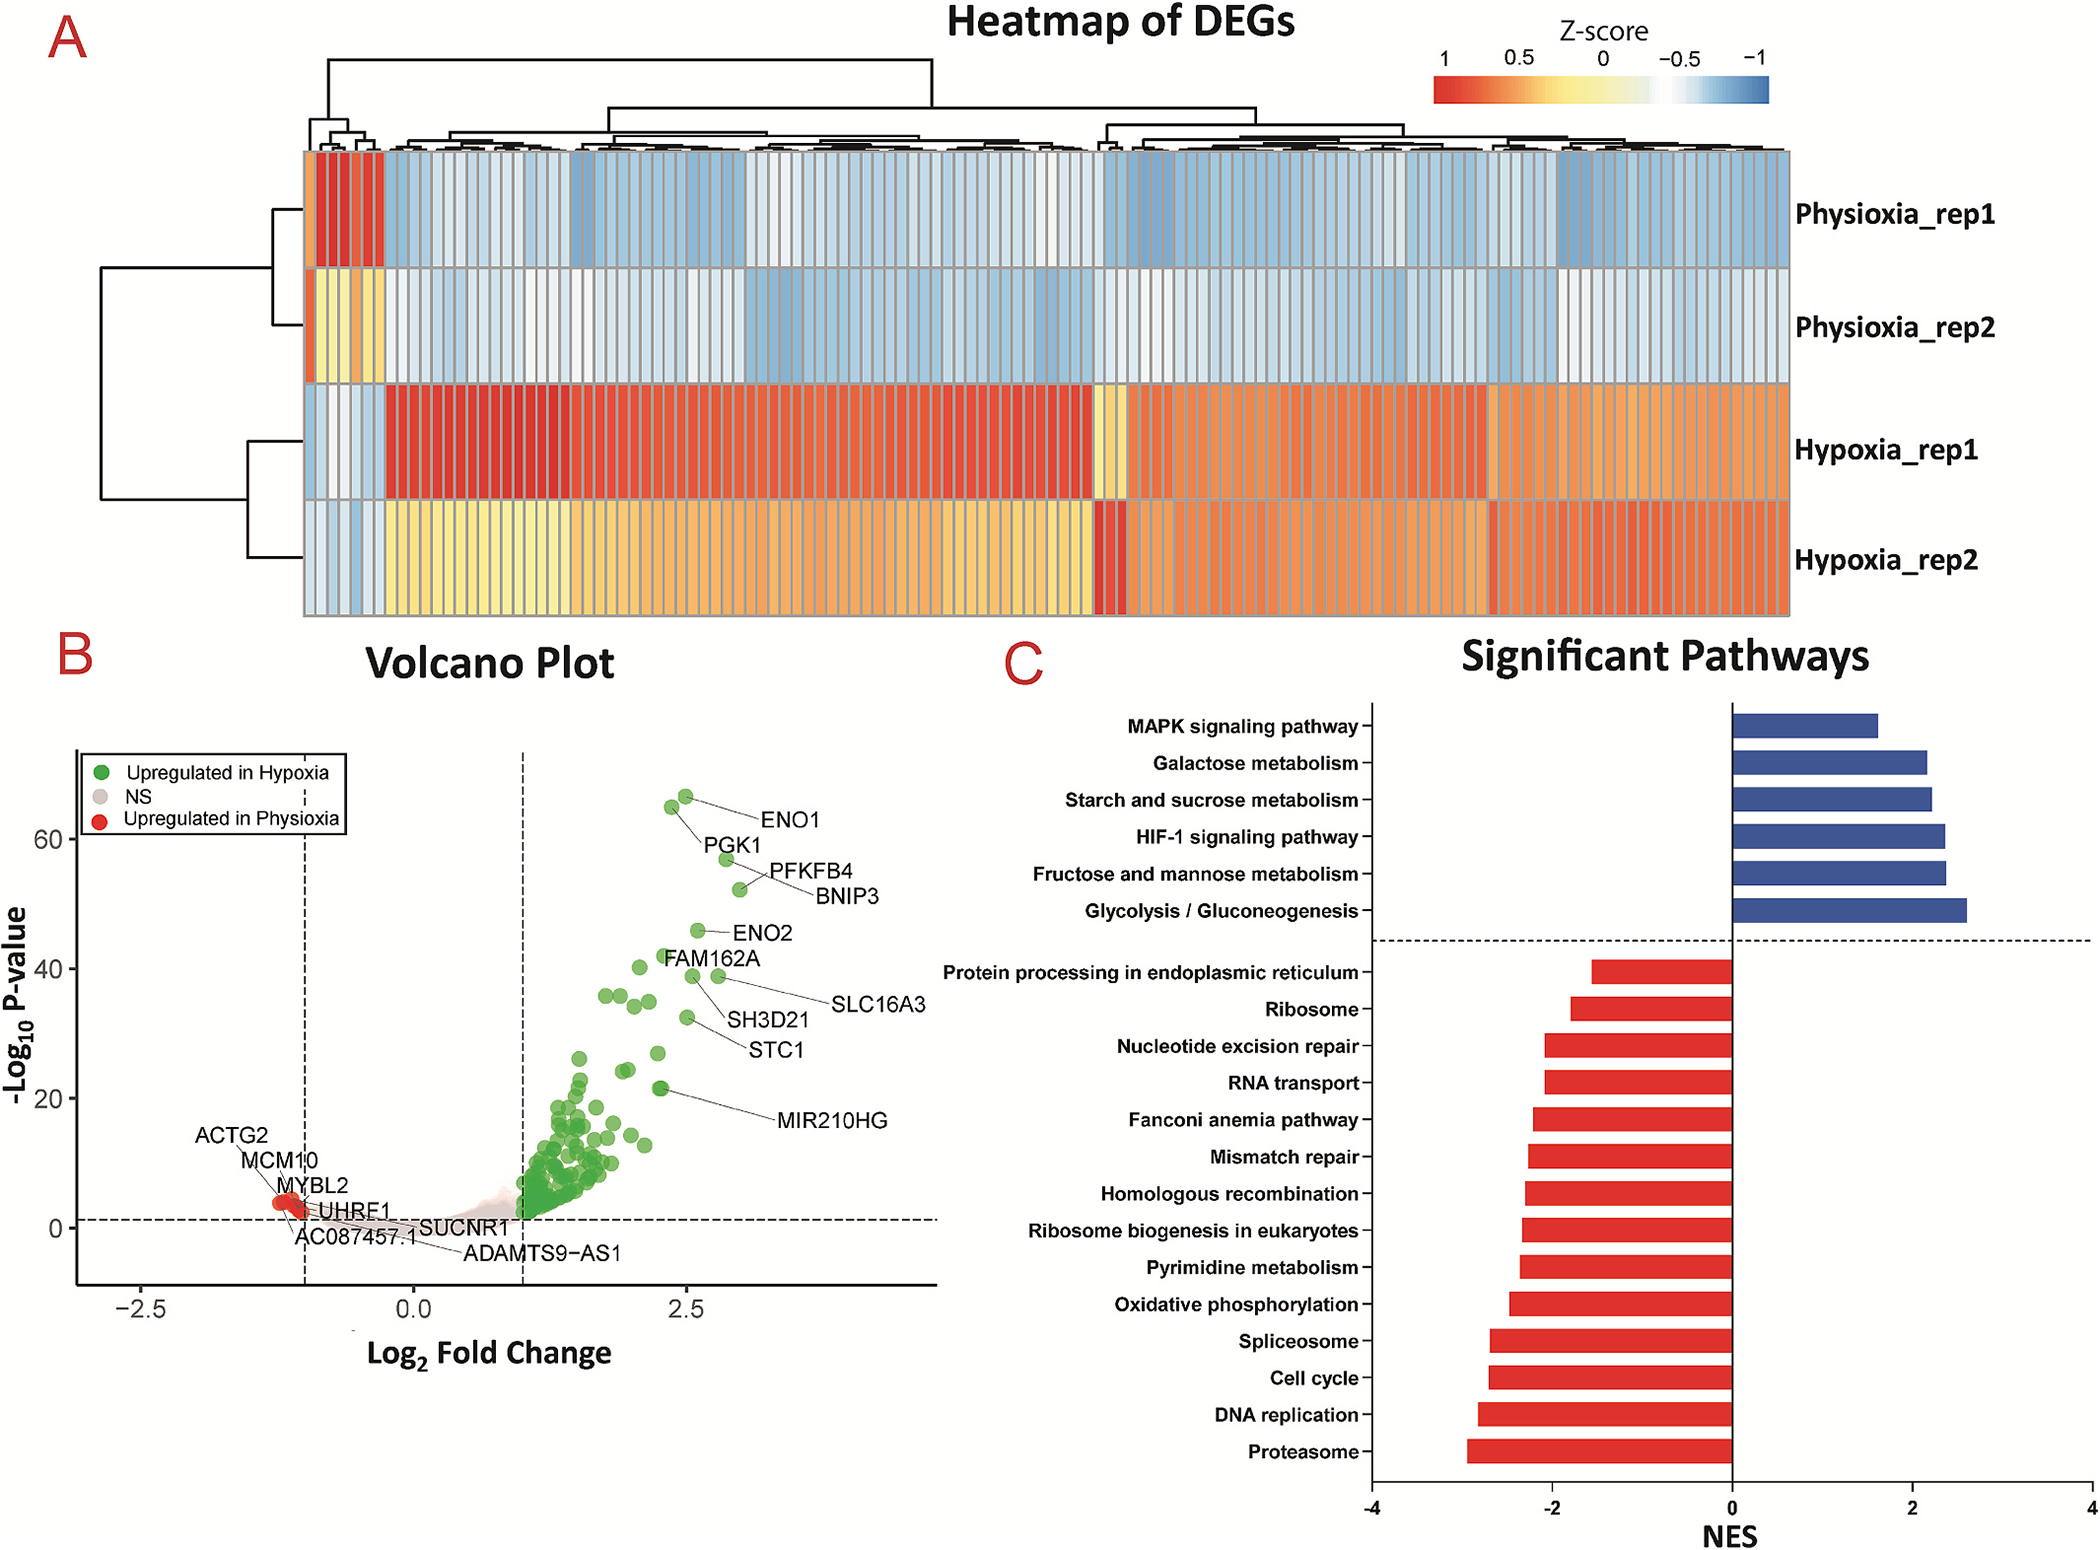
To analyze the transcriptomic profile of co-cultured 3D cardiac tissue within the microfluidic chip in response to hypoxia, whole tissue RNA-seq was performed. As qPCR analysis revealed no significant differences in expression of the assayed panel of genes for 3D tissues exposed to hyperoxia compared to physioxia, for RNA-seq analysis, we designated the tissues in the physioxia condition as the control and compared the gene expression profiles to those of tissues exposed to hypoxia, each in duplicates. Statistical analysis between the conditions identified a total of 128 differentially expressed genes (DEGs, |log2FC|>1 FDR<0.05), 121 up-regulated and 7 down-regulated, and the Z scores of expression levels were plotted in a heatmap with clustered dendrogram (Fig. 5A), demonstrating the consistent trend of gene expression regulation amongst the duplicates and between different oxygen conditions. The volcano plot (Fig. 5B) shows global gene expression profile changes in response to hypoxia for 15,821 genes, further highlighting that hypoxia resulted in more up-regulated genes (121 genes at thresholds of log2FC| 1| and FDR <0.05, respectively) than down-regulated genes (7 genes at thresholds of log2FC|1| and FDR <0.05, respectively) with annotation for top ten genes for |log2FC|>1. Pathway enrichment analysis was then performed on log2FC scores for 15,821 genes on the KEGG (Kyoto Encyclopedia for Genes and Genomes) database to assess if DEGs, in DESeq2.Significant genes with FDR<0.05, associated with a pathway, as shown in Fig. 5C, and the significant enriched pathways with FDR< 0.05 were further investigated. The most significant pathway with the highest positive normalized enrichment score (NES) was glycolysis, demonstrating the switch from oxidative phosphorylation to glycolysis during hypoxia. Additionally, other pathways involved in metabolism were upregulated in the hypoxia condition, including fructose, starch, and galactose metabolism, while oxidative phosphorylation was downregulated, altogether further highlighting the glycolytic flux that occurs in ischemia. One of the second most upregulated pathways was HIF1 (hypoxia inducible factor 1) signaling, which is activated via hypoxia and implicated in myocardial ischemia [59]. As mentioned, HIF-1α, the primary transcriptional regulator of HIF1 signaling, is involved in activation of angiogenesis, glycolysis, etc. Additionally, a vast amount of studies on the role of hypoxia in tumor biology [67–70] has unveiled that HIF-1α also transcriptionally downregulates DNA repair pathways, including base excision repair (BER), mismatch repair and homologous recombination. The 3D cardiac tissues demonstrated a similar trend in the downregulation of many DNA repair pathways, including homologous recombination, mismatch repair, and nucleotide excision repair, in the hypoxia condition. Consistently, a number of genes responsible for DNA replication have been demonstrated in literature to be repressed in hypoxic conditions [71–73]. Correspondingly, we demonstrated that the RNA-sequencing of physioxic vs. hypoxic exposure of the 3D cardiac tissues reveals downregulation of DNA replication in tissues exposed to hypoxia. To visualize significant genes that are involved in the top 10 enriched pathways, we performed term-gene graph analysis (Fig. 6). Many genes in the MCM (minichromosome maintenance) family are downregulated, and are shared in the downregulation of both enriched pathways of DNA replication and cell cycle, further highlighting the detrimental effect on cell division from hypoxia.
Fig. 5.
Transcriptomic analysis of physioxic and hypoxic tissues
(A) Heatmap of differentially expressed genes (DEGs) between physioxia and hypoxia conditions, with FDR <0.05 of replicates from n = 2 experiments. (B) Volcano plot of DEGs, where green = up-regulated in hypoxia, grey = not significant, red = up-regulated in physioxia, with annotation for top 10 genes with |log2FC|>1. (C) Pathway analysis, showing downregulation (red) and upregulation (blue) of pathways in hypoxia compared to physioxia with adjusted p-value <0.05.
Fig. 6.
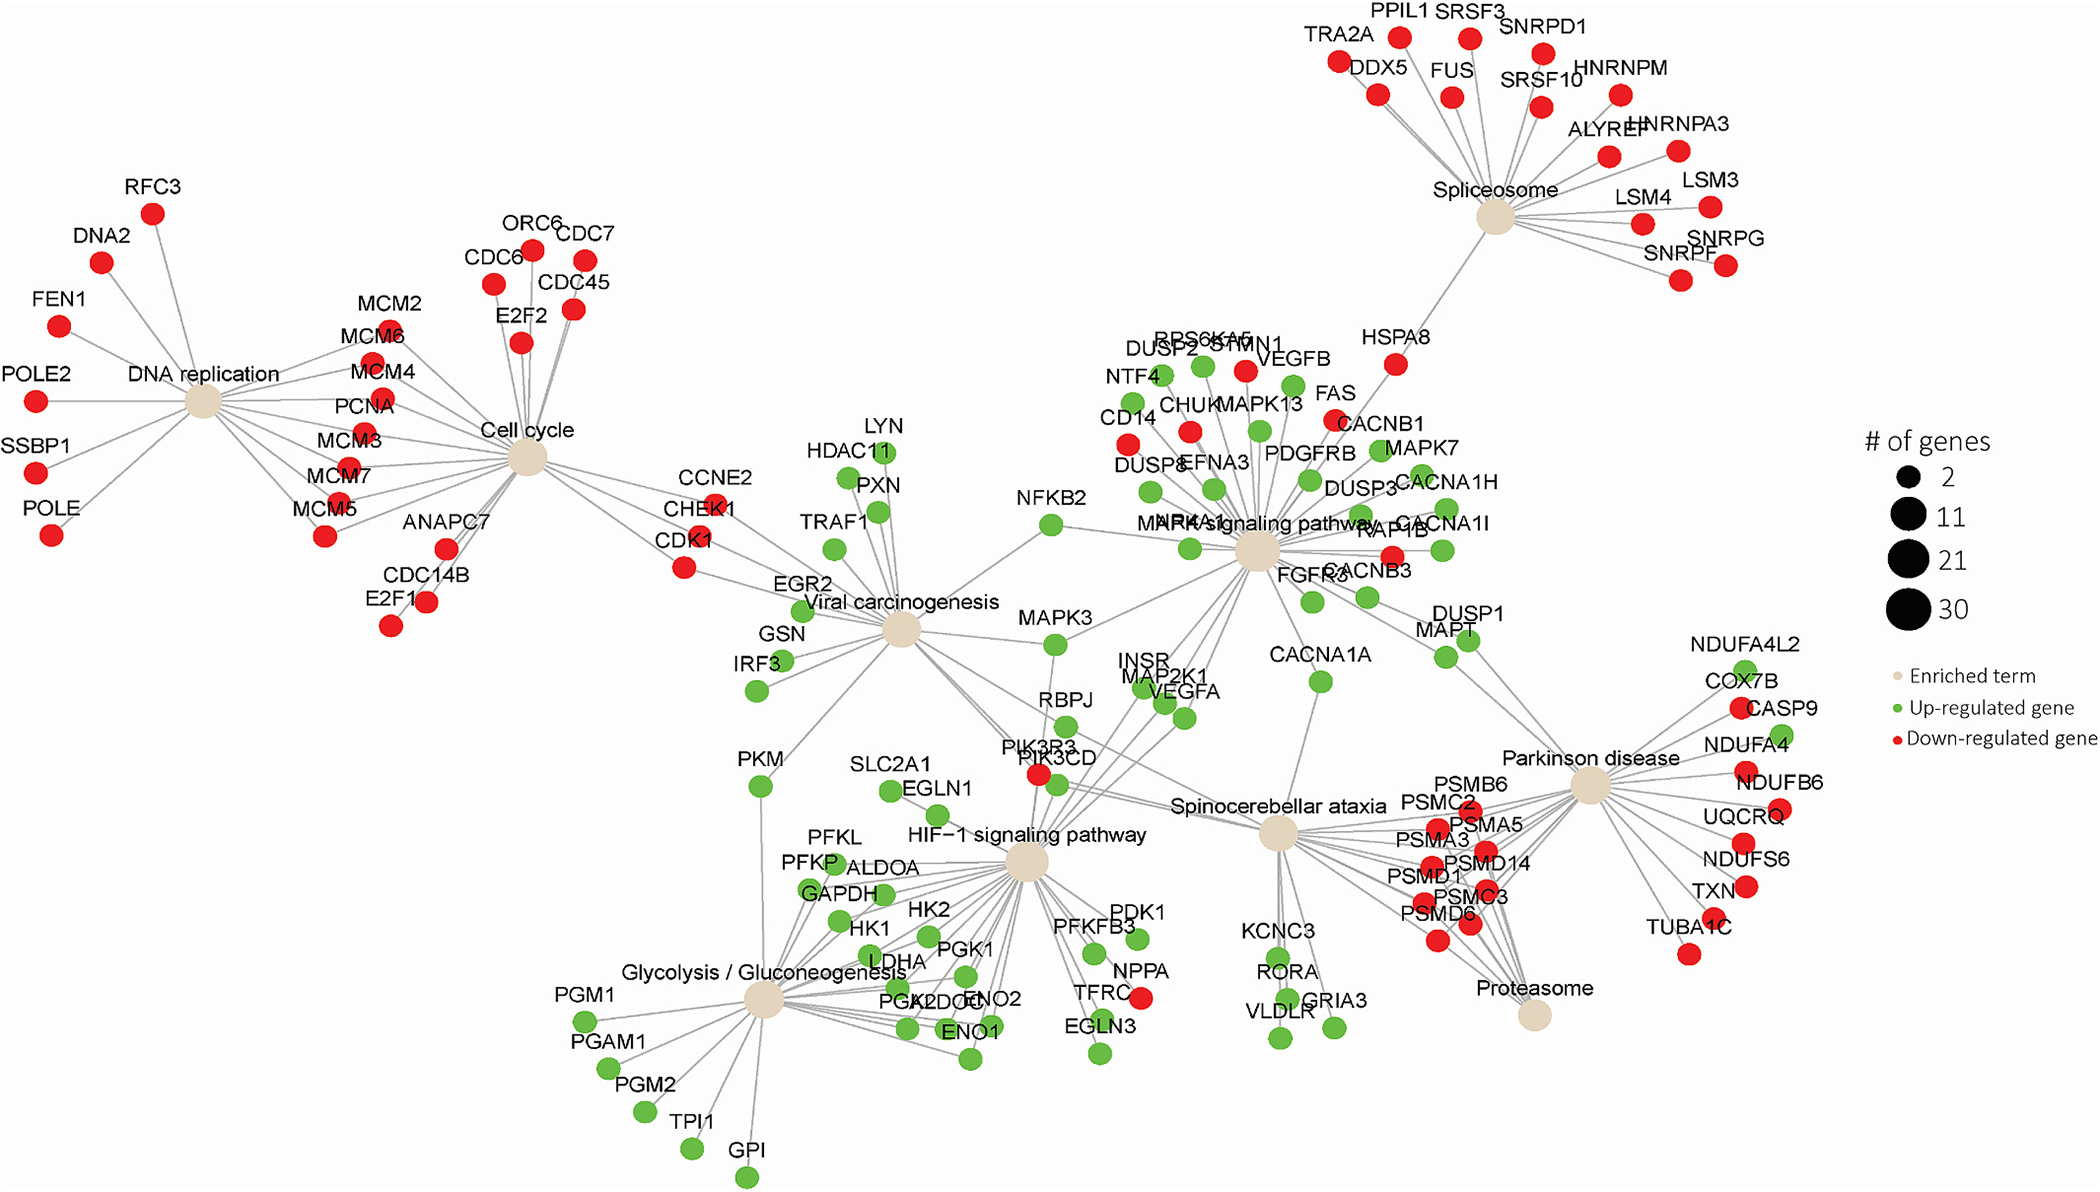
Visualization of significant genes among top 10 enriched terms from transcriptomic analysis of physioxic compared to hypoxic tissues.
Furthermore, the most highly downregulated pathway observed in hypoxic tissues compared to physioxic tissues was the proteasome pathway, with a plethora of PSM (proteasome) genes implicated (Fig. 6). Consistently, it has been previously demonstrated in mesenchymal stem cells that hypoxia causes dissociation and inactivation of 26S proteasome assembly [74]. Our data suggests that a similar biological response is occurring in human cardiac cells in response to hypoxia, and due to inactivation of the 26S proteasome, there is a transcriptional downregulation of the genes involved in proteasome activity. Therefore, the response of the cardiac tissues to hypoxic conditions, on the transcriptomic level, greatly corresponded with previous findings on cellular response to hypoxia, as well as with clinical observations during myocardial ischemia.
3.7. Viability and functional response of cardiac tissues to reperfusion
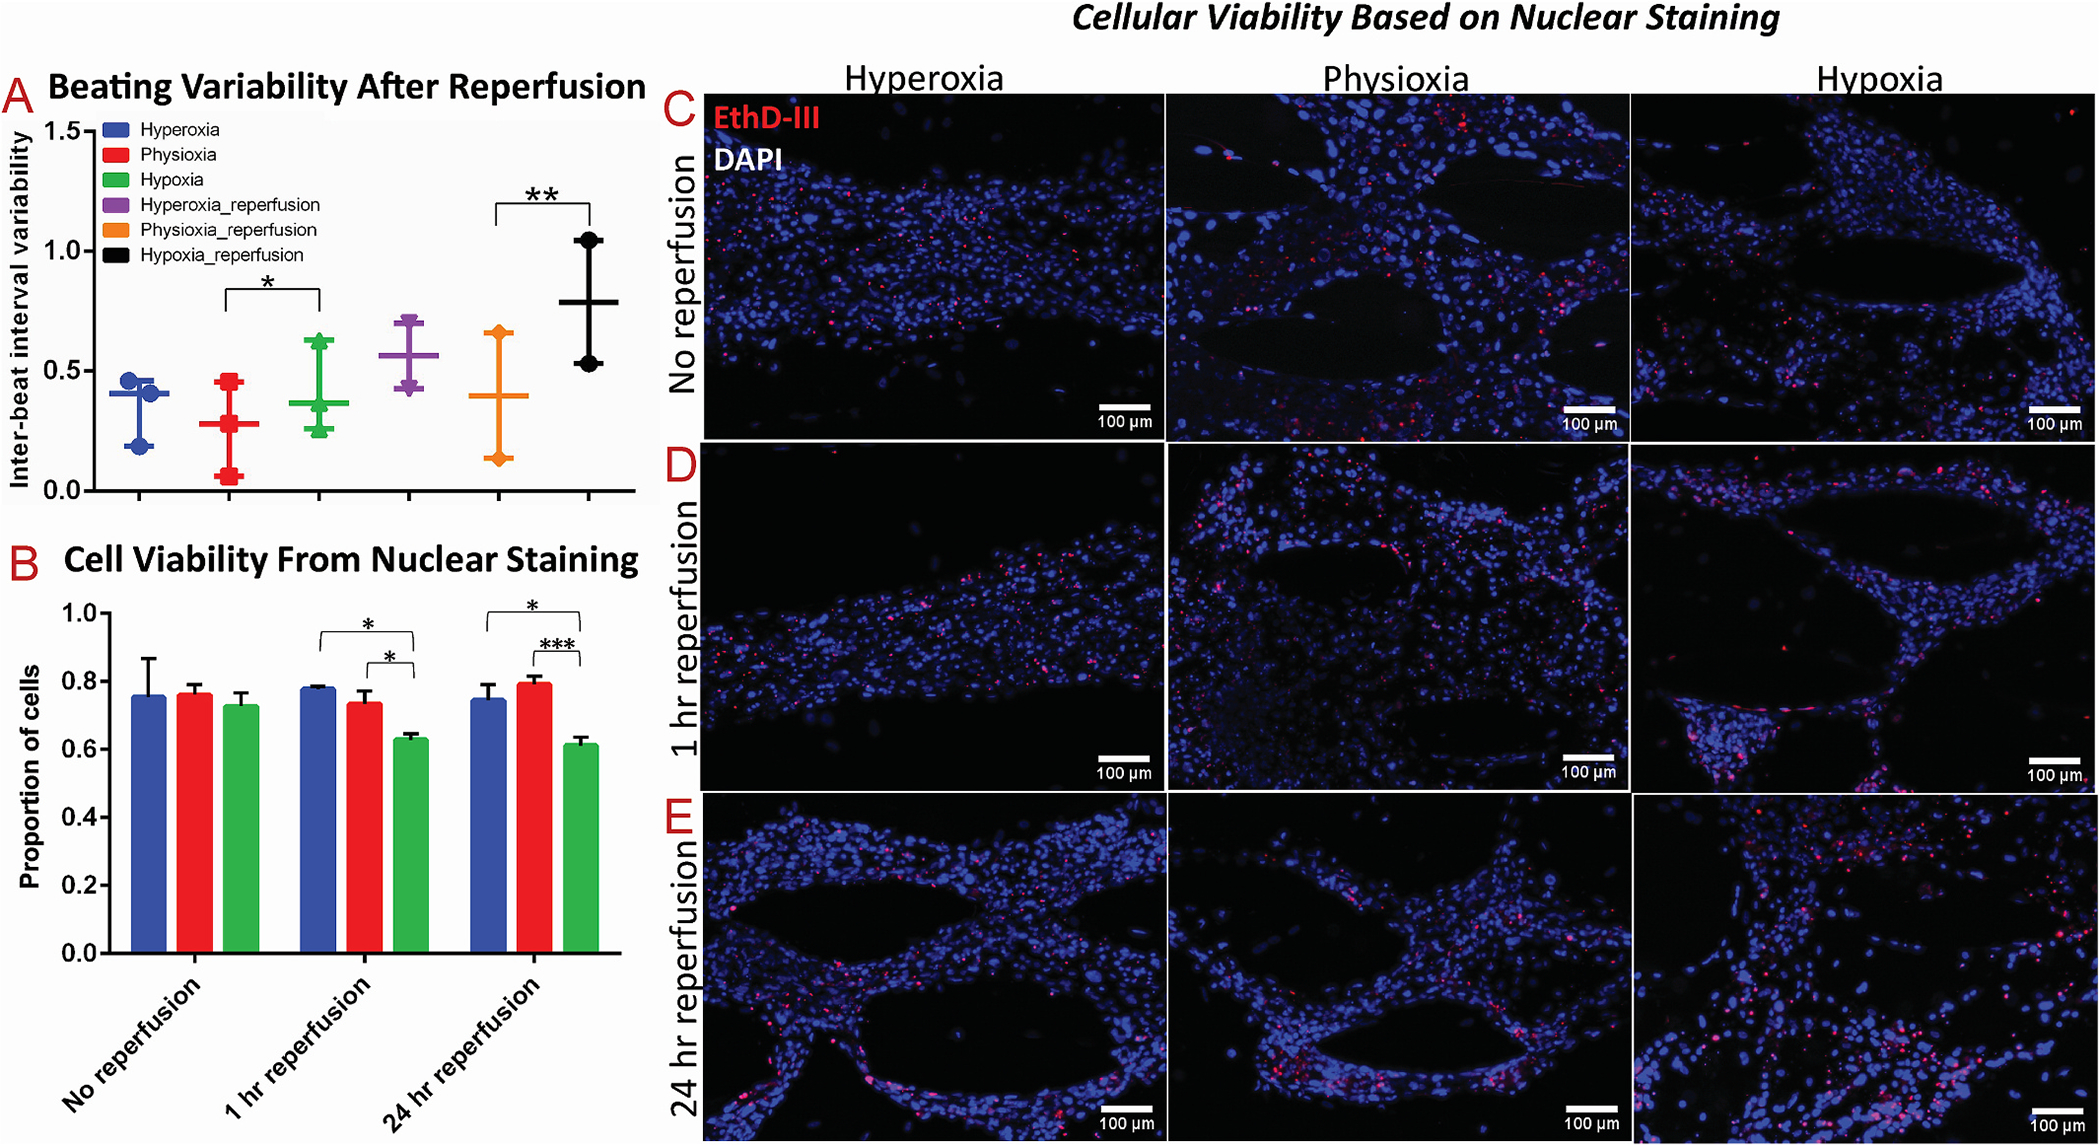
To further the physiological relevancy of this study, we investigated the effect of reperfusion on the hypoxia-exposed cardiac tissues. Specifically, after exposure of the tissues to the different oxygen conditions, they were either immediately processed (i.e., no reperfusion), the media was changed and devices were incubated for 1 h (i.e., 1 h reperfusion), or media was changed and devices were incubated for 24 h (i.e., 24 h reperfusion). The inter-beat interval variability remained significantly increased in the hypoxic tissues after 24 h of reperfusion, compared to the physioxic tissues (Fig. 7A), consistent with the trend from earlier findings of beating variability in tissues immediately after being exposed to hypoxia. It has been previously demonstrated that the reperfusion that occurs in IRI incurs a majority of the cytotoxicity observed in the heart because it results in the production of reactive oxygen species (ROS) which is a major cause of apoptosis [52]. Therefore, we hypothesized that exposure of the hypoxic cardiac tissues to either short- or long-term reperfusion would induce a cytotoxic effect. To better visualize the tissue viability, we utilized a novel method to stain the cells’ nuclei [51], instead of traditional methods that stain the cytoplasm, to identify dead cells and total cell population. Based on EthD-III and DAPI staining of tissues exposed to the different reperfusion conditions, cell viability was significantly decreased after both 1 h and 24 h of reperfusion in the hypoxia-exposed tissues, compared to both physioxic and hyperoxic tissues under reperfusion (Fig. 7B–E). Therefore, the environmental effects that are introduced from reperfusion and reoxygenation are pertinent in the induction of cytotoxicity, similar to clinical findings of the myocardial landscape after ischemia reperfusion injury [18].
Fig. 7.
The effect of acute and extended reperfusion on viability and function of 3D cardiac tissues
(A) Comparison of inter-beat interval variability of cardiac tissues after 24 h of reperfusion to cardiac tissues without reperfusion. (B–E) Viability quantification, based on nuclear staining, with red as Ethidium Homodimer-III (EthD-III) and blue as DAPI, of cardiac tissues after (C) no reperfusion, (D) 1 h of reperfusion, and (E) 24 h of reperfusion. * denotes p-value <0.05; ** denotes p-value <0.01; *** denotes p-value <0.001.
3.8. Gene expression and lactate assessment of cardiac tissues in response to reperfusion
To better understand the effects of hypoxia on cardiac tissue, as well as the role of reperfusion in IRI, we performed gene expression analysis on cardiac on-a-chip tissues after 24 h of reperfusion in the different oxygen conditions. Expression analysis on the panel of genes for hypoxia-responsive and contractile-specific genes revealed no significant changes in expression among the different oxygen conditions after reperfusion (Fig. 8A–C). This underlies the direct effect of hypoxia on gene expression, as well as the restoration of gene expression to normal levels in the absence of hypoxia, when sufficient reperfusion was allowed.
Fig. 8.
Extended reperfusion restores gene expression and lactate secretion in 3D cardiac tissues
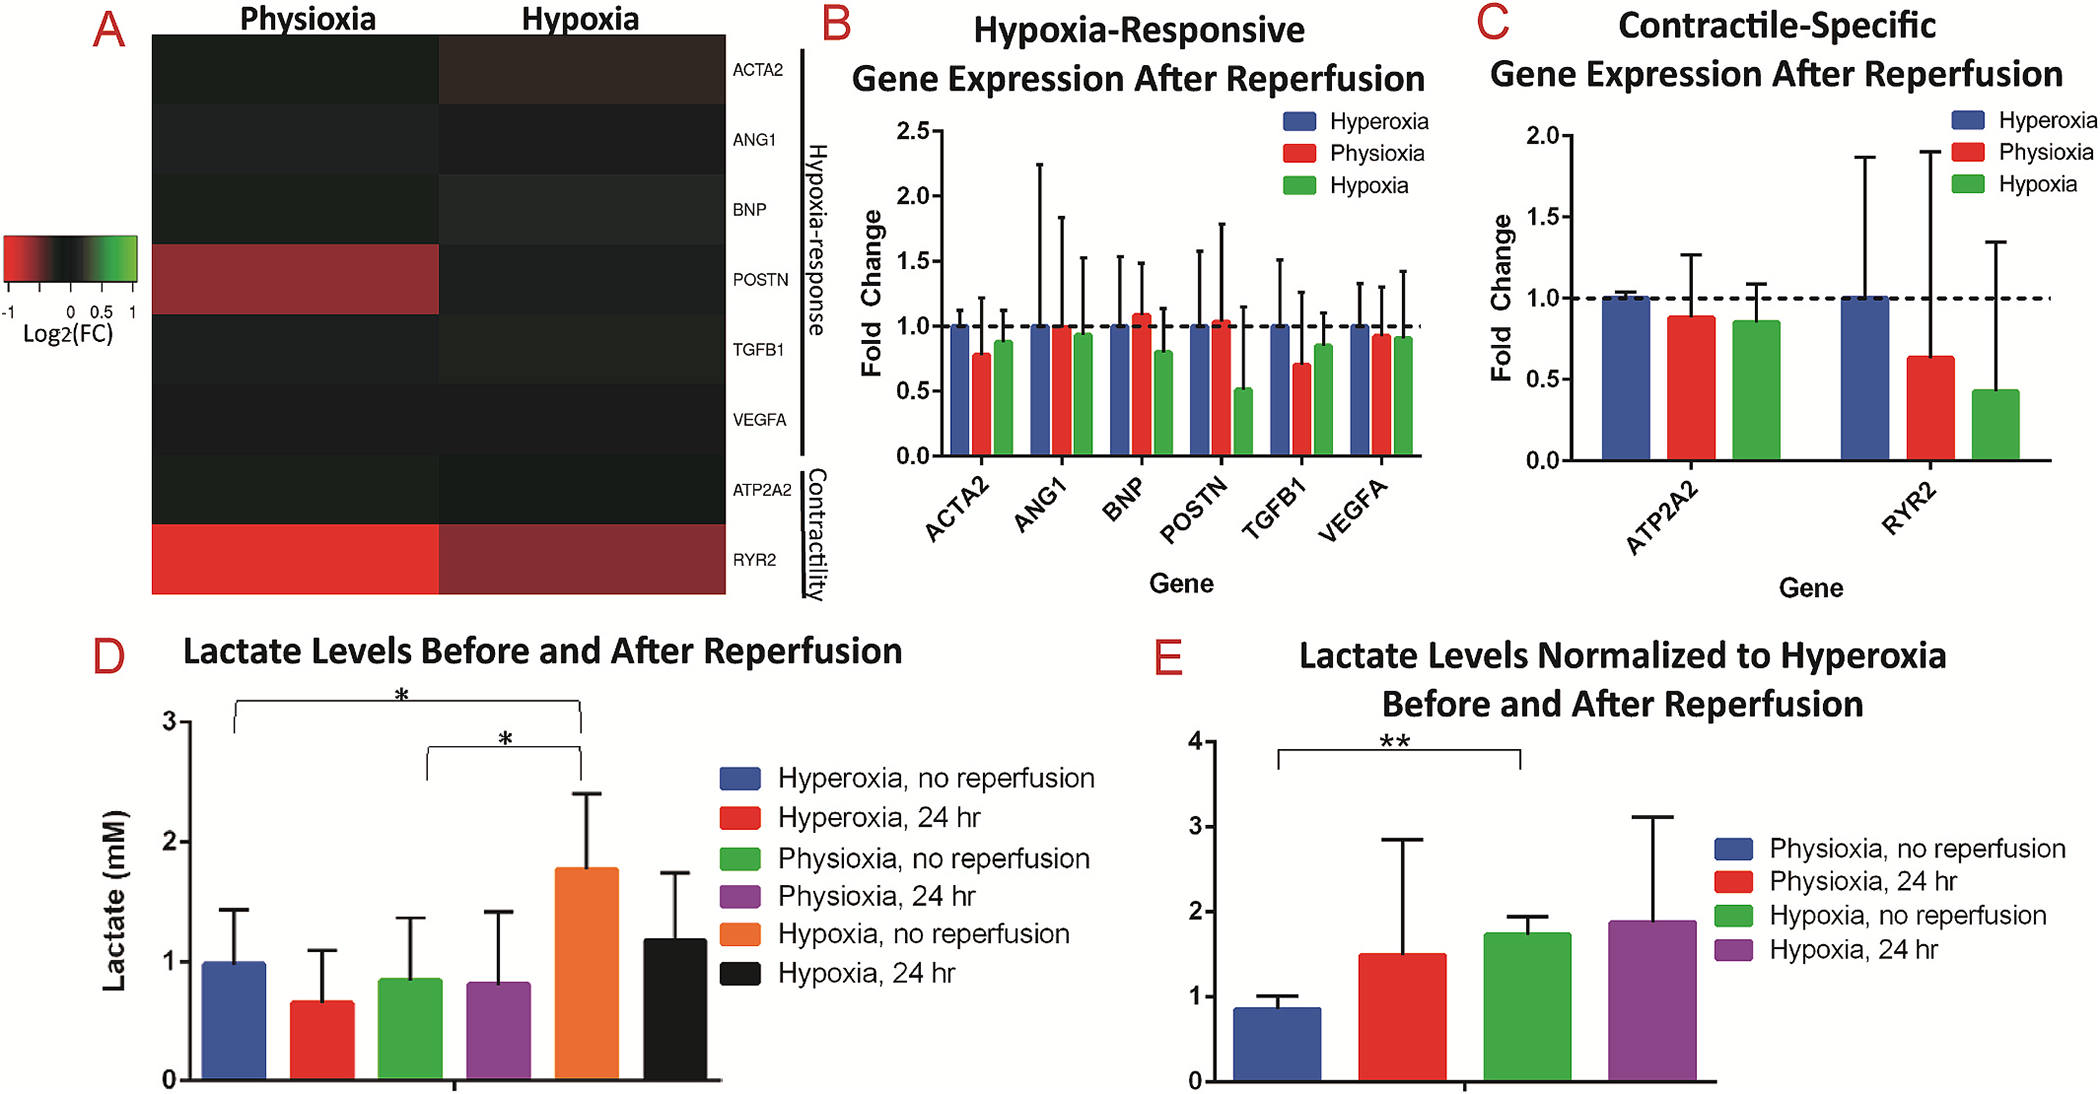
(A) Heatmap of gene expression analysis of 3D cardiac on-a-chip tissues after 24 h of reperfusion, revealing no significant differences in expression of either (B) hypoxia-responsive genes or (C) contractile-specific genes. (D) Serum lactate levels of media from 3D tissues for hyperoxia and physioxia without reperfusion were within normal levels, while hypoxia conditions had elevated serum levels. (E) Normalization of serum levels to the respective hyperoxia conditions revealed significantly elevated lactate in the hypoxia condition without reperfusion compared to physioxia without reperfusion, while there were no differences in the oxygen conditions after reperfusion. * denotes p-value <0.05; ** denotes p-value <0.01.
Further, the amount of lactate secreted by cells exposed to the hypoxia condition before reperfusion is significantly higher than both the hyperoxia and physioxia conditions (Fig. 8D). Specifically, the amount of lactate detected in the media was identified in normal physiological ranges (from 0 to 2 mM) [75] for hyperoxia and physioxia conditions (0.975 ±0.370 mM for hyperoxia; 0.841±0.430 mM for physioxia), however the hypoxic conditions had levels nearing 2 mM (1.770 ±0.514 mM). When normalized to the amount of lactate secreted in the relative hyperoxia conditions, tissues exposed to hypoxia without reperfusion had a significantly higher ratio of lactate than tissues exposed to physioxia (Fig. 8E). Interestingly, the lactate levels do not differ between the various oxygen conditions after reperfusion, demonstrating the restoration of normal lactate secretion once metabolites accumulated during ischemia are washed out and tissues are reoxygenated. This finding demonstrates further the clinical relevance of the cardiac on-a-chip platform, as lactate serum levels are observed to increase greatly during ischemia, however reduce rapidly back to normal range during reperfusion [76]. Finally, these metabolic changes have been clinically demonstrated to occur rapidly, however restoration in contractile function tends to occur gradually [18]. Therefore, as in our model, the reduction in cell viability and changes in contraction (Fig. 7) are presumably due to environmental effects that occurred during ischemia/reperfusion, such as myofibroblast differentiation, possible introduction of ROS, production of lactate, and their effects on downstream processes.
4. Discussion
Ischemic environments within the heart induce a plethora of cellular responses that in turn result in regulation of different pathways instrumental in tissue function and metabolism [6,7,14]. Such changes in the biological landscape of the heart tissue, specifically the myocardium, can prove detrimental and result in tachyarrhythmia, heart failure, and even death [4,6]. To better understand the mechanisms behind hypoxia governing an ischemic injury, multiple studies exist that involve exposure of cardiac cells to hypoxic environments, including those in 2D micromodeled environments involving animal-derived cardiomyocytes [77,78] or hPSC-CMs [79], as well as in 3D environments involving hPSC-CMs [32,57,80]. Each study presents with particular novelties and advantages, including the incorporation of electrodes to study the cardiac electrophysiology real time [78,79], the utilization of a gradient to mimic in situ dynamics [57,77], and an investigation into the role of cardiac maturation or age in disease modeling [32,80]. Here, we present the first 3D heart on-a-chip microfluidic model to our knowledge that incorporates a true physioxic condition for the study of myocardial ischemia with hiPSC-CMs, presenting with improvements in biological complexity and maturation over 2D models. Importantly, our studies also revealed the importance of 3D versus 2D culture, a concept that has been extensively observed in literature [28,29,54]. We demonstrated that exposure of 2D cultured CM:CFs to hypoxia resulted in no effect on αSMA expression, while there was significant upregulation of αSMA in 3D cardiac on-a-chip tissues in response to hypoxia. Further, hypoxia did not significantly alter the gene expression of 2D cultured cardiac cells, while tissues within the 3D cardiac on-a-chip experienced differential regulation of hypoxia-responsive and contractile-specific genes.
We also identified contractile irregularities due to exposure to hypoxia within our cardiac on-a-chip model, as well as the downregulation of genes pertinent in tissue contraction. A recent study investigated the effect of hypoxia on human cardiac organoids to model myocardial infarction, induced through chronic exposure (i.e., 10 days) to 10% O2 and norepinephrine to model the effect of partially blocked arteries for extended time on the myocardium [57]. Through utilization of organoids, a gradient of oxygen was established due to diffusion limitations, so that the organoids’ circumference experienced 10% O2 while the core was near anoxic. The authors also revealed a significant downregulation of major calcium handling genes within the hypoxia-exposed organoids, corroborating our finding of contractile dysregulation in our cardiac on-a-chip tissue model.
Further qPCR analysis in our study revealed the upregulation of known hypoxia-responsive genes, with significant changes in ACTA2 and VEGFA. However, we did not reveal a significant change in the gene expression of TGFB1 or POSTN, markers of TGFβ1 signaling. We speculate that either differential regulation of TGFβ1 may be occurring post-transcriptionally, or other types of cells in the in vivo environment greatly contribute to induction of TGFβ1 signaling. Although it has been found that most cells in the myocardium secrete TGFβ1, macrophages that infiltrate in response to myocardial injury release both TGFβ1 and ANGII in significant quantities [63,81]. Therefore, incorporation of macrophages to the platform, ideally introduced through media flow to model their infiltration via the bloodstream, will be the subject of future studies to better recapitulate the myocardial environment after ischemic injury.
To further analyze the clinical importance and biomimicry of this model system for disease modeling application, we performed molecular-level analyses through RNA-sequencing to unveil unbiased transcriptomic profiles of physioxic and hypoxic cardiac on-a-chip tissues. A myriad of pathways was revealed to be tightly regulated in a similar fashion as observed in literature in response to hypoxia and clinically in response to myocardial ischemia. Importantly, we investigated transcriptional alterations in the comparison of physioxic (5% O2) to hypoxic (1% O2) tissues. Particularly, our results demonstrate that the lack of oxygen in 1% O2 conditions led to the downregulation of oxidative phosphorylation and thus to upregulation of glycolysis and other anaerobic metabolic pathways to fulfill ATP deficits, consistent with our finding of increased serum levels of lactate in hypoxic tissues. Additionally, the hypoxic environment resulted in the downregulation of many regulatory pathways in the cells, including DNA machinery and protein regulation. Therefore, transcriptomic analysis between physioxic and hypoxic tissues revealed a pattern in regulation of a multitude of pathways that is both parallel to observations in other cell types in literature, and also observed as clinical responses to myocardial ischemia. The use of 5% O2 for physioxic conditions is a novelty in our study, compared to the previous studies mentioned for in vitro modeling of myocardial ischemia.
Our investigations into tissue integrity revealed no effect on viability nor alignment in tissues exposed to hypoxia for 24 h without reperfusion, demonstrating that exposure to hypoxia does not induce necrosis or apoptosis to a significant effect. However, in our model when hypoxia is extended to 48 h, or when the tissues are exposed to media reperfusion and tissue reoxygenation for both short- and long-term durations (1 h vs 24 h), the tissues that were exposed to hypoxia exhibited decreased cell viability in comparison to hyperoxic and physioxic tissues. Similar to previous observations during IRI [52], reperfusion, although critical for patient survival, re-establishes oxygen levels and aids in washing out metabolites that are accumulated during ischemia, can initiate biological cascades that are detrimental to cell and tissue function. We herein demonstrate that reperfusion of hypoxic tissues proved to revert gene expression levels of hypoxia-responsive and contractile-specific genes back to normal, as well as re-establish normal lactate levels. On the other hand, in addition to significantly decreased levels of cell viability, we identified sustained contractile dysregulation in hypoxic tissues, even following 24 h of reperfusion. To that end, we demonstrate some of the complex, biological responses of ischemic myocardial tissue in response to reperfusion.
To attempt to reduce the tissue damage from IRI, ischemic pre-conditioning has been a subject of prior studies [82]. Therefore, our future studies could further focus on the role of ischemia pre-conditioning on development of injury after reperfusion. Importantly, the microfluidic nature of the model could be leveraged in its capability for constant media flow. To advance the complexity of the model, we plan to incorporate fluid flow in the next generation to simulate blood flow through the tissue. Particularly, fluid flow would be incorporated throughout the culture of maturation of tissues (i.e., 13 days). During ischemia, the flow would be halted to allow for buildup of metabolic waste due to lack of washout, then the media flow would be reintroduced to measure reperfusion injury. Another advantage of the use of a microfluidic model is in its ability to induce a gradient of hypoxia and nutrient diffusion across the channel, to better model the differential gradient that is experienced in the various layers of the heart (i.e., epicardium, myocardium, and endocardium).
In summary, we demonstrate the development of a myocardial ischemia model using an anisotropic 3D cardiac on-a-chip platform. Additionally, the design of the platform derives great potential for future studies to enhance the clinical relevance and complexity of the described microfluidic model of myocardial ischemia on-a-chip.
5. Conclusion
In this work, we developed an experimentally simple model of myocardial ischemia through the exposure of 3D co-cultured cardiac tissues within optimized microfluidic devices to varying levels of oxygen for 24 h. In response to hypoxia, we demonstrated the induction of fibrosis through upregulation of αSMA expression within the cardiac on-a-chip tissues, which was not apparent in 2D cultured cardiac cells. Additionally, we demonstrated the detrimental effect of hypoxia on synchronous contraction, particularly in comparison of physioxic to hypoxic tissues, through quantification of inter-beat interval variability. However, neither the anisotropic nature of the cardiac tissues nor their viability were affected through exposure to hypoxic environments for 24 h, suggesting the importance of hypoxia duration as well as the clinical role of reperfusion in ischemic injury in the induction of cytotoxicity. We further performed transcriptional analysis through qPCR to verify the biological response of hypoxic tissues, and additionally investigated the transcriptomic profiles through RNA-sequencing of hypoxic and physioxic tissues. Particularly, we identified the upregulation of glycolysis and corresponding downregulation of oxidative phosphorylation in tissues exposed to 1% O2 compared to those exposed to 5% O2. These findings were further corroborated with the identification of increased lactate levels in hypoxic tissues compared to both hyperoxic and physioxic tissues. We also identified the downregulation of multiple regulatory pathways in response to hypoxia, including those involved in DNA replication, DNA repair, and proteasomal activity. In conclusion, the described ischemic heart on-a-chip model serves as a fundamental step for the study of ischemic cardiac tissues that result in direct response to hypoxia as well as the tissues’ response to reperfusion.
Supplementary Material
Acknowledgements
We would like to thank National Science Foundation (NSF) CAREER Award #1653193, Flinn Foundation Award, and ABRC New Investigator Award (ADHS18-198872) for providing funding sources for this project. We would like to thank Prof. Barbara Smith who provided us with access to qTower 2.0 and Azure C400 for qPCR monitoring, analysis, and validation.
Footnotes
Declaration of competing interest
The authors declare that they have no known competing financial interests or personal relationships that could have appeared to influence the work reported in this paper.
Appendix A. Supplementary data
Supplementary data to this article can be found online at https://doi.org/10.1016/j.biomaterials.2021.121336.
Data availability
The raw and processed data required to reproduce these findings are available upon request from authors.
References
- [1].Heidenreich PA, Trogdon JG, Khavjou OA, Butler J, Dracup K, Ezekowitz MD, Finkelstein EA, Hong Y, Johnston SC, Khera A, Lloyd-Jones DM, Nelson SA, Nichol G, Orenstein D, Wilson PW, Woo YJ, American Heart Association Advocacy Coordinating C., Stroke C, Council on Cardiovascular R., Intervention, Council on Clinical C., Council on, Prevention E., Council on, Thrombosis A, Vascular B, Council on C., Critical C., Perioperative, Resuscitation, N. Council on Cardiovascular, D. Council on the Kidney in Cardiovascular, S. Council on Cardiovascular, Anesthesia, C, Interdisciplinary council on quality of, R. Outcomes, forecasting the future of cardiovascular disease in the United States: a policy statement from the American heart association, Circulation 123 (8) (2011) 933–944. [DOI] [PubMed] [Google Scholar]
- [2].Virani SS, Alonso A, Benjamin EJ, Bittencourt MS, Callaway CW, Carson AP, Chamberlain AM, Chang AR, Cheng S, Delling FN, Djousse L, Elkind MSV, Ferguson JF, Fornage M, Khan SS, Kissela BM, Knutson KL, Kwan TW, Lackland DT, Lewis TT, Lichtman JH, Longenecker CT, Loop MS, Lutsey PL, Martin SS, Matsushita K, Moran AE, Mussolino ME, Perak AM, Rosamond WD, Roth GA, Sampson UKA, Satou GM, Schroeder EB, Shah SH, Shay CM, Spartano NL, Stokes A, Tirschwell DL, VanWagner LB, Tsao CW, American Heart Association Council on E, Prevention Statistics C, Stroke Statistics S, Heart disease and stroke statistics-2020 update: a report from the American heart association, Circulation 141 (9) (2020) e139–e596. [DOI] [PubMed] [Google Scholar]
- [3].Underlying Cause of Death, 1999–2018, CDC WONDER: Online Database, Centers for Disease Control and Preventation, 2020. [Google Scholar]
- [4].Ghuran AV, Camm AJ, Ischaemic heart disease presenting as arrhythmias, Br. Med. Bull. 59 (2001) 193–210. [DOI] [PubMed] [Google Scholar]
- [5].Lu L, Liu M, Sun R, Zheng Y, Zhang P, Myocardial infarction: symptoms and treatments, Cell Biochem. Biophys. 72 (3) (2015) 865–867. [DOI] [PubMed] [Google Scholar]
- [6].Nag AC, Study of non-muscle cells of the adult mammalian heart: a fine structural analysis and distribution, Cytobios 28 (109) (1980) 41–61. [PubMed] [Google Scholar]
- [7].Crossman DC, The pathophysiology of myocardial ischemia, Heart 90 (5) (2004) 576–580. [DOI] [PMC free article] [PubMed] [Google Scholar]
- [8].Kalogeris T, Baines CP, Krenz M, Korthuis RJ, Cell biology of ischemia/reperfusion injury, Int Rev Cell Mol Biol 298 (2012) 229–317. [DOI] [PMC free article] [PubMed] [Google Scholar]
- [9].Chen S, Li S, The Na+/Ca2+ exchanger in cardiac ischemia/reperfusion injury, Med. Sci. Monit. 18 (11) (2012) RA161–RA165. [DOI] [PMC free article] [PubMed] [Google Scholar]
- [10].Nayler WG, The role of calcium in the ischemic myocardium, Am. J. Pathol. 102 (1981) 262–270. [PMC free article] [PubMed] [Google Scholar]
- [11].Carmeliet E, Cardiac ionic currents and acute ischemia: from channels to arrhythmias, Physiol. Rev. 79 (3) (1999) 917–1017. [DOI] [PubMed] [Google Scholar]
- [12].Agrawal V, Gupta JK, Qureshi SS, Vishwakarma VK, Role of cardiac renin angiotensin system in ischemia reperfusion injury and preconditioning of heart, Indian Heart J. 68 (6) (2016) 856–861. [DOI] [PMC free article] [PubMed] [Google Scholar]
- [13].Renstrom B, Liedtke AJ, Nellis SH, Mechanisms of substrate preference for oxidative metabolism during early myocardial reperfusion, Am. J. Physiol. 259 (2 Pt 2) (1990) H317–H323. [DOI] [PubMed] [Google Scholar]
- [14].Katz AM, Effects of ischemia on the contractile processes of heart muscle, Am. J. Cardiol. 32 (4) (1973) 456–460. [DOI] [PubMed] [Google Scholar]
- [15].Jennings RB, Reimer KA, Steenbergen C, Myocardial ischemia revisited. The osmolar load, membrane damage, and reperfusion, J. Mol. Cell. Cardiol. 18 (8) (1986) 769–780. [DOI] [PubMed] [Google Scholar]
- [16].Francis Stuart SD, De Jesus NM, Lindsey ML, Ripplinger CM, The crossroads of inflammation, fibrosis, and arrhythmia following myocardial infarction, J. Mol. Cell. Cardiol. 91 (2016) 114–122. [DOI] [PMC free article] [PubMed] [Google Scholar]
- [17].Abe H, Semba H, Takeda N, The roles of hypoxia signaling in the pathogenesis of cardiovascular diseases, J. Atherosclerosis Thromb. 24 (9) (2017) 884–894. [DOI] [PMC free article] [PubMed] [Google Scholar]
- [18].Frank A, Bonney M, Bonney S, Weitzel L, Koeppen M, Eckle T, Myocardial ischemia reperfusion injury: from basic science to clinical bedside, Semin. CardioThorac. Vasc. Anesth. 16 (3) (2012) 123–132. [DOI] [PMC free article] [PubMed] [Google Scholar]
- [19].Ng FS, Holzen KM, Koppel AC, Janks D, Gordon F, Wit AL, Peters NS, Efimov IR, Adverse remodeling of the electrophysiological response to ischemia-reperfusion in human heart failure is associated with remodeling of metabolic gene expression, Circ. Arrhythm. Electrophysiol. 7 (5) (2014) 875–882. [DOI] [PMC free article] [PubMed] [Google Scholar]
- [20].Jugdutt BI, Apoptosis after reperfused myocardial infarction: role of angiotensin II, Exp. Clin. Cardiol. 9 (4) (2004) 219–228. [PMC free article] [PubMed] [Google Scholar]
- [21].Sanada S, Komuro I, Kitakaze M, Pathophysiology of myocardial reperfusion injury: preconditioning, postconditioning, and translational aspects of protective measures, Am. J. Physiol. Heart Circ. Physiol. 301 (5) (2011) H1723–H1741. [DOI] [PubMed] [Google Scholar]
- [22].Saraf A, Rampoldi A, Chao M, Li D, Armand L, Hwang H, Liu R, Jha R, Fu H, Maxwell JT, Xu C, Functional and molecular effects of TNF-alpha on human iPSC-derived cardiomyocytes, Stem Cell Res. 52 (2021) 102218. [DOI] [PMC free article] [PubMed] [Google Scholar]
- [23].Hackam DG, Redelmeier DA, Translation of research evidence from animals to humans, JAMA 296 (14) (2006) 1731–1732. [DOI] [PubMed] [Google Scholar]
- [24].Cutts J, Nikkhah M, Brafman DA, Biomaterial approaches for stem cell-based myocardial tissue engineering, Biomark. Insights 10 (Suppl 1) (2015) 77–90. [DOI] [PMC free article] [PubMed] [Google Scholar]
- [25].Yang X, Pabon L, Murry CE, Engineering adolescence: maturation of human pluripotent stem cell–derived cardiomyocytes, Circ. Res. 114 (2014) 511–523. [DOI] [PMC free article] [PubMed] [Google Scholar]
- [26].Veerman CC, Kosmidis G, Mummery CL, Casini S, Verkerk AO, Bellin M, Immaturity of human stem-cell-derived cardiomyocytes in culture: fatal flaw or soluble problem? Stem Cell. Dev. 24 (9) (2015) 1035–1052. [DOI] [PubMed] [Google Scholar]
- [27].Jiang Y, Park P, Hong SM, Ban K, Maturation of cardiomyocytes derived from human pluripotent stem cells: current strategies and limitations, Mol. Cell. 41 (7) (2018) 613–621. [DOI] [PMC free article] [PubMed] [Google Scholar]
- [28].Veldhuizen J, Migrino RQ, Nikkhah M, Three-dimensional microengineered models of human cardiac diseases, J. Biol. Eng. 13 (2019) 29. [DOI] [PMC free article] [PubMed] [Google Scholar]
- [29].Patino-Guerrero A, Veldhuizen J, Zhu W, Migrino RQ, Nikkhah M, Three-dimensional scaffold-free microtissues engineered for cardiac repair, J. Mater. Chem. B 8 (34) (2020) 7571–7590. [DOI] [PMC free article] [PubMed] [Google Scholar]
- [30].Hidalgo A, Glass N, Ovchinnikov D, Yang S, Zhang X, Mazzone S, Chen C, Wolvetang E, Cooper-White J, Modelling ischemia-reperfusion injury (IRI) in vitro using metabolically matured induced pluripotent stem cell-derived cardiomyocytes, APL Bioeng. 2 (2) (2018), 026102. [DOI] [PMC free article] [PubMed] [Google Scholar]
- [31].Coles JG, Boscarino C, Takahashi M, Grant D, Chang A, Ritter J, Dai X, Du C, Musso G, Yamabi H, Goncalves J, Kumar AS, Woodgett J, Lu H, Hannigan G, Cardioprotective stress response in the human fetal heart, J. Thorac. Cardiovasc. Surg. 129 (5) (2005) 1128–1136. [DOI] [PMC free article] [PubMed] [Google Scholar]
- [32].Chen T, Vunjak-Novakovic G, Human tissue-engineered model of myocardial ischemia-reperfusion injury, Tissue Eng. 25 (9–10) (2019) 711–724. [DOI] [PMC free article] [PubMed] [Google Scholar]
- [33].Graham RM, Frazier DP, Thompson JW, Haliko S, Li H, Wasserlauf BJ, Spiga MG, Bishopric NH, Webster KA, A unique pathway of cardiac myocyte death caused by hypoxia-acidosis, J. Exp. Biol. 207 (Pt 18) (2004) 3189–3200. [DOI] [PubMed] [Google Scholar]
- [34].Talman V, Ruskoaho H, Cardiac fibrosis in myocardial infarction-from repair and remodeling to regeneration, Cell Tissue Res. 365 (3) (2016) 563–581. [DOI] [PMC free article] [PubMed] [Google Scholar]
- [35].Porter KE, Turner NA, Cardiac fibroblasts: at the heart of myocardial remodeling, Pharmacol. Therapeut. 123 (2009) 255–278. [DOI] [PubMed] [Google Scholar]
- [36].Zhao H, Li X, Zeng Y, Zhao L, Ding H, Sun W, Du Y, Microengineered in vitro model of cardiac fibrosis through modulating myofibroblast mechanotransduction, Biofabrication 6 (2014), 045009. [DOI] [PubMed] [Google Scholar]
- [37].Elson EL, Qian H, Fee JA, Wakatsuki T, A model for positive feedback control of the transformation of fibroblasts to myofibroblasts, Prog. Biophys. Mol. Biol. 144 (2019) 30–40. [DOI] [PMC free article] [PubMed] [Google Scholar]
- [38].Watson CJ, Collier P, Tea I, Neary R, Watson JA, Robinson C, Phelan D, Ledwidge MT, McDonald KM, McCann A, Sharaf O, Baugh JA, Hypoxia-induced epigenetic modifications are associated with cardiac tissue fibrosis and the development of a myofibroblast-like phenotype, Hum. Mol. Genet. 23 (8) (2014) 2176–2188. [DOI] [PubMed] [Google Scholar]
- [39].van den Borne SW, Diez J, Blankesteijn WM, Verjans J, Hofstra L, Narula J, Myocardial remodeling after infarction: the role of myofibroblasts, Nat. Rev. Cardiol. 7 (1) (2010) 30–37. [DOI] [PubMed] [Google Scholar]
- [40].Opie LH, Commerford PJ, Gersh BJ, Pfeffer MA, Controversies in ventricular remodelling, Lancet 367 (9507) (2006) 356–367. [DOI] [PubMed] [Google Scholar]
- [41].Veldhuizen J, Cutts J, Brafman DA, Migrino RQ, Nikkhah M, Engineering anisotropic human stem cell-derived three-dimensional cardiac tissue on-a-chip, Biomaterials 256 (2020) 120195. [DOI] [PubMed] [Google Scholar]
- [42].Veldhuizen J, Nikkhah M, Developing 3D organized human cardiac tissue within a microfluidic platform, JoVE 172 (2021). [DOI] [PubMed] [Google Scholar]
- [43].Johnson RD, Camelliti P, Role of non-myocyte gap junctions and connexin hemichannels in cardiovascular health and disease: novel therapeutic targets? Int. J. Mol. Sci. 19 (3) (2018) 866. [DOI] [PMC free article] [PubMed] [Google Scholar]
- [44].Winegrad S, Henrion D, Rappaport L, Samuel JL, Self-protection by cardiac myocytes against hypoxia and hyperoxia, Circ. Res. 85 (8) (1999) 690–698. [DOI] [PubMed] [Google Scholar]
- [45].Ugolini GS, Pavesi A, Rasponi M, Fiore GB, Kamm R, Soncini M, Human cardiac fibroblasts adaptive responses to controlled combined mechanical strain and oxygen changes in vitro, Elife 6 (2017). [DOI] [PMC free article] [PubMed] [Google Scholar]
- [46].Truong D, Fiorelli R, Barrientos ES, Melendez EL, Sanai N, Mehta S, Nikkhah M, A three-dimensional (3D) organotypic microfluidic model for glioma stem cells - vascular interactions, Biomaterials 198 (2019) 63–77. [DOI] [PMC free article] [PubMed] [Google Scholar]
- [47].Peela N, Barrientos ES, Truong D, Mouneimne G, Nikkhah M, Effect of suberoylanilide hydroxamic acid (SAHA) on breast cancer cells within a tumor–stroma microfluidic model, Int. Bio. 9 (12) (2017). [DOI] [PubMed] [Google Scholar]
- [48].Truong DD, Kratz A, Park JG, Barrientos ES, Saini H, Nguyen T, Pockaj B, Mouneimne G, LaBaer J, Nikkhah M, A human organotypic microfluidic tumor model permits investigation of the interplay between patient-derived fibroblasts and breast cancer cells, Cancer Res. 79 (12) (2019) 3139–3151. [DOI] [PMC free article] [PubMed] [Google Scholar]
- [49].Nagaraju S, Truong D, Mouneimne G, Nikkhah M, Microfluidic tumor–vascular model to study breast cancer cell invasion and intravasation, Adv. Healthc. Mater. 7 (9) (2018). [DOI] [PubMed] [Google Scholar]
- [50].Yu J, Vodyanik MA, Smuga-Otto K, Antosiewicz-Bourget J, Frane JL, Tian S, Nie J, Jonsdottir GA, Ruotti V, Stewart R, Slukvin II JA Thomson, Induced pluripotent stem cell lines derived from human somatic cells, Science 318 (5858) (2007) 1917–1920. [DOI] [PubMed] [Google Scholar]
- [51].Ong LJY, Zhu L, Tan GJS, Toh YC, Quantitative image-based cell viability (QuantICV) assay for microfluidic 3D tissue culture applications, Micromachines 11 (7) (2020) 669. [DOI] [PMC free article] [PubMed] [Google Scholar]
- [52].Webster KA, Discher DJ, Kaiser S, Hernandez O, Sato B, Bishopric NH, Hypoxia-activated apoptosis of cardiac myocytes requires reoxygenation or a pH shift and is independent of p53, J. Clin. Invest. 104 (1999) 239–252. [DOI] [PMC free article] [PubMed] [Google Scholar]
- [53].Li M, Wu J, Hu G, Song Y, Shen J, Xin J, Li Z, Liu W, Dong E, Xu M, Zhang Y, Xiao H, Pathological matrix stiffness promotes cardiac fibroblast differentiation through the POU2F1 signaling pathway, Sci. China Life Sci. 64 (2020) 242–254. [DOI] [PubMed] [Google Scholar]
- [54].Mosqueira D, Mannhardt I, Bhagwan JR, Lis-Slimak K, Katili P, Scott E, Hassan M, Prondzynski M, Harmer SC, Tinker A, Smith JGW, Carrier L, Williams PM, Gaffney D, Eschenhagen T, Hansen A, Denning C, CRISPR/Cas9 editing in human pluripotent stem cell-cardiomyocytes highlights arrhythmias, hypocontractility, and energy depletion as potential therapeutic targets for hypertrophic cardiomyopathy, Eur. Heart J. 39 (43) (2018) 3879–3892. [DOI] [PMC free article] [PubMed] [Google Scholar]
- [55].Ross J Jr., Myocardial perfusion-contraction matching. Implications for coronary heart disease and hibernation, Circulation 83 (3) (1991) 1076–1083. [DOI] [PubMed] [Google Scholar]
- [56].Katare RG, Ando M, Kakinuma Y, Sato T, Engineered heart tissue: a novel tool to study the ischemic changes of the heart in vitro, PLoS One 5 (2) (2010), e9275. [DOI] [PMC free article] [PubMed] [Google Scholar]
- [57].Richards DJ, Li Y, Kerr CM, Yao J, Beeson GC, Coyle RC, Chen X, Jia J, Damon B, Wilson R, Starr Hazard E, Hardiman G, Menick DR, Beeson CC, Yao H, Ye T, Mei Y, Human cardiac organoids for the modelling of myocardial infarction and drug cardiotoxicity, Nat. Biomed. Eng. 4 (4) (2020) 446–462. [DOI] [PMC free article] [PubMed] [Google Scholar]
- [58].Chi NC, Karliner JS, Molecular determinants of responses to myocardial ischemia/reperfusion injury: focus on hypoxia-inducible and heat shock factors, Cardiovasc. Res. 61 (3) (2004) 437–447. [DOI] [PubMed] [Google Scholar]
- [59].Semenza GL, Hypoxia-inducible factor 1 and cardiovascular disease, Annu. Rev. Physiol. 76 (2014) 39–56. [DOI] [PMC free article] [PubMed] [Google Scholar]
- [60].Bassan R, Potsch A, Maisel A, Tura B, Villacorta H, Nogueira MV, Campos A, Gamarski R, Masetto AC, Moutinho MA, B-type natriuretic peptide: a novel early blood marker of acute myocardial infarction in patients with chest pain and no ST-segment elevation, Eur. Heart J. 26 (2005) 234–240. [DOI] [PubMed] [Google Scholar]
- [61].Morita E, Yasue H, Yoshimura M, Ogawa H, Jougasaki M, Matsumura T, Mukoyama M, Nakao K, Increased plasma levels of brain natriuretic peptide in patients with acute myocardial infarction, Circulation 88 (1) (1993) 82–91. [DOI] [PubMed] [Google Scholar]
- [62].Casals G, Ros J, Sionis A, Davidson MM, Morales-Ruiz M, Jimenez W, Hypoxia induces B-type natriuretic peptide release in cell lines derived from human cardiomyocytes, Am. J. Physiol. Heart Circ. Physiol. 297 (2) (2009) H550–H555. [DOI] [PubMed] [Google Scholar]
- [63].Liu G, Ma C, Yang H, Zhang PY, Transforming growth factor β and its role in heart disease, Exp. Ther. Med. 13 (5) (2017) 2123–2128. [DOI] [PMC free article] [PubMed] [Google Scholar]
- [64].Horiuchi K, Amizuka N, Takeshita S, Takamatsu H, Katsuura M, Ozawa H, Toyama Y, Bonewald LF, Kudo A, Identification and characterization of a novel protein, periostin, with restricted expression to periosteum and periodontal ligament and increased expression by transforming growth factor beta, J. Bone Miner. Res. 14 (7) (1999) 1239–1249. [DOI] [PubMed] [Google Scholar]
- [65].Landry NM, Cohen S, Dixon IMC, Periostin in cardiovascular disease and development: a tale of two distinct roles, Basic Res. Cardiol. 113 (1) (2018) 1. [DOI] [PubMed] [Google Scholar]
- [66].Leenen FH, Skarda V, Yuan B, White R, Changes in cardiac ANG II postmyocardial infarction in rats: effects of nephrectomy and ACE inhibitors, Am. J. Physiol. 276 (1) (1999) H317–H325. [DOI] [PubMed] [Google Scholar]
- [67].Seo Y, Kinsella TJ, Essential role of DNA base excision repair on survival in an acidic tumor microenvironment, Cancer Res. 69 (18) (2009) 7285–7293. [DOI] [PMC free article] [PubMed] [Google Scholar]
- [68].Koshiji M, To KKW, Hammer S, Kumamoto K, Harris AL, Modrich P, Huang LE, HIF-1a induces genetic instability by transcriptionally downregulating MutSa expression, Mol. Cell 17 (2005) 793–803. [DOI] [PubMed] [Google Scholar]
- [69].To KW, Sedelnikova OA, Samons M, Bonner WM, Huang LE, The phosphorylation status of PAS-B distinguishes HIF-1α from HIF-2α in NBS1 repression, Eur. Mol. Bio. Org. 25 (2006) 4784–4794. [DOI] [PMC free article] [PubMed] [Google Scholar]
- [70].Begg K, Tavassoli M, Inside the hypoxic tumour: reprogramming of the DDR and radioresistance, Cell Death Discovery 6 (2020) 77. [DOI] [PMC free article] [PubMed] [Google Scholar]
- [71].Ng N, Purshouse K, Foskolou IP, Olcina MM, Hammond EM, Challenges to DNA replication in hypoxic conditions, FEBS J. 285 (9) (2018) 1563–1571. [DOI] [PubMed] [Google Scholar]
- [72].Prabhakar NR, Semenza GL, Oxygen sensing and homeostasis, Physiology 30 (2015) 340–348. [DOI] [PMC free article] [PubMed] [Google Scholar]
- [73].Hubbi ME, Kshitiz, Gilkes DM, Rey S, Wong CC, Luo W, Kim DH, Dang CV, Levchenko A, Semenza GL, A nontranscriptional role for HIF-1α as a direct inhibitor of DNA replication, Sci. Signal. 6 (262) (2013) ra10. [DOI] [PMC free article] [PubMed] [Google Scholar]
- [74].Abu-El-Rub E, Sequiera GL, Sareen N, Yan W, Moudgil M, Sabbir MG, Dhingra S, Hypoxia-induced 26S proteasome dysfunction increases immunogenicity of mesenchymal stem cells, Cell Death Dis. 10 (2) (2019) 90. [DOI] [PMC free article] [PubMed] [Google Scholar]
- [75].Nimmo GR, Mackenzie SJ, Walker SW, Catnach J, Nicol M, Armstrong IR, Grant IS, The relationship of blood lactate concentrations, oxygen delivery and oxygen consumption in septic shock and the adult respiratory distress syndrome, Anaesthesia 47 (12) (1992) 1023–1028. [DOI] [PubMed] [Google Scholar]
- [76].Van Wylen DG, Effect of ischemic preconditioning on interstitial purine metabolite and lactate accumulation during myocardial ischemia, Circulation 89 (5) (1994) 2283–2289. [DOI] [PubMed] [Google Scholar]
- [77].Ren L, Liu W, Wang Y, Wang JC, Tu Q, Xu J, Liu R, Shen SF, Wang J, Investigation of hypoxia-induced myocardial injury dynamics in a tissue interface mimicking microfluidic device, Anal. Chem. 85 (1) (2013) 235–244. [DOI] [PubMed] [Google Scholar]
- [78].Liu H, Bolonduro OA, Hu N, Ju J, Rao AA, Duffy BM, Huang Z, Black LD, Timko BP, Heart-on-a-Chip model with integrated extra- and intracellular bioelectronics for monitoring cardiac electrophysiology under acute hypoxia, Nano Lett. 20 (4) (2020) 2585–2593. [DOI] [PubMed] [Google Scholar]
- [79].Oleaga C, Jalilvand G, Legters G, Martin C, Ekman G, McAleer CW, Long CJ, Hickman JJ, A human in vitro platform for the evaluation of pharmacology strategies in cardiac ischemia, APL Bioeng. 3 (3) (2019), 036103. [DOI] [PMC free article] [PubMed] [Google Scholar]
- [80].Acun A, Nguyen TD, Zorlutuna P, In vitro aged, hiPSC-origin engineered heart tissue models with age-dependent functional deterioration to study myocardial infarction, Acta Biomater. 94 (2019) 372–391. [DOI] [PMC free article] [PubMed] [Google Scholar]
- [81].Shinde AV, Frangogiannis NG, Fibroblasts in myocardial infarction: a role in inflammation and repair, J. Mol. Cell. Cardiol. 70 (2014) 74–82. [DOI] [PMC free article] [PubMed] [Google Scholar]
- [82].Yadid M, Lind JU, Ardona HAM, Sheehy SP, Dickinson LE, Eweje F, Bastings MMC, Pope B, O’Connor BB, Straubhaar JR, Budnik B, Kleber AG, Parker KK, Endothelial extracellular vesicles contain protective proteins and rescue ischemia-reperfusion injury in a human heart-on-chip, Sci. Transl. Med. 12 (565) (2020), eaax8005. [DOI] [PMC free article] [PubMed] [Google Scholar]
Associated Data
This section collects any data citations, data availability statements, or supplementary materials included in this article.
Supplementary Materials
Data Availability Statement
The raw and processed data required to reproduce these findings are available upon request from authors.