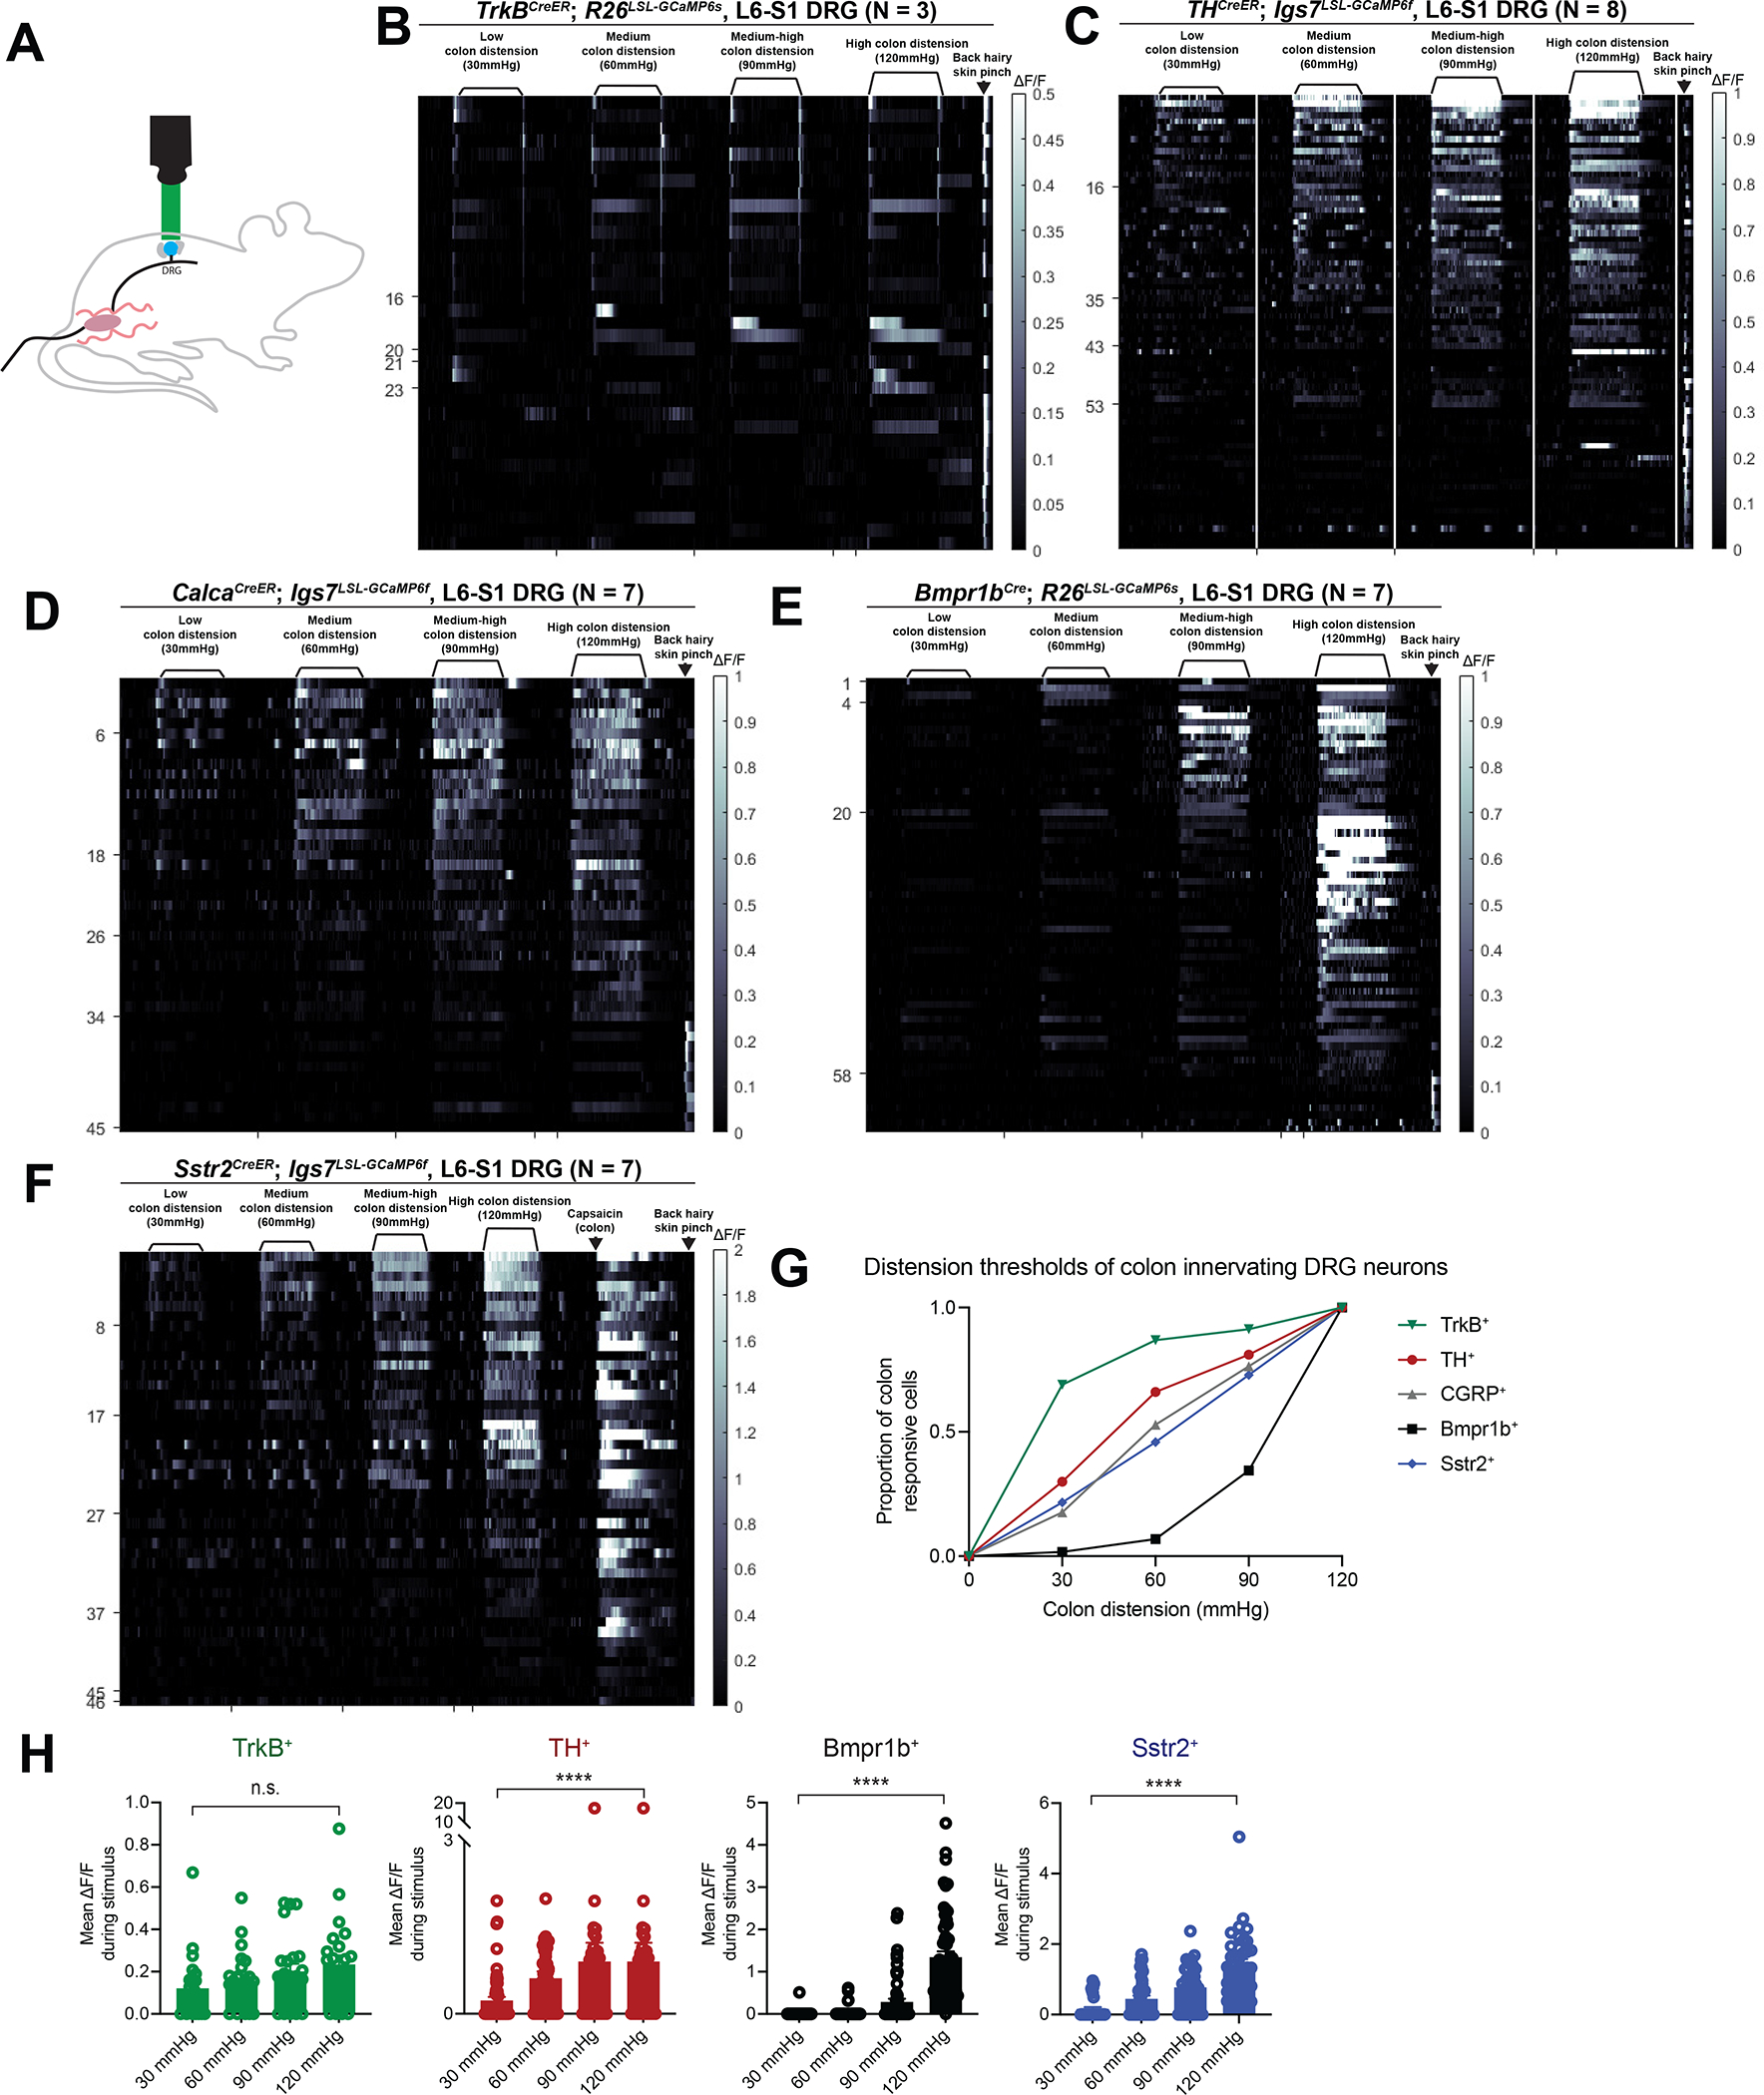
Figure 4: Four DRG neuron subtypes display distinct responses to colon distension and collectively tile force threshold space.

A: A schematic for the DRG calcium imaging set up.
B-F: In vivo DRG calcium imaging responses to colon distension in (B) TrkBCreER; R26LSL-GCaMP6s mice (N = 3; 0.5mg tamoxifen at P5); (C) THCreER; Igs7LSL-GCaMP6f mice (N = 8; 1–2mg tamoxifen at P21); (D) CalcaCreER; Igs7LSL-GCaMP6f mice (N = 7; 0.5 mg tamoxifen at P8–9); (E) Bmpr1bCre; R26LSL-GCaMP6s mice (N = 7); (F) and Sstr2CreER; Igs7LSL-GCaMP6f mice (N = 7; 1mg tamoxifen at P24).
G: Graph depicting the distension thresholds of all colon innervating populations based on calcium imaging.
H: Mean calcium activation (ΔF/F) during the distension stimulus for each cell type from calcium imaging experiments. Analyses were performed using repeated-measures ANOVAs and comparisons between low (30mmHg) and high (120mmHg) forces are plotted. See Table S1 for additional statistical details.
