Abstract
Background:
Data about placental weight (PW) in relation to birth weight (BW) and gestational age (GA) are lacking in Arabic countries.
Aims of the study:
(a) to find out the national PW standards for babies born between 37th and 42nd weeks of gestation in male and female babies born in Qatar; (b) to study the relation, if any, between PW and maternal age, gestational age (GA), birth weight (BW), and gender of the newborn.
Materials and Methods:
A National population-based retrospective chart review study was conducted between 1-2016 to 12-2019 (n = 80 722). Data of gestational age (GA) at delivery (in weeks), newborn birth weight (BW), PW, and gender at birth, were collected from singleton babies born between 37th and 42nd weeks of gestation.
Results:
The PW ranged from 440 to 860 grams (g) with a mean of 682 ± 96 g. at term for boys and 673 ± 94 g. for girls. The mean BW was 3 036 ± 448 g and BW/PW ratio was 0.203 ± 0.026. The PW continued to increase through 41 weeks’ gestation, in boys and girls with a significant decrease at the 42nd week of gestation. PW was significantly correlated with BW (r = 0.596, P: < 0.001) and GA (r = 0.15, P: <0.001) and accounted for 43.4% of the explained variability in birth weight.
Conclusions:
PW was a significant predictor of BW with a consistent increase in PW until the 41st week of gestation in boys and girls and a positive correlation with BW and GA. (www.actabiomedica.it)
Keywords: Growth, placental weight, birth weight, gestational age, sex, Qatar
Introduction
The main tasks of the placenta are to serve as a barrier or filter, to transfer substances between maternal and fetal circulation, and to facilitate a large spectrum of endocrine activities. Changes in maternal homeostasis with subsequent alterations in placental growth and function can result in changes in fetal growth rate in both normal and abnormal pregnancies. Research results suggest that placental weight (PW) partially mediates the effects of pre-pregnancy obesity, gestational diabetes mellitus (GDM), and excessive gestational weight gain (GWG) on fetal growth among term infants (1-4).
Molteni et al. (5) reported a linear relationship between fetal growth and placental mass, fetal weight, and placental growth in both early and late gestation and a significant increase in the mean placental weight and the fetal-placental weight ratio with advancing gestation in pregnancies that were appropriate-for-gestational age.
Thame et al. (1) and Ronald et al. (6) provided evidence that both placental volumes and the rate of placental growth may influence fetal size. These effects are evident in the first half of pregnancy and appear to be mediated through maternal weight and weight gain.
Jones et al. (7) assessed placental volumes utilizing longitudinal ultrasonographic techniques. The mean placental volume was 200 cm2 at 21 weeks gestation, 300 cm2 at 28 weeks, and 500 cm2 at term. There was a decreasing growth rate in the last trimester, although 15 percent of placentas showed a continuous increase through pregnancy.
Diamant et al. (8) described increased placental mass, glycogen and lipids amount in the placentas of women with diabetes compared to those with normal glucose tolerance.
Challier et al. (9) reported that obese women with body mass index (BMI) before pregnancy: > 30 kg/m2] had from two- to threefold increase in the number of macrophages in the placenta in comparison with placentas of pregravid women with BMI < 25 kg/m2. Moreover, other studies have reported that PW was linked with pregnancy outcomes. Heavy PW was linked to poor perinatal death, low Apgar score, neonatal respiratory distress, and increased neonatal intensive care unit (NICU) admissions (10-14).
Matsuda et al. (15) studied 53 650 infants and their placentas and reported that an “inappropriately heavy placenta” was associated with a significantly smaller fetal/placental weight ratio (FW/PW). These findings occurred more in female newborn babies, small for gestational age (SGA) newborns, and infants from preeclamptic mothers. On the other hand, low PW was associated with medical complications in the mother (16-18).
Barker et al. (19) reported that altered growth of the placenta was a predictor of maternal medical diseases including cardiovascular disease, hypertension, and diabetes mellitus. In addition, other factors such as race, ethnicity, and socioeconomic status also affect the PW and placental vascular malperfusion (20,21). A significant correlation between PW and postnatal infantile and childhood growth and the association between a disproportionately large placenta with an increased risk of long-term cardiovascular mortality has been also reported (22,23).
The aims of the study were: (a) to determine the Qatar population-specific centile charts of PW in newborns born between 37th and 42nd weeks of gestation in 80 722 male and female babies born in Qatar between 1-2016 to 1-2020, and (b) to study the relation, if any, between PW on the one hand and maternal age, gestational age (GA), birth weight (BW), and gender of the newborn baby.
Subjects and methods
Our population-based analysis consisted of a 4-year cohort data (January 2016 to December 2019) for births conducted in all Hamad Medical Center (HMC) hospitals. These hospitals account for about 90% of all births in the country. The inclusion criterion for this analysis was term singleton live births form the 37 th+0 to 42nd+6 weeks of gestation.
Ethics
All procedures were in accordance with the 1964 Helsinki declaration and its later amendments. The study was part of the Vulnerable Newborn Study, approved by the Hamad Medical Corporation Institutional Review Board and Ethical Committee (IRB No MRC-01-21-277).
Statistical analysis
We summarized the distribution of variables using numbers and percentages, mean and standard deviation (SD). Pearson correlation coefficients explored the relationship between PW and BW, maternal age, gender, GA. To explore and estimate the association between PW and BW, we fitted an unadjusted and adjusted linear regression model. The beta coefficient with 95% CI and R2 were obtained. The adjustment was made for maternal age, gender, and GA. Statistical significance was set at P: <0.05.
Results
Mean PW according to GA is presented in tables 1 and 2. The placental weight continued to increase through 41st weeks’ gestation, with a mild but significant decrease in the 42 nd week of gestation. The mean PW at term were 682 ± 96 g for boys and 673 ± 94 g for girls (Table 1). The mean placental weights were significantly heavier in boys versus girls in all gestational age groups.
Table 1.
Birth weight and placental weight (g) centiles by gestational age (weeks) for boys and girls at gestational age from 37 th to 42 nd weeks of gestation
| Male | ||||||||||||
|---|---|---|---|---|---|---|---|---|---|---|---|---|
| Gestational age (weeks) |
count | Birth weight | Placenta weight (g) | |||||||||
| mean | sd | mean | sd | p5 | p10 | p25 | p50 | p75 | p90 | p95 | ||
| 37 | 4,266 | 3036 | 448 | 632 | 114 | 440 | 482 | 565 | 640 | 700 | 755 | 810 |
| 38 | 10,356 | 3225 | 423 | 652 | 109 | 470 | 510 | 600 | 650 | 700 | 780 | 830 |
| 39 | 12,971 | 3355 | 411 | 664 | 101 | 490 | 530 | 610 | 680 | 710 | 780 | 820 |
| 40 | 9,876 | 3475 | 404 | 682 | 96 | 520 | 565 | 626 | 680 | 725 | 800 | 850 |
| 41 | 3,256 | 3578 | 402 | 693 | 101 | 515 | 575 | 640 | 700 | 750 | 810 | 860 |
| 42 | 191 | 3548 | 452 | 677 | 100 | 520 | 550 | 620 | 680 | 720 | 800 | 850 |
| Total | 40,916 | 3336 | 442 | 664 | 105 | 485 | 528 | 608 | 680 | 720 | 790 | 832 |
| Female | ||||||||||||
| Gestational age (weeks) | count | Birth weight | Placenta weight (g) | |||||||||
| mean | sd | mean | sd | p5 | p10 | p25 | p50 | p75 | p90 | p95 | ||
| 37 | 3,910 | 2928 | 454 | 627 | 117 | 430 | 480 | 560 | 630 | 690 | 750 | 820 |
| 38 | 9,366 | 3111 | 414 | 645 | 108 | 460 | 510 | 585 | 650 | 700 | 770 | 820 |
| 39 | 12,879 | 3238 | 395 | 659 | 101 | 490 | 530 | 600 | 670 | 710 | 780 | 820 |
| 40 | 9,937 | 3354 | 388 | 673 | 94 | 510 | 560 | 620 | 680 | 720 | 780 | 820 |
| 41 | 3,488 | 3439 | 396 | 683 | 95 | 516 | 570 | 630 | 680 | 722 | 800 | 850 |
| 42 | 226 | 3425 | 402 | 669 | 106 | 500 | 529 | 610 | 680 | 720 | 780 | 810 |
| Total | 39,806 | 3225 | 428 | 658 | 103 | 480 | 522 | 600 | 665 | 710 | 780 | 820 |
Table 2.
Placental weight as a function of gestational age (Mean ± SD)
| Gestational age (wk) | Mean PW (g) | SD |
|---|---|---|
| 37 | 629.95 | 115.51 |
| 38 | 648.66 | 108.61 |
| 39 | 661.39 | 101.22 |
| 40 | 677.34 | 95.14 |
| 41 | 687.74 | 98.08 |
| 42 | 672.69 | 103.56 |
PW was significantly correlated with GA (r = 0.15, P: <0.001) (Table 3) and accounted for 43.4% of the explained variability in birth weight.
Table 3.
Correlation between variables
| Birth wt. | Placenta wt. | Gestation age | Maternal age | |
|---|---|---|---|---|
| Birth wt. | 1.000 | |||
| Placenta wt. | 0.597* | 1.00 | ||
| Gestation age | 0.324* | 0.153* | 1.00 | |
| Maternal age | 0.07 | 0.04 | -0.12* | 1.00 |
Legend: * P: < 0.001.
The PW was correlated to birth weight in newborn male and female babies (Figures 1 and 2).
Figure 1.
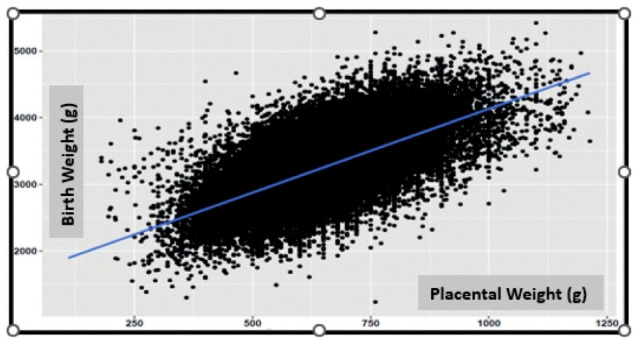
Correlation between placental weight and birth weight (r = 0.597, P: <0.001).
Figure 2.
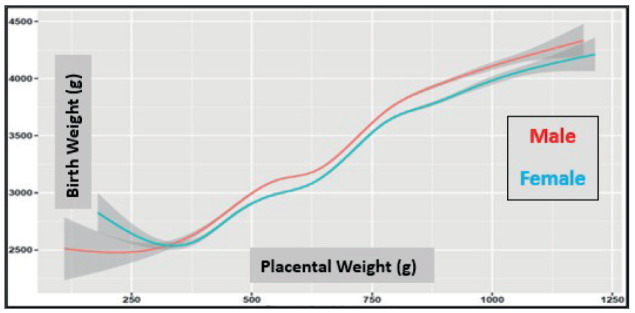
Placental weight in relation to birth weight in newborn male and female babies (the gray boundary around the line is the 95% confidence interval).
Birth weight was correlated significantly with the GA (r = 0.324, P:<0.001) and decreased significantly in women after the age of 35 years (Figure 3).
Figure 3.
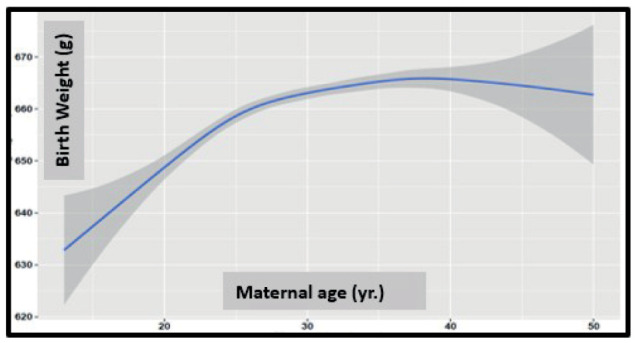
Birth weight as a function of maternal age (the gray boundary around the line is the 95% confidence interval).
Infant and placental weight PW pairs were analyzed according to their GA. Graphs were constructed to depict normal PW gain changes over the determined GA (37th to 42nd weeks). Mean PW continued to increase through 41st weeks’ gestation in both sexes (Figures 4 and 5).
Figure 4.
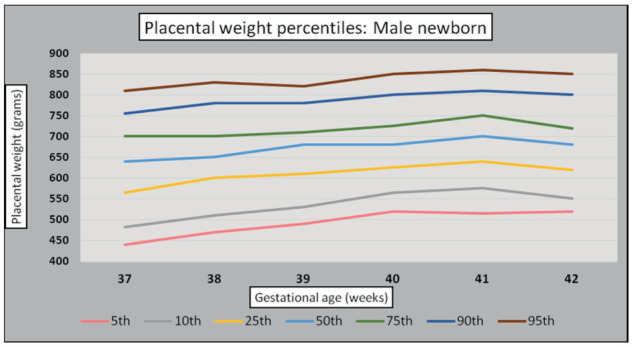
Male newborn placental weight standards (g).
Figure 5.
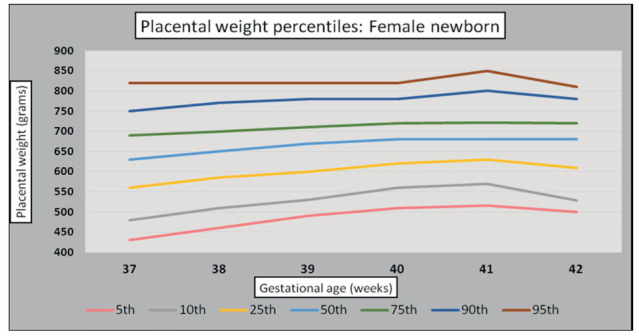
Female newborn placental weight standards (g).
Discussion
Placental weight (PW) is a valuable indicator of its function, predicting both pregnancy outcomes and lifelong health. Population-based centile charts of placental weight-for-gestational-age are useful for identifying extremes of PW. However, PW centiles differ among different populations, ethnicities, and socioeconomic statuses (24,25).
Our study showed that the mean PW at term was 680 ± 96 g for newborn boys and 665 ± 94 g for newborn girls. This was relatively higher than those reported in Thailand (519 ± 89 g), Nigeria (590 ± 82 g), Ethiopia (524.3±8.1g), Brazil (612 ± 138 g), Japan (578.8 ± 92.6 g), China (547 ±68.5 g), and Italy (561.8 ± 91.0 g) but comparable to those reported in the UK (626 ± 135.5 g for newborn females and 641 ± 139.3 g for newborn males) and Norway (664 ± 147 g) (15, 26-36). This may be explained by the high prevalence of obesity and gestational diabetes mellitus (GDM) in women in Qatar at the birth-bearing age.
The overall prevalence of newly detected diabetes in pregnancy among the 2 000 patients who fulfilled the inclusion/exclusion criteria was 24.0% (95% CI 22.1–25.9) of which type 2 diabetes mellitus (T2DM) was 2.5% (95% CI 1.9–3.3), GDM was 21.5% (95% CI 19.7–23.3) and excessive weight gain during pregnancy occurred in 44.1% of them (15, 26-36).
In support of our findings, Kucuk M et al. (37) detected significantly higher PW in pregnant women with GDM (694.8 ± 152) versus pregnancy women without GDM the normal control group (610.2 ± 116.6 g) (37). Bianchi et al, (38) and Mandò et al. (39) confirmed that PW and thickness were higher in obese pregnant women pregnancies and in overweight women who had excessive weight gain during gestation compared to normal pregnancies. Wallace et al. (40) studied a large cohort of pregnancies (n= 55 105) and reported that PW in the upper tertiles (mean 788 g) was associated with a higher risk of cesarean section, post-term delivery and high birth weight (P: < 0.001).
Flatley et al. (41) studied the PW and the difference in between males and females, in 97 882 pregnancies in Norway. In their study, the mean PW for newborn males was (654.4 g for nullipara and 684.9 g for multipara) and for newborn females. The mean PW was 646 g for nullipara and 673 g for multipara. These data confirmed our findings of the slightly heavier PW of male vs female newborns at full-term.
The overall PW curves and tables stratified by the GA in a large cohort of pregnancies offer population standards for use in clinical research studies. These curves are the first in the Arab gulf area. Our data confirm that PW increases progressively throughout the 37th to the 41st week of gestation. However, the rate of PW gain tended to slow during the later weeks of pregnancy. This slowing pattern can be explained by the previously described histological changes in placentas delivered in healthy pregnancies between 22- and 40 weeks of gestation described by Teasdale (42). The first stage of placental growth, which lasts through 36 weeks, is characterized by increases in both the parenchymal (the trophoblast tissue, cytotrophoblast, syncytiotrophoblast), and fetal capillaries of peripheral and stem villi) and non-parenchymal tissue (the decidual and chorionic plates, septa, fetal vessels, connective tissue, and fibrin deposits). This phase of rapid placental growth is necessary for rapid fetal growth in the last trimester of pregnancy (average fetal weight = 660 g at 25 weeks and 2 785 g at 36 weeks of gestation). The second phase (maturation phase) lasting from 36 weeks until term, is characterized by an increase in fetal growth (weight = 2785 g at 36 weeks and 3 380 g at 40th week) with only a slower increase in the placental weight due to gaining only non- parenchymal placental tissue (42).
In conclusion, PW is a good predictor of birth weight with a consistent increase in placental weight from the 37th until 41st weeks of gestation and a mild but significant decrease in the 42nd week of gestation. The reference standards of PW in our large specific centile charts in the Qatar population may be useful in studies investigating the role of the placenta in mediating pregnancy outcomes and lifelong health in the Arab gulf area.
Conflicts of Interest:
Each author declares that he or she has no commercial associations (e.g. consultancies, stock ownership, equity interest, patent/licensing arrangement, etc.) that might pose a conflict of interest in connection with the submitted article.
Author Contributions:
Conceptualization: All Authors; Data curation and analysis: FA and ATS; Writing original draft preparation: ATS. Reviewed the manuscript for important intellectual content and editing: VDS. Statistical analysis: TO. All authors have read and agreed to the published version of the manuscript ensuring that questions related to the accuracy and integrity of any part of the work were appropriately analyzed and discussed.
References
- Thame M, Osmond C, Bennett F, et al. Fetal growth is directly related to maternal anthropometry and placental volume. Eur J Clin Nutr. 2004;58(6):894–900. doi: 10.1038/sj.ejcn.1601909. doi: 10.1038/sj.ejcn.1601909. [DOI] [PubMed] [Google Scholar]
- Swanson LD, Bewtra C. Increase in normal placental weights related to increase in maternal body mass index. J Matern Fetal Neonatal Med. 2008;21(2):111–3. doi: 10.1080/14767050701866963. doi: 10.1080/1476705 07 01 866963. [DOI] [PubMed] [Google Scholar]
- Desoye G, Kaufman P. The human placenta in diabetes. In: Djelmis J, Desoye G, Ivasinevic M, editors. Diabetology of Pregnancy (Frontiers in Diabetes) Basel, Switzerland: Karger; 2005;17. pp. 94–109. [Google Scholar]
- Ouyang F, Parker M, Cerda S, et al. Placental weight mediates the effects of prenatal factors on fetal growth: the extent differs by preterm status. Obesity (Silver Spring) 2013;21(3):609–20. doi: 10.1038/oby.2012.88. doi: 10.1002/oby.20254. [DOI] [PMC free article] [PubMed] [Google Scholar]
- Molteni RA, Stys SJ, Battaglia FC. Relationship of fetal and placental weight in human beings: fetal/placental weight ratios at various gestational ages and birth weight distributions. J Reprod Med. 1978;21(5):327–34. PMID: 731626. [PubMed] [Google Scholar]
- Roland MC, Friis CM, Voldner N, et al. Fetal growth versus birth weight: the role of placenta versus other determinants. PLoS One. 2012;7(6):e39324. doi: 10.1371/journal.pone.0039324. doi: 10.1371/journal.pone.0039324. [DOI] [PMC free article] [PubMed] [Google Scholar]
- Jones TB, Price RR, Gibbs SJ. Volumetric determination of placental and uterine growth relationships from B-mode ultrasound by serial area-volume determinations. Invest Radiol. 1981;16(2):101–6. doi: 10.1097/00004424-198103000-00005. doi: 10.1097/00004424-198103000-00005. [DOI] [PubMed] [Google Scholar]
- Diamant YZ, Metzger BE, Freinkel N, et al. Placental lipid and glycogen content in human and experimental diabetes mellitus. Am J Obstet Gynecol. 1982 1;144(1):5–11. doi: 10.1016/0002-9378(82)90385-4. doi: 10.1016/0002- 9378(82)90385-4. [DOI] [PubMed] [Google Scholar]
- Challier JC, Basu S, Bintein T, et al. Obesity in pregnancy stimulates macrophage accumulation and inflammation in the placenta. Placenta. 2008;29(3):274–81. doi: 10.1016/j.placenta.2007.12.010. doi: 10. 1016/j.placenta.2007.12.010. [DOI] [PMC free article] [PubMed] [Google Scholar]
- Matsuda Y, Itoh T, Itoh H, et al. Impact of placental weight and fetal/placental weight ratio Z score on fetal growth and the perinatal outcome. Int J Med Sci. 2018, 8;15(5):484–91. doi: 10.7150/ijms.23107. doi: 10.7150/ijms.23107. [DOI] [PMC free article] [PubMed] [Google Scholar]
- Eskild A, Haavaldsen C, Vatten LJ. Placental weight and placental weight to birthweight ratio in relation to Apgar score at birth: a population study of 522 360 singleton pregnancies. Acta Obstet Gynecol Scand. 2014;93(12):1302–8. doi: 10.1111/aogs.12509. doi: 10.1111/aogs.12509. [DOI] [PubMed] [Google Scholar]
- Rasmussen KM, Yaktine AL, editors. Weight Gain During Pregnancy: Reexamining the Guidelines. Washington (DC): National Academies Press (US); 2009. Institute of Medicine (US) and National Research Council (US) Committee to Reexamine IOM Pregnancy Weight Guidelines. [PubMed] [Google Scholar]
- Lonimitdee K, Prommas S. Placental Weight for Gestational Age and Adverse Neonatal Outcome at Bhumibol Adulyadej Hospital. Thai J Obstet Gynaecol. 2015;23:211–5. [Google Scholar]
- Takayama M, Soma H, Yaguchi S, et al. Abnormally large placenta associated with Beckwith- Wiedemann syndrome. Gynecol Obstet Invest. 1986;22(3):165–8. doi: 10.1159/000298909. doi:10.1159/000298909. [DOI] [PubMed] [Google Scholar]
- Matsuda Y, Ogawa M, Nakai A, et al. Fetal/Placental weight ratio in term Japanese pregnancy: its difference among gender, parity, and infant growth. Int J Med Sci. 2015;25;12(4):301–5. doi: 10.7150/ijms.11644. doi: 10.7150/ijms.11644. [DOI] [PMC free article] [PubMed] [Google Scholar]
- Burton GJ, Jauniaux E. Pathophysiology of placental-derived fetal growth restriction. Am J Obstet Gynecol. 2018;218(2S):S745–S61. doi: 10.1016/j.ajog.2017.11.577. doi: 10.1016/j.ajog.2017.11.577. [DOI] [PubMed] [Google Scholar]
- Salafia CM, Charles AK, Maas EM. Placenta and fetal growth restriction. Clin Obstet Gynecol. 2006;49(2):236–56. doi: 10.1097/00003081-200606000-00007. doi: 10.1097/00003081-200606000-00007. [DOI] [PubMed] [Google Scholar]
- Naeye RL. Do placental weights have clinical significance? Hum Pathol. 1987;18(4):387–91. doi: 10.1016/s0046-8177(87)80170-3. doi: 10.1016/s0046-8177(87)80170-3. [DOI] [PubMed] [Google Scholar]
- Barker DJ, Bull AR, Osmond C, et al. Fetal and placental size and risk of hypertension in adult life. BMJ. 1990;4;301(6746):259–62. doi: 10.1136/bmj.301.6746.259. doi: 10.1136/bmj.301.6746.259. [DOI] [PMC free article] [PubMed] [Google Scholar]
- Chen Y, Huang L, Zhang H, et al. Racial disparity in placental pathology in the collaborative perinatal project. Int J Clin Exp Pathol. 2015;8(11):15042–54. PMID: 26823843. [PMC free article] [PubMed] [Google Scholar]
- Audette MC, Levytska K, Lye SJ, et al. Parental ethnicity and placental maternal vascular malperfusion pathology in healthy nulliparous women. Placenta. 2018;66:40–6. doi: 10.1016/j.placenta.2018.04.014. doi: 10.1016/j.placenta.2018.04.014. [DOI] [PubMed] [Google Scholar]
- Soliman AT, Eldabbagh M, Saleem W, et al. Placental weight: relation to maternal weight and growth parameters of full-term babies at birth and during childhood. J Trop Pediatr. 2013;59(5):358–64. doi: 10.1093/tropej/fmt030. doi:10.1093/tropej/fmt030. [DOI] [PubMed] [Google Scholar]
- Risnes KR, Romundstad PR, Nilsen TI, et al. Placental weight relative to birth weight and long- term cardiovascular mortality: findings from a cohort of 31,307 men and women. Am J Epidemiol. 2009;170(5):622–31. doi: 10.1093/aje/kwp182. doi: 10.1093/aje/kwp182. [DOI] [PubMed] [Google Scholar]
- Wallace JM, Agard JP, Horgan GW. A new customized placental weight standard redefines the relationship between maternal obesity and extremes of placental size and is more closely associated with pregnancy complications than an existing population standard. J Dev Orig Health Dis. 2020;11(4):350–9. doi: 10.1017/S2040174419000576. doi: 10.1017/S2040174419000576. [DOI] [PubMed] [Google Scholar]
- Wallace JM, Bhattacharya S, Horgan GW. Gestational age, gender, and parity specific centile charts for placental weight for singleton deliveries in Aberdeen, UK. Placenta. 2013;34(3):269–74. doi: 10.1016/j.placenta.2012.12.007. doi: 10.1016/j.placenta.2012.12.007. [DOI] [PubMed] [Google Scholar]
- Janthanaphan M, Kor-Anantakul O, Geater A. Placental weight and its ratio to birth weight in normal pregnancy at Songkhlanagarind Hospital. J Med Assoc Thai. 2006;89(2):130–7. PMID:16578997. [PubMed] [Google Scholar]
- Panti AA, Ekele BA, Nwobodo EI, et al. The relationship between the weight of the placenta and birth weight of the neonate in a Nigerian Hospital. Niger Med J. 2012;53(2):80–4. doi: 10.4103/0300-1652.103547. doi:10.4103/0300-1652.103547. [DOI] [PMC free article] [PubMed] [Google Scholar]
- Mehare T, Kebede D. Fetoplacental Weight Relationship in Normal Pregnancy and Pregnancy Complicated by Pregnancy-Induced Hypertension and Abruption of Placenta among Mothers Who Gave Birth in Southern Ethiopia, 2018. Obstet Gynecol Int. 2020;2020:6839416. doi: 10.1155/2020/6839416. doi: 10.1155/2020/6839416. [DOI] [PMC free article] [PubMed] [Google Scholar]
- Mehare T, Kebede D. Placenta among Mothers Who Gave Birth in Southern Ethiopia, 2018. Obstet Gynecol Int. 2020;27;2020:6839416. doi: 10.1155/2020/6839416. doi:10.1155/2020/6839416. [DOI] [PMC free article] [PubMed] [Google Scholar]
- Nascente LMP, Grandi C, Aragon DC, et al. Placental measurements and their association with birth weight in a Brazilian cohort. Rev Bras Epidemiol. 2020,21;23:e200004. doi: 10.1590/1980-549720200004. doi: 10.1590/1980-549720200004. [DOI] [PubMed] [Google Scholar]
- Taricco E, Radaelli T, Nobile de Santis MS, et al. Foetal and placental weights in relation to maternal characteristics in gestational diabetes. Placenta. 2003;24(4):343–7. doi: 10.1053/plac.2002.0913. doi: 10.1053/ plac.2002.0913. [DOI] [PubMed] [Google Scholar]
- Wei Y, Peng J, Li H, et al. Association Between Maternal Fasting Plasma Glucose Value and Fetal Weight Among Singletons of Mothers with Gestational Diabetes Mellitus. Diabetes Metab Syndr Obes. 2022,10;15:3799–3807. doi: 10.2147/DMSO.S391253. doi: 10.2147/DMSO.S391253. [DOI] [PMC free article] [PubMed] [Google Scholar]
- Wallace JM, Bhattacharya S, Horgan GW. Gestational age, gender and parity specific centile charts for placental weight for singleton deliveries in Aberdeen, UK. Placenta. 2013;34(3):269–74. doi: 10.1016/j.placenta.2012.12.007. doi: 10.1016/j.placenta.2012.12.007. [DOI] [PubMed] [Google Scholar]
- Str⊘m-Roum EM, Jukic AM, Eskild A. Offspring birthweight and placental weight-does the type of maternal diabetes matter? A population-based study of 319 076 pregnancies. Acta Obstet Gynecol Scand. 2021;100(10):1885–92. doi: 10.1111/aogs.14217. doi: 10.1111/aogs.14217. [DOI] [PMC free article] [PubMed] [Google Scholar]
- Bashir M.E, Abdel-Rahman M, Aboulfotouh M, et al. Prevalence of newly detected diabetes in pregnancy in Qatar, using universal screening. PLoS One. 2018;3;13(8):e020–1247. doi: 10.1371/journal.pone.0201247. doi: 10.1371/journal.pone.0201247. [DOI] [PMC free article] [PubMed] [Google Scholar]
- Abdulmalik MA, Ayoub JJ, Mahmoud A, et al. Pre-pregnancy BMI, gestational weight gain and birth outcomes in Lebanon and Qatar: Results of the MINA cohort. PLoS One. 2019;2;14(7):e0219248. doi: 10.1371/journal.pone.0219248. doi: 10.1371/ journal. pone.0219248. [DOI] [PMC free article] [PubMed] [Google Scholar]
- Kucuk M, Doymaz F. Placental weight and placental weight-to-birth weight ratio are increased in diet- and exercise-treated gestational diabetes mellitus subjects but not in subjects with one abnormal value on 100-g oral glucose tolerance test. J Diabetes Complications. 2009;23(1):25–31. doi: 10.1016/j.jdiacomp.2007.04.002. doi: 10.1016/j.jdiacomp.2007.04.002. [DOI] [PubMed] [Google Scholar]
- Bianchi C, Taricco E, Cardellicchio M, et al. The role of obesity and gestational diabetes on placental size and fetal oxygenation. Placenta. 2021;103:59–63. doi: 10.1016/j.placenta.2020.10.013. doi: 10.1016/j.placenta.2020.10.013. [DOI] [PubMed] [Google Scholar]
- Mandò C, Calabrese S, Mazzocco MI, et al. Sex specific adaptations in placental biometry of overweight and obese women. Placenta. 2016;38:1–7. doi: 10.1016/j.placenta.2015.12.008. doi: 10.1016/j.placenta.2015.12.008. [DOI] [PubMed] [Google Scholar]
- Wallace JM, Horgan GW, Bhattacharya S. Placental weight and efficiency in relation to maternal body mass index and the risk of pregnancy complications in women delivering singleton babies. Placenta. 2012;33(8):611–8. doi: 10.1016/j.placenta.2012.05.006. doi: 10.1016/j.placenta.2012.05.006. [DOI] [PubMed] [Google Scholar]
- Flatley C, Sole-Navais P, Vaudel M, et al. Placental weight centiles adjusted for age, parity and fetal sex. Placenta. 2022;117:87–94. doi: 10.1016/j.placenta.2021.10.011. doi: 10.1016/j.placenta.2021.10.011. [DOI] [PubMed] [Google Scholar]
- Teasdale F. Gestational changes in the functional structure of the human placenta in relation to fetal growth: a morphometric study. Am J Obstet Gynecol. 1980; 1;137(5):560–8. doi: 10.1016/0002-9378(80)90696-1. doi: 10.1016/0002-9378(80)90696-1. [DOI] [PubMed] [Google Scholar]


