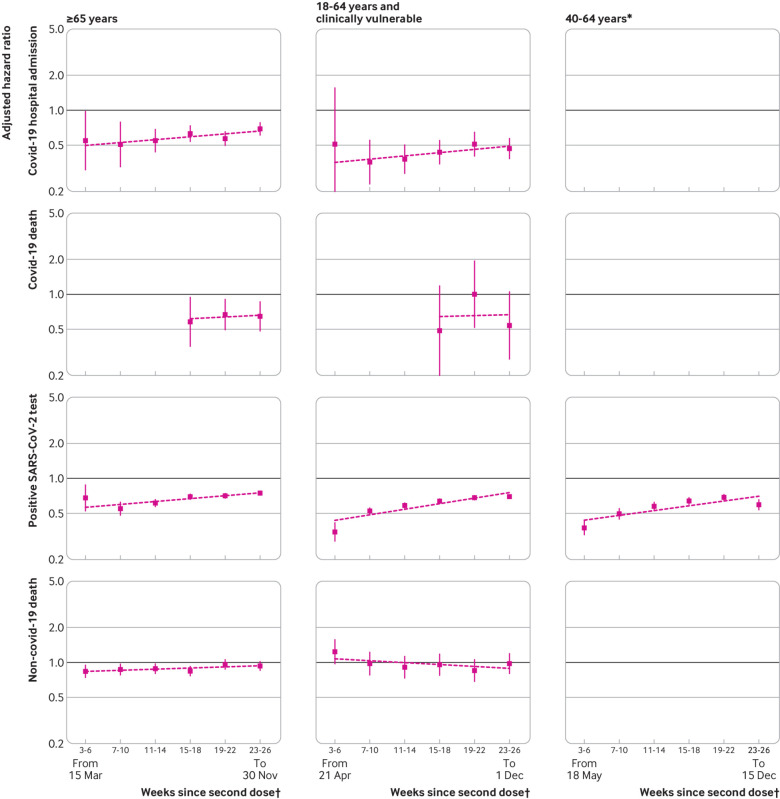
Fig 3.
Adjusted hazard ratios comparing BNT162b2 with ChAdOx1. Hazard ratios <1 favour BNT162b2. Slopes of lines correspond to ratios of hazard ratios across comparison periods, estimated using meta-regression. Estimates in 40-64 years age group are omitted for all outcomes except positive SARS-CoV-2 test owing to low event counts. Y axis is on log scale. *Not clinically vulnerable. †Dates (all in 2021) represent earliest and latest dates of follow-up within subgroup

