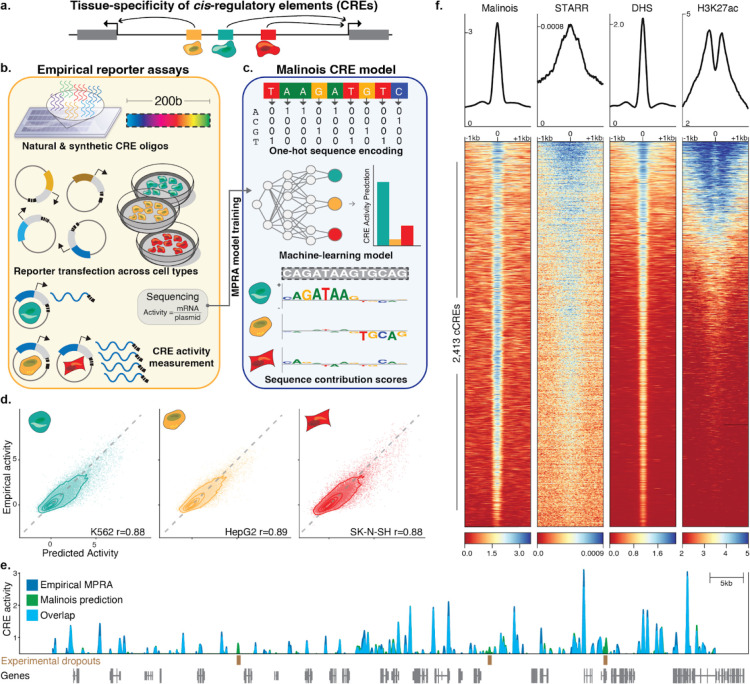
Figure 1. Malinois accurately predicts transcriptional activation by CREs in episomal reporters.
(a) Schematic showing non-coding cis-regulatory elements (CREs) in the genome drive gene expression and contribute to cell type specific expression. (b) Overview of how MPRAs enable targeted functional characterization of hundreds of thousands of CREs on transcription in episomal reporters, and can quantify the impact of programmable 200-bp oligonucleotide sequences. MPRAs across multiple cell types enables discovery of cell type-specific activity of CREs. (c) Schematic showing how deep learning enables modeling of cell type-specific CRE effects directly from nucleotide sequence. Malinois, a deep convolutional neural network, predicts CRE activity in K562 (teal), HepG2 (yellow), and SK-N-SH (red). Contribution scores can be extracted from the model to determine how subsequences drive predicted function in each cell type. (d) Malinois predictions are highly correlated with empirically measured MPRA activity across K562 (teal), HepG2 (yellow), and SK-N-SH (red). Performance for each cell type was measured using Pearson correlation (r) on a test set of sequences withheld from training. Each point corresponds to empirical and predicted activity of a single CRE in the corresponding cell type, and topological lines indicate point density (16.7%, 33.3%, 50%, 66.7%, 83.3%) in the scatter plots. Train/test splits were defined by chromosomes. (e) Malinois activity predictions for sequences centered on K562-specific DHS peaks activate transcription in K562. This pattern of activation is concordant with quantitative signals measured using STARR-seq, DHS-seq, and H3K27ac seq. (f) Malinois predictions recapitulate an MPRA screen of overlapping fragments derived from a 2.1Mb window centered on the GATA1 gene (Pearson’s r = 0.91; Supplementary Fig. 4). Light blue signal indicates overlapping signal while dark blue and green regions indicate either higher activity measurements or predictions by MPRA or Malinois, respectively, in the window chrX:48,000,000–49,000,000.

