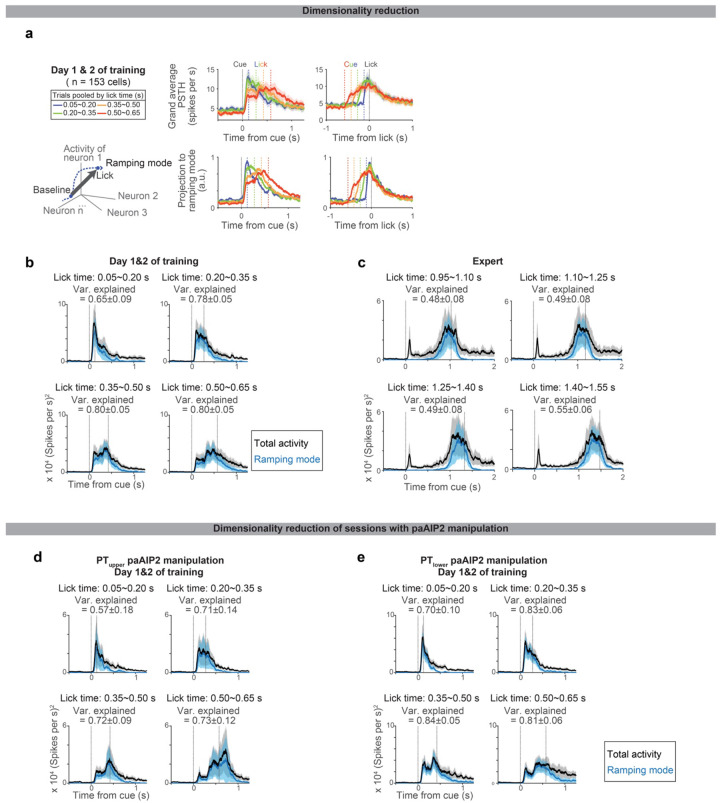
Extended Data Figure 8. Low dimensional population activity during learning.
a. Projection of ALM spiking activity to the ramping mode, which maximally distinguishes the population activity between the baseline and pre-lick (Methods). Top, grand average PSTH aligned to cue (left) or lick (right). Bottom, projection to the ramping mode. n = 153 preparatory neurons in ALM (neurons with >= 10 trials for all lick times were analyzed).
b. The square sum of total spiking activity (black) and the square of projection along ramping mode (blue) at each time point, indicating the large proportion of spiking activity can be explained by activity along this mode. Shade, SEM (hierarchical bootstrap). Var explained: mean ± SEM.
c. Same as b for Expert. N = 123 preparatory neurons in ALM (neurons with >=10 trials for all lick times were analyzed).
d. Same as b for PTupper paAIP2 manipulation, indicating the large proportion of spiking activity can be explained by activity along this mode even during the paAIP2 manipulation. N = 117 preparatory neurons in ALM (neurons with >=10 trials for all lick times were analyzed).
e. Same as b for PTlower paAIP2 manipulation. N = 140 preparatory neurons in ALM (neurons with >=10 trials for all lick times were analyzed).

