Abstract
Neoantigens are peptides derived from non-synonymous mutations presented by human leukocyte antigens (HLAs), which are recognized by antitumour T cells1–14. The large HLA allele diversity and limiting clinical samples have restricted the study of the landscape of neoantigen-targeted T cell responses in patients over their treatment course. Here we applied recently developed technologies15–17 to capture neoantigen-specific T cells from blood and tumours from patients with metastatic melanoma with or without response to anti-programmed death receptor 1 (PD-1) immunotherapy. We generated personalized libraries of neoantigen–HLA capture reagents to single-cell isolate the T cells and clone their T cell receptors (neoTCRs). Multiple T cells with different neoTCR sequences (T cell clonotypes) recognized a limited number of mutations in samples from seven patients with long-lasting clinical responses. These neoTCR clonotypes were recurrently detected over time in the blood and tumour. Samples from four patients with no response to anti-PD-1 also demonstrated neoantigen-specific T cell responses in the blood and tumour to a restricted number of mutations with lower TCR polyclonality and were not recurrently detected in sequential samples. Reconstitution of the neoTCRs in donor T cells using non-viral CRISPR–Cas9 gene editing demonstrated specific recognition and cytotoxicity to patient-matched melanoma cell lines. Thus, effective anti-PD-1 immunotherapy is associated with the presence of polyclonal CD8+ T cells in the tumour and blood specific for a limited number of immunodominant mutations, which are recurrently recognized over time.
We reasoned that the analysis of the spectrum of mutational neoantigen-specific T cell responses induced by immune checkpoint blockade (ICB) therapy required (1) a highly sensitive approach that could detect T cell responses to an array of hundreds of putative neoantigens presented by the diverse HLAs in relatively small patient-derived samples containing a few million peripheral blood mononuclear cells (PBMCs) or tumour-infiltrating lymphocytes (TILs) expanded from tumour biopsies15–17; (2) reconstitution of the antigen specificity of isolated neoantigen-specific TCRs (neoTCRs) in a time-efficient process18,19; and (3) assessment of T cell recognition and antitumour activity against matched patient’s autologous cell lines that endogenously express the mutational neoantigens. From 11 patients with metastatic melanoma receiving PD-1-blockade-based immunotherapy, we collected PBMCs at different timepoints in their care and established TIL cultures and autologous tumour cell lines from available patient tumour biopsies. Whole-exome sequencing (WES) and RNA-sequencing (RNA-seq) analysis of the tumour cell lines, or the tumour biopsies, were performed and compared to normal control DNA obtained from the matched patient’s PBMCs. These data were used to define each patient’s six HLA class I alleles, detect patient-specific non-synonymous mutations and perform computational predictions for putative neoantigens presented by any of the patient’s HLA class I molecules17,20,21. The predicted neoantigens were prioritized on the basis of their level of expression by the tumour and the predicted binding affinity to the patient’s own HLA class I molecules. We prioritized a list of up to 243 (median 172, range 17–243) neoantigen peptide–HLA candidates per patient (peptide length, 8–11 amino acids) across their HLA class I alleles, covered by an HLA library of up to 64 HLA class I alleles15. The peptide–HLA complex libraries were produced in Expi293F cells as single-chain trimers, whereby neoantigen peptide gene sequences were fused in sequence to beta-2-microglobulin (β2M) domains and the HLA15,16,22,23. These personalized protein libraries were then DNA-barcoded, fluorescently labeled and multimerized for use as capture reagents15. Once assembled, the libraries were incubated with patients’ PBMCs or lymphocytes expanded from tumour biopsies, and neoantigen-specific T cells were captured by single-cell sorting. Notably, the sequencing data and all of the TIL cultures were obtained from biopsies of the same lesion in each patient. T cell isolation included markers of antigen-experienced T cells such as CD39, CD103 and CD9524–26. The barcodes unique to each of the predicted neoantigen-HLA multimers enabled deciphering the antigen specificity of the captured T cells (Fig. 1a), therefore defining the mutational neoantigens recognized by antitumour CD8+ T cells.
Fig. 1 |. Neoantigen-specific T cell screening and TCR clonotype identification.
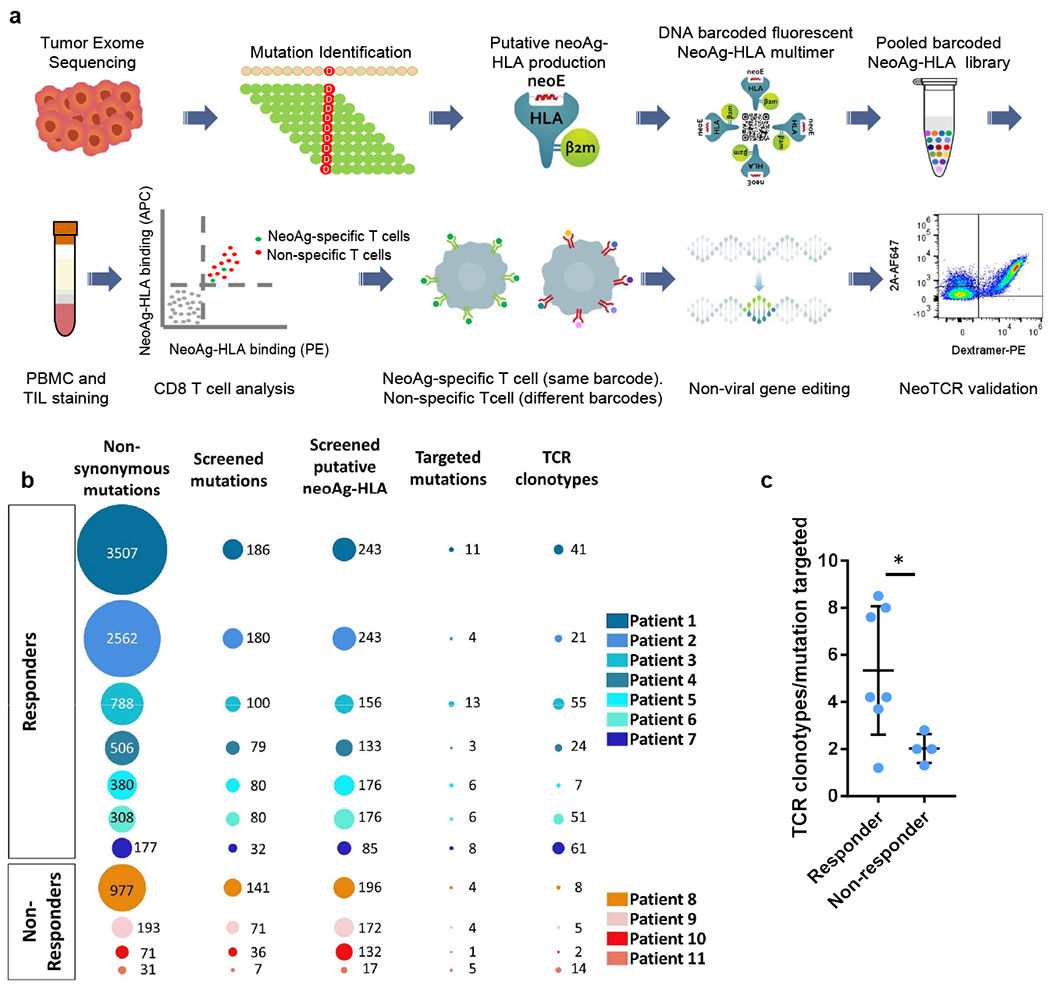
a, Schematic of neoantigen-specific TCR isolation from patient samples. NeoAg, neoantigen. b, Representations of the number of non-synonymous mutations, mutations screened, predicted neoantigen–HLA complexes screened, mutations targeted by neoantigen-specific T cells and neoantigen-specific T cell clonotypes isolated in patients with (patients 1–7) or without (patients 8–11) a response to anti-PD-1 therapy. c, Ratio of the number of neoantigen-specific TCR clonotypes isolated per mutation targeted in each patient. Data are mean ± s.d. with individual values. n values indicate the number of different patients; n = 7 (responders) and n = 4 (non-responders). *P = 0.0434, calculated using a two-tailed unpaired t-test, using the two-stage linear step-up procedure of Benjamini, Krieger and Yekutieli, with Q = 1%.
We performed this process on samples from 11 patients with metastatic melanoma, of whom seven had a clinical response to anti-PD-1 therapy, three did not respond to therapy, and one rapidly progressed after collecting the baseline samples and before receiving the first planned nivolumab infusion (Extended Data Table 1). The seven patients with clinical response were still alive at the time of reporting. Patient 1 has a longstanding (ongoing at 32+ months) clinical response to dostarlimab (anti-PD-1 antibody) and cobolimab (anti-TIM3 antibody), and patients 2 to 6 have longstanding clinical responses to single-agent therapy with the anti-PD-1 antibodies nivolumab or pembrolizumab (ongoing at 48+ to 111+ months). Patient 7 initiated therapy with a bulky metastatic melanoma with metastasis in five organs (including the heart and the liver), with decrease in size of several metastases and concomitant progression at other sites, representing a mixed clinical response that is ongoing for 36+ months since the beginning of the treatment. The four patients without a clinical response are deceased at the time of reporting. Patient 8 had disease progression on single-agent pembrolizumab. Patient 9 received a combination of pembrolizumab and intratumoural injection of SD101, a toll-like receptor 9 agonist27, resulting in regression of the injected subcutaneous site but no response of distant adrenal metastases, having stable disease for 17 months followed by widespread progression of bone and peritoneal metastases. Patient 10 progressed rapidly before the planned first infusion of nivolumab. Patient 11 progressed within 4 months of receiving pembrolizumab (Extended Data Table 1). The site of origin for all patients was cutaneous melanoma, except for patient 11, who had a mucosal melanoma.
WES analysis of the patient-derived melanoma cell lines and biopsies identified a wide range of mutations, from 31 in patient 11 to 3,507 in patient 1 (median, 380). In agreement with previous literature28–30, the melanoma from patients with response to anti-PD-1 therapy had a higher median tumour mutational load (median, 506 non-synonymous mutations) compared with the samples from patients without a response to therapy (median, 132 non-synonymous mutations). Despite the wide range of expressed mutations, the number of mutations recognized as neoantigens by the T cells was a lot less variable, ranging from 1 to 13 (Fig. 1b, Extended Data Fig. 1 and Supplementary Table 1). There was therefore evidence of immunodominance–that is, the T cell responses to mutational neoantigens were not linearly correlated with the number of mutations, but targeted a limited set of mutations that were recognized as neoantigens in patients with and without a clinical response to anti-PD-1 therapy.
Single-cell TCR sequencing of neoantigen-specific T cells isolated from the blood and tumour from patients who had a clinical response to therapy (patients 1 to 7) revealed a median of five (range, 1 to 23) individual TCR-alpha and -beta chain pairs per mutation targeted, with a median of 41 (range, 7 to 61) isolated neoTCR clonotypes per patient. By contrast, the four patients without a clinical response to therapy (patients 8 to 11) exhibited a median of 2 (range, 1 to 6) neoTCR clonotypes per mutation targeted, with a median of 6.5 (range, 2 to 14) isolated neoTCR clonotypes per patient (Fig. 1b,c, Extended Data Fig. 1 and Supplementary Table 1).
Next, we performed longitudinal analysis of neoantigen recognition for each patient of all of the available sequential PBMC and TIL samples. Patient 1 had a durable response in the lymph nodes and subcutaneous tissue in the scalp (Fig. 2a,b). A total of 3,507 somatic coding mutations were identified in the melanoma cell line derived from patient 1, from which 1,243 were predicted to be expressed by RNA-seq (Supplementary Table 1). A library of 243 neoantigen–HLA capture reagents covering 186 mutations presented by six of the patient’s HLA class I was generated and used for screening of CD8+ T cells from blood and tumour samples (Fig. 2c and Supplementary Table 1). A total of 571 neoantigen-specific T cells were isolated that comprised 41 different neoTCR clonotypes and targeted 11 mutations. After isolating the neoantigen-specific T cells, 22 neoTCRs were selected to proceed with TCR cloning, expression in healthy donor T cells and specific neoepitope–HLA binding validation. These 22 neoTCRs were present in a total of 482 neoantigen-specific T cells and targeted 9 different mutations. Mutations in NUP188, UBE2J1 and WDR1 were recognized as neoantigens recurrently at different timepoints analysed (Fig. 2c and Supplementary Table 2). The 22 different neoTCR clonotypes were detected in the sequential blood and tumour samples with different T cell frequencies, some expanding or contracting at different timepoints. Note that the peripheral blood draws were between 5 ml and 20 ml and the tumour biopsies were core needle biopsies, which only sampled a minority of T cells in each compartment at any timepoint. Similar findings were evident in samples from patients 2 and 6, who had a long-lasting response to anti-PD-1 therapy in lung (Fig. 2d,e) and lymph node metastases (Fig. 2g,h), respectively. The autologous cell line from patient 2 had 2,562 non-synonymous mutations from which 1,099 were expressed. The patient-specific library contained 243 capture reagents covering 180 mutations presented by three of the patient’s HLAs. Twenty-one different neoTCR clonotypes were isolated targeting four mutations. In total, 19 neoTCR clonotypes were selected for TCR cloning, expression in healthy donor T cells and specific neoepitope–HLA binding validation; 14 of them were validated. A total of 186 of the neoantigen-specific T cells (Supplementary Table 2) isolated comprised 1 of these 14 different neoTCR clonotypes targeting three mutations (Fig. 2f, Supplementary Tables 1 and 2 and Extended Data Fig. 1). For patient 6, out of the 308 somatic coding mutations, 126 were expressed. The patient-specific library comprised 176 capture reagents covering 80 mutations, presented by the 6 patients’ HLA class I molecules. In total, 51 different neoTCR clonotypes targeting 6 mutations were isolated. From these, 27 clonotypes were cloned and expressed in healthy donor T cells, 21 of them were validated by neoepitope–HLA binding. These 21 neoTCR clonotypes were identified in 296 of the isolated neoantigen-specific T cells and targeted 5 mutations (Fig. 2i, Supplementary Tables 1 and 2 and Extended Data Fig. 1). For patients 3, 4, 5 and 7 with a response to therapy, the autologous cell lines presented 788 (patient 3), 380 (patient 5) and 177 (patient 7) non-synonymous coding mutations and the tumour biopsy from patient 4 presented 506 somatic coding mutations. From these mutations, 375, 178, 164 and 56 were expressed, respectively. The patient-specific libraries comprised 156, 133, 176 and 85 capture reagents covering 100, 79, 80 and 32 mutations, respectively. From these patients, 55, 24, 7 and 61 neoTCRs were isolated targeting 13, 3, 6 and 8 mutations, respectively (Extended Data Figs. 1 and 2 and Supplementary Tables 1 and 2).
Fig.2 |. Neoantigen-specific T cell isolation from TILs and PBMCs in patients with a response to anti-PD-1 therapy.
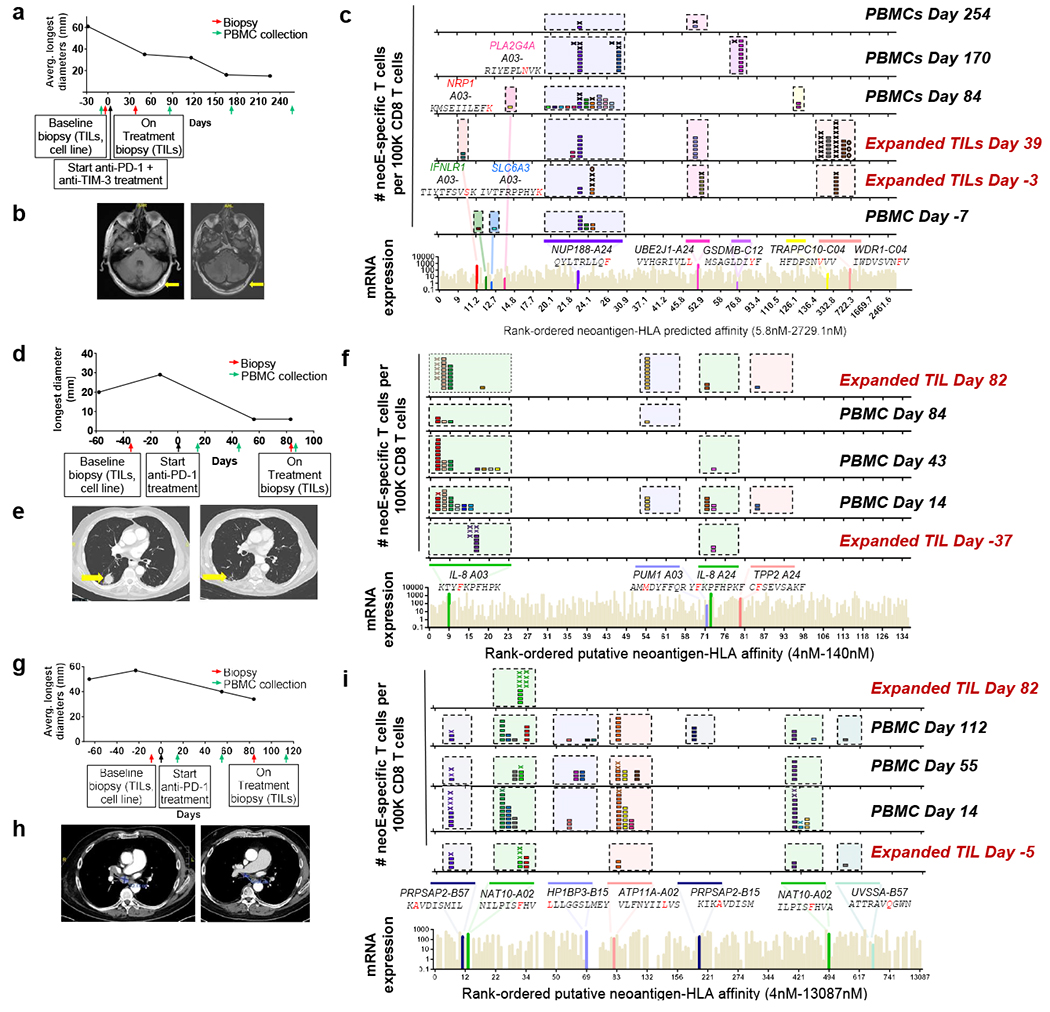
a, Tumour measurements over time and sample collection for patient 1. b, Magnetic resonance imaging (MRI) scans from patient 1 at the baseline (day −12, left) and on treatment (day 428, right). c, Landscape analysis of the neoantigen-specific T cells over time in patient 1. Bottom, mRNA expression, measured in absolute reads and predicted HLA-binding affinity of the putative neoantigens screened. Neoantigens targeted by T cells are highlighted in different colours, and the mutated gene name, the sequence of the neoantigen with the point mutation marked in red and the HLA are indicated at the top. The same colour code is used in the top panels to show the neoantigen specificity of the isolated T cells. The six top panels show the evolution over time of the neoantigen-specific T cells in TILs and PBMCs. Each box represents one isolated T cell, each cross is equivalent to ten isolated T cells and each circle is equivalent to 100 isolated T cells. Each colour represents a different neoantigen-specific T cell clonotype. The number of isolated T cells was normalized to 100,000 CD8+ T cells using a round-up method to plot the results. Only T cell clonotypes that demonstrated binding to neoantigen–HLA complexes once expressed in healthy donor T cells are shown, d, The same as in a, but for patient 2. e, Computed tomography (CT) scans from patient 2 at baseline (day −13, left) and on treatment (day 56, right). L, left; R, right. f, The same as in c, but for patient 2. g, The same as in a, but for patient 6. This patient had two target lesions; the average of the longest diameters is shown. h, CT scans from patient 6 at baseline (day −23, left) and on treatment (day 84, right). i, The same as in c, but for patient 6.
Next, we tested the functionality of the isolated neoTCRs against autologous melanoma cell lines established from biopsies from three patients with a clinical response to anti-PD-1-based therapy and three patients without a response. The paired neoTCR-alpha and -beta chains were sequenced and used to genetically modify healthy donor T cells using non-viral CRISPR–Cas9 gene editing to replace the endogenous TCR with the neoTCR15. After homology-directed repair, a fully functional neoTCR was seamlessly integrated at the TCR alpha locus (TRAC) under the control of the endogenous promoter. As a validation step, the antigen specificity of the resulting neoTCR-T cells was confirmed by multimer staining (Extended Data Fig. 3). We generated neoTCR gene-edited T cell products from 22 neoTCR clonotypes from patient 1, which were specific for neoantigens derived from point mutations in NRP1, IFNLR1, SLC6A3, PLA2G4A, NUP188, UBE2J1, GSDMB, TRAPPC10 and WDR1 (Supplementary Table 1). We performed co-culture experiments with the neoTCR gene-edited T cells and the autologous cell line established from the patient’s baseline biopsy (M495) or an unmatched cell line (M202), and measured T cell-mediated cytotoxicity. A neoTCR cloned from captured neoantigen-specific T cells from another patient, targeting a mutation irrelevant to these cell lines, Neo1217, was used as a negative control. All neoTCR-T cell product targeting mutations that induced a polyclonal response from this patient (UBE2J1, NUP188 and WDR1 presented by HLA-A*24:02 and HLA-C*04:01) showed specific cytotoxicity against the M495 patient autologous cell line (Fig. 3a). The neoTCR-T cell products derived from monoclonal T cell responses targeting mutations in NRP1 and TRAPPC10 (presented by HLA-A*03:01 and HLA-C*04:01, respectively) displayed intermediate cytotoxicity (Fig. 3b). Finally, neoTCR-T cell products derived from monoclonal T cell responses targeting mutations in IFNLR1, PLA2G4A, SLC6A3 and GSDMB presented by HLA-A*03:01 and HLA-C*12:02 did not induce a cytotoxic response (Fig. 3c). No cytotoxic effect against the unmatched control melanoma cell line was observed with any of the neoTCRs (Fig. 3a–c). Pretreatment of the melanoma cell line with interferon gamma (IFNγ) to increase HLA expression did not increase the cytotoxicity of the weakest neoTCR-T cell products (Extended Data Fig. 4). All neoTCR-T cell products led to IFNγ and tumour necrosis factor (TNF) secretion after stimulation with increasing concentrations of the neoantigen–HLA multimers, which is consistent with the notion that all of these neoTCRs are each able to recognize their cognate antigen presented by the matched melanoma cell line. All neoTCR-T cell products, except for the products targeting mutations in PLA2G4A, SLC6A3 and GSDMB, also led to interleukin-2 (IL-2) secretion. A lower antigen threshold required for cytokine production (measured by a lower half-maximal effective concentration (EC50)) generally correlated with stronger killing activity. However, exceptions were found, for example, TRAPPC10 neoTCR-T cell products when stimulated with neoantigen–HLA had a low EC50 for cytokine secretion but did not lead to specific cytotoxicity, and some neoTCR-T cell products targeting NUP188 and WDR1 had high EC50 values for cytokine secretion but displayed a strong cytotoxic effect (Extended Data Fig. 5). The differences observed between cytokine secretion after stimulation with the multimer and the cytotoxicity against the autologous cell line are probably associated with differences in antigen expression and presentation of each neoantigen by the cell line. From patient 2, the 14 neoTCR clonotypes selected to generate the corresponding neoTCR gene-edited T cell products were specific for neoantigens derived from point mutations in IL8 (also known as CXCL8), PUM1 and TPP2 presented by two HLAs (Supplementary Table 1). After co-culture with the autologous melanoma cell line (M489), all neoTCRs triggered increased expression of the T cell activation markers 4-1BB and OX-40 on the surface of the gene-edited CD8+ T cells (Fig. 3d and Extended Data Fig. 6a). All neoTCRs except for neoTCR1 targeting a mutation in PUM1 were CD8 independent, as demonstrated by gene-edited CD4+ T cells binding to MHC–peptide, and also upregulated OX-40 after co-culture with the autologous cell line (Extended Data Fig. 7a,b). All 14 neoTCR-T cell products had a potent and specific cytotoxicity against M489. No cytotoxic effect against an unmatched control melanoma cell line was observed (Fig. 3e and Extended Data Fig. 6b). Moreover, the 14 gene-edited neoTCR-T cell products induced the release of variable levels of IFNγ, IL-2, TNF and IL-6 (Extended Data Fig. 6c) and displayed T cell degranulation and proliferation after co-culture with the M489 patient-matched melanoma cell line (Extended Data Fig. 6a,d). No non-specific T cell activation was observed in co-cultures with unmatched targets or with the negative control Neo12 TCR-T cells. The 21 neoTCR clonotypes isolated from patient 6 were also selected for generating the corresponding neoTCR-T cell products that targeted point mutations in NAT10, ATP11A, HP1BP3, PRPSAP2 and UVSSA presented by three HLA class I molecules (Supplementary Table 1). Initial attempts at testing these neoTCRs for T cell activation, cytokine responses and cytotoxicity after co-culture with the patient-specific melanoma cell line (M490) showed very little activity (Extended Data Fig. 8a,b). This was surprising given the good clinical response to PD-1 blockade therapy in this patient, so we reasoned that the neoantigen presentation may be low in the M490 cell line and may need to be upregulated by pre-exposure to IFNγ. When this step was added, CD8+ T cells expressing the 21 neoTCRs isolated from this patient resulted in upregulation of the surface expression of 4-1BB (Fig. 3f and Extended Data Fig. 8a). Upregulation of OX-40 was also observed in CD4+ T cells expressing CD8-independent neoTCRs (Extended Data Fig. 7c,d). neoTCR25 induced specific cytotoxicity to the matched melanoma cell line with and without IFNγ pre-exposure, whereas neoTCR26 induced cytotoxicity only with IFNγ pre-exposure (Fig. 3g and Extended Data Fig. 8b). Furthermore, neoTCR24, 25 and 26 targeting the mutation in ATP11A secreted IFNγ and TNF, and induced T cell proliferation (Extended Data Fig. 8c,d). Thus, 57 out of 57 neoTCRs from three patients with a clinical response to anti-PD-1-based therapy demonstrated reactivity to the patient-matched melanoma cell line with either reactive expression of activation markers or specific secretion of cytokines, and 34 of the 57 TCRs resulted in cytotoxicity to the patient-matched melanoma cell lines.
Fig. 3 |. Antitumour activity of the neoantigen-specific TCRs isolated in patients with a response to anti-PD-1.
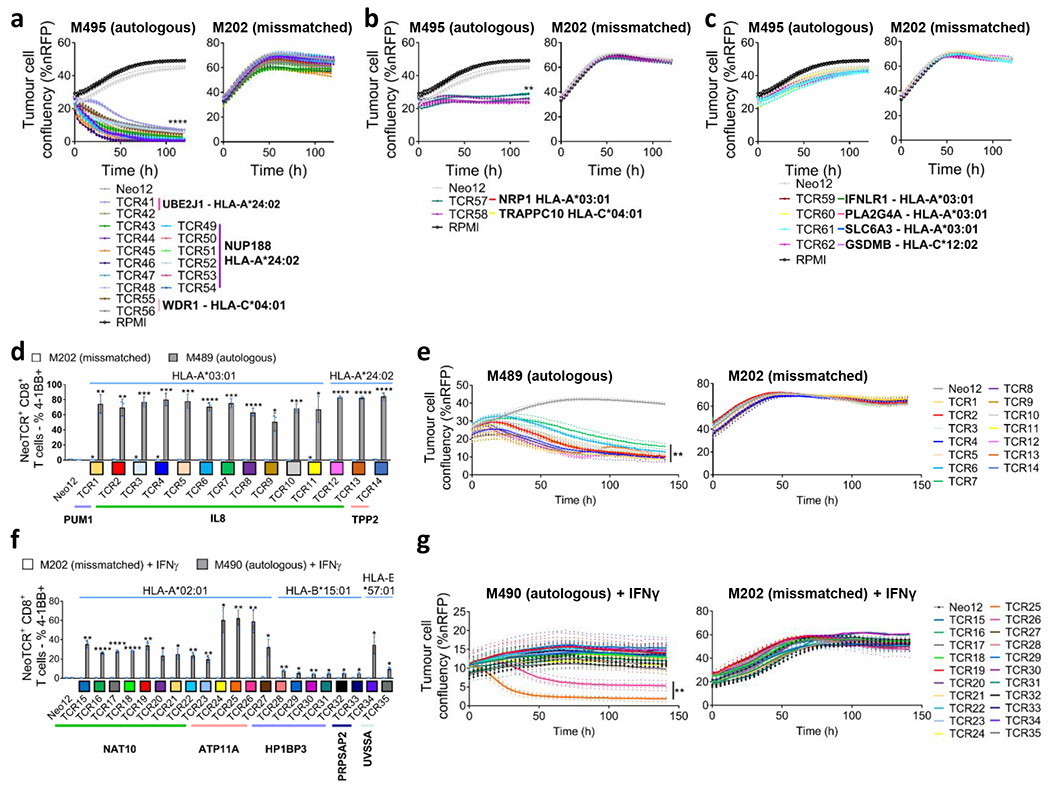
a–g, Healthy donor T cells were genetically modified to replace the endogenous TCR by the isolated neoTCRs from patient 1 (a–c), patient 2 (d,e) and patient 6 (f,g), and used to characterize the antitumour activity of these neoTCRs. The colour code for each TCR matches the colour of each T cell clonotype in Fig. 2. a–c, Specific target-cell killing by neoTCR gene-edited T cells from patient 1 against the autologous cell line (M495) and the mismatched control (M202) (P:T ratio 5:1; n = 4). The plots are divided between TCRs with strong killing (a), intermediate killing (b) or no killing (c). %nRFP, percentage of nRFP-positive area. d, 4-1BB upregulation in the CD8+neoTCR+ gene-edited T cells from patient 2 after co-culture with the autologous (M489) or mismatched (M202) cell lines (n = 3). e, Specific target-cell killing by neoTCR gene-edited T cells from patient 2 in the autologous cell line (M489) and the mismatched control (M202) (P:T ratio 1:1; n = 4). f, 4-1BB upregulation in CD8+ neoTCR+ gene-edited T cells from patient 6 after co-culture with the autologous (M490) or mismatched (M202) cell lines pretreated for 24 h with IFNγ (n = 3). g, Specific target-cell killing by neoTCR gene-edited T cells in the autologous cell line (M490) and the mismatched control (M202) target cells pretreated for 24 h with IFNγ (P:T ratio 10:1; n = 4). P values were calculated using two-tailed unpaired t-tests with Holm–Sidak adjustment for multiple comparisons versus Neo12; *P < 0.05, **P < 0.005, ***P < 0.0005, ****P < 0.0001. Exact P values are provided in the Supplementary Information. n values indicate the number of biological replicates. Data are mean with individual values (a–c,e,g) and mean ± s.d. with individual values (d,f). All T cell products contain CD8+ and CD4+ gene-edited T cells.
Next, the neoantigen-specific T cell responses from patients without a clinical response to anti-PD-1 therapy were characterized (patients 8 to 11). The biopsy from patient 8 had 977 non-synonymous mutations, of which 297 were expressed. The isolation library contained 196 capture reagents targeting 141 mutations presented by 6 HLA class I molecules. This library was used to capture neoantigen-specific T cells from baseline and on-treatment PBMCs. Overall, eight neoTCR clonotypes were identified targeting mutations in NES, CTNNB1, POLR2G and SERPINH1 in the on-treatment PBMCs, but no neoantigen-specific T cells were identified at baseline (Extended Data Fig. 9 and Supplementary Tables 1 and 2). The melanoma cell line from patient 9 had 193 non-synonymous mutations, of which 61 were expressed. A library of 172 capture reagents was assembled covering 71 mutations presented by the six HLAs class I. Five neoTCR clonotypes of neoantigen-specific T cells were isolated targeting four different mutations. Notably, some of the mutations evaluated did not have mRNA expression detected by sequencing. Characterization by neoantigen–HLA multimer binding validated only one neoTCR clonotype of the isolated neoTCRs present in one out of four blood or tumour samples studied, which targeted a mutation in GSTCD presented by HLA-C*05:01 (Fig. 4a and Supplementary Tables 1 and 2). The melanoma cell line from patient 10 (M485) had 71 non-synonymous mutations, 33 of which were expressed. A library of 132 neoantigen–HLA capture reagents covering 36 mutations presented by five HLAs was prepared and used to capture neoantigen-specific T cells from baseline blood and tumour samples (Supplementary Table 1). Two different neoTCR clonotypes of T cells were captured from blood targeting the same mutation in ACER3, which was predicted to be presented by HLA-A*03:01 and did show expression measured by RNA-seq (Fig. 4b and Supplementary Tables 1 and 2). Both neoTCRs were validated by neoantigen–HLA-specific binding. The melanoma cell line from patient 11 (M486) had 31 total non-synonymous mutations and 20 of them were expressed. The library contained 17 capture reagents covering 7 mutations presented by 3 HLA class I molecules (Supplementary Table 1). Fourteen neoTCR clonotypes covering five mutations were isolated. Among them, two neoantigen-specific T cell clonotypes that targeted mutations in PRELP and MSI2 confirmed specific binding to neoantigen–HLA complexes (Fig. 4c and Supplementary Tables 1 and 2). In summary, mutational neoantigen-specific T cell responses from patients without a response to anti-PD-1 therapy were often not polyclonal and were infrequently recurrent in blood and tumour samples over time.
Fig. 4 |. Neoantigen-specific T cell isolation from TILs and PBMCs, and neoTCR antitumour activity in patients without a response to anti-PD-1.
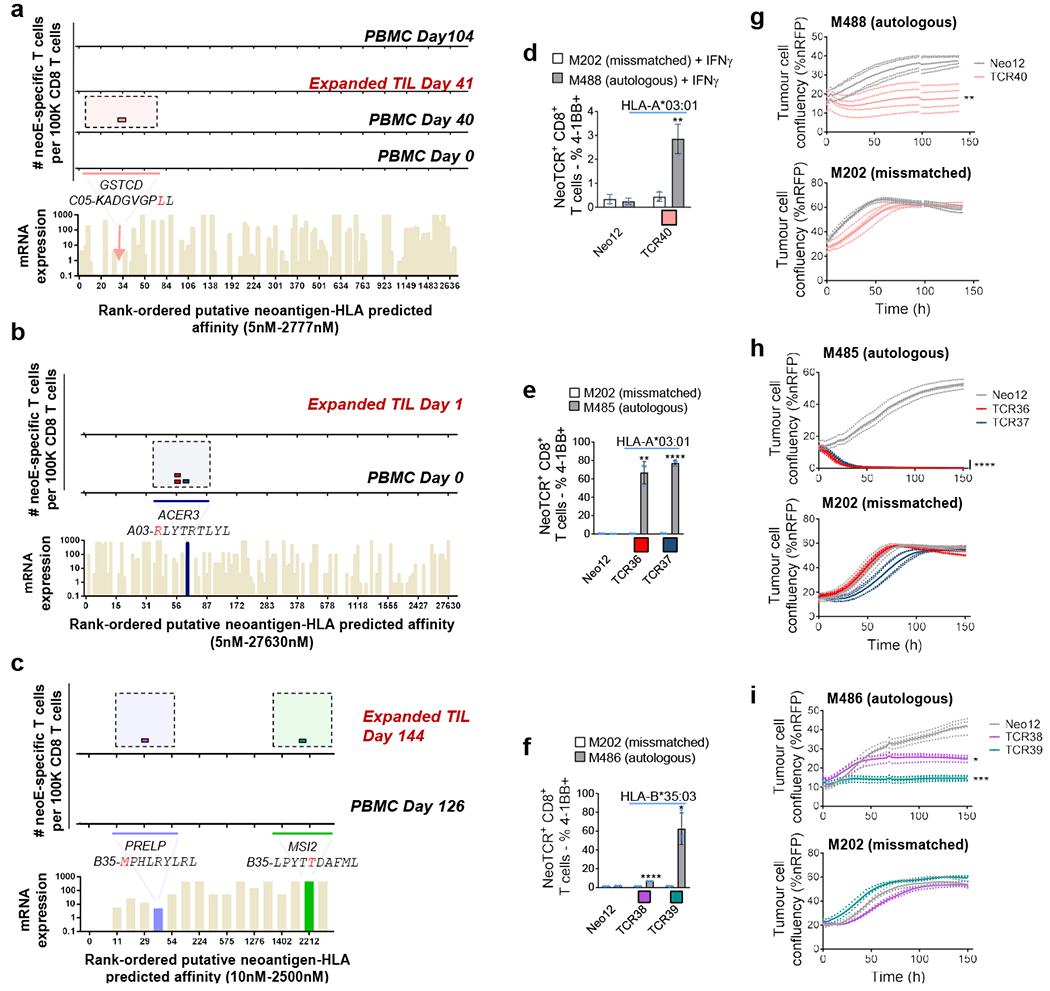
a–c. The landscape of the neoantigen-specific T cells for patients 9 (a), 10 (b) and 11 (c). Bottom, mRNA expression, measured in absolute reads, and predicted HLA-binding affinity of the putative neoantigens screened. Neoantigens targeted by T cells are highlighted in different colours. The predicted HLA-binding affinity for the neoantigen in patient 9 is highlighted with an arrow, as the expression is considered to be negative. The same colour code was used for the top panels to show the neoantigen specificity of the isolated T cells. Each little box represents one isolated T cell. Each colour represents a different neoantigen-specific T cell clonotype. The number of isolated T cells was normalized to 100,000 CD8+ T cells using a round-up method. Only T cell clonotypes with demonstrated binding to neoantigen–HLA complexes once expressed in healthy donor T cells are shown. d–f, 4-1BB upregulation in CD8+ neoTCR+ gene-edited T cells from patients 9 (d), 10 (e) and 11 (f), respectively, after co-culture with autologous (M488, M485 and M486, respectively) or mismatched (M202) cell lines (n = 3). g–i, Specific target-cell killing by neoTCR gene-edited T cells from patients 9 (g), 10 (h) and 11 (i) in the autologous cell lines and the mismatched control (P:T ratio 5:1, n = 4 (patients 9 and 10); and P:T ratio 10:1, n = 3 (patient 11)). P values were calculated using two-tailed unpaired t-tests with Holm–Sidak adjustment for multiple comparisons versus Neo12 (e,f,h,i) and two-tailed unpaired t-tests versus Neo12 (d,g).*P < 0.05, **P < 0.005, ***P < 0.0005, ****P < 0.0001. Exact P values are provided in the Supplementary Information, n values indicate the number of biological replicates. Data are mean ± s.d. with individual values (d–f) and mean with individual values (g–i). All T cell products contain CD8+ and CD4+ gene-edited T cells.
NeoTCR gene-edited T cell products from three patients without a clinical response to anti-PD-1 were analysed for functional specificity against their corresponding autologous melanoma cell lines established from biopsies from these patients (Fig. 4d–i and Extended Data Fig. 10). T cells expressing neoTCRs isolated from patients 9, 10 and 11 recognized the matched melanoma cell lines and upregulated the 4-1BB activation marker in CD8+ T cells after co-culture (Fig. 4d–f and Extended Data Fig. 10a,b,e). CD4+ T cells expressing CD8-independent neoTCRs also upregulated OX-40 after co-culture with the autologous cell lines (Extended Data Fig. 7e–i). T cells expressing all neoTCRs also displayed specific cytotoxicity against the corresponding autologous melanoma cell lines, without recognizing the mismatched control cell lines (Fig. 4g–i). Moreover, neoTCR36 and neoTCR37 from patient 10, and neoTCR39 from patient 11, also induced secretion of IFNγ, TNF, IL-2 and IL-6 and proliferation (Extended Data Fig. 10c,d,f). Thus, five out of five neoTCRs isolated from patients who did not respond to anti-PD-1-based therapy recognized the matched melanoma cell lines by upregulation of activation markers and inducing specific cytotoxicity.
In this study, we used recently developed techniques for the isolation of neoantigen-specific T cells16,17 and non-viral T cell gene editing15 to characterize the neoantigen-specific T cell responses in patients with melanoma with or without a clinical response to anti-PD-1-based therapy. Our results showed that neoantigen-specific immune responses to cancer target a limited number of immunodominant mutations (range 3 to 13) in melanomas irrespective of tumour mutational loads and clinical responses to immunotherapy. However, in patients with a long-lasting clinical response to anti-PD-1, the neoantigen-specific T cell responses were polyclonal, with multiple neoantigen-specific TCR clonotypes (range 1 to 23) targeting the same mutations recurrently over time, and detectable in both blood and tumour. These results suggest that natural T cell responses clear the tumour by targeting a very limited number of mutations with different T cell clonotypes, some of them recognizing different HLA–neoepitope complexes presenting the same non-synonymous mutations. However, we cannot exclude the role of T cells targeting non-mutated tumour-associated antigens, such as melanosomal differentiation antigens, in the overall antitumour responses31. Our findings highlight the importance of immunodominance in the T cell response against tumours and have implications for the design of neoantigen-specific therapies such as vaccines and adoptive T cell therapies. The epitope immunodominance observed in the natural T cell responses induced against tumours and unleashed by anti-PD-1 indicates that, despite the large number of potentially immunogenic mutations, with high antigen expression and high predicted HLA binding affinity, the immune system has evolved to target only a small number of immunodominant epitopes, similar to the T cell immune responses induced against viral infections32. The immunodominant antigens targeted by T cells are very limited and do not always correspond to the candidates with the highest antigen expression or predicted affinity for the HLA. Prediction of immunodominance could potentially help in the selection of antigens to be included in personalized neoantigen-specific vaccines and cellular therapies33. Moreover, the data presented here, added to previous reports34–36, suggest that a metric of TCR polyclonality could potentially be used as a biomarker of response to therapy and tumour reactivity by antigen-specific T cells. Our data show that the neoTCRs in polyclonal T cell responses induce strong antitumour activity against autologous cell lines, suggesting that a polyclonality metric could potentially aim in the selection of antigens to be targeted, as well as TCR candidates, to be used in personalized adoptive T cell therapies34. Neoantigen-specific T cell clones were detected in tumour and peripheral blood, in line with findings recently reported by other groups3,12,13,37, and consistent with both the concept of in situ expansion of pre-existing tumour-resident neoantigen-specific T cells38 and of clonal replacement of neoantigen-specific T cells that enter tumours after PD-1 blockade therapy39. Importantly, the correlation between the T cell responses isolated in blood and tumours highlights the relevance of blood as a minimally invasive source for the isolation and monitoring of tumour neoantigen-specific T cell responses3,40. Moreover, our results demonstrate that even patients without a response to anti-PD-1 therapy have neoantigen-specific T cells that, when expressed in donor T cells, are able to mount an effector response against autologous tumour cell lines and could potentially be used for personalized adoptive cell transfer therapy15.
Online content
Any methods, additional references, Nature Portfolio reporting summaries, source data, extended data, supplementary information, acknowledgements, peer review information; details of author contributions and competing interests; and statements of data and code availability are available at https://doi.org/10.1038/s41586-023-05787-1.
Methods
Patients, sample collection and response assessment
Patients with metastatic melanoma were selected as they signed an informed consent to collect PBMCs and tumour biopsies while receiving treatment with anti-PD-1 therapy alone or in combination with other agents. Additional biopsies and PBMC samples were longitudinally collected if the patient condition allowed. Matched melanoma cell lines (n = 9), PBMCs (n = 27) and TILs (n = 10) were used in this study. Biopsies and blood samples were collected under the University of California, Los Angeles (UCLA) Institutional Review Board approval 11-003254. Clinical response was assessed according to the RECIST criteria41.
PBMC purification, TIL expansion and cell line establishment
PBMCs from 5–20-ml blood samples were purified using Ficoll-Hypaque (GE Healthcare) gradient separation using SepMate-50 tubes (Stem Cell Technologies). After purification, PBMCs were cryopreserved in freezing medium (FBS (Omega Scientific) + 10% DMSO (Sigma-Aldrich)) and stored in liquid nitrogen. Cell lines and TIL cultures were established from core needle biopsies of metastatic lesions. TIL cultures were established using tumour fragments as previously described42 and cryopreserved either using the CTL Cryo ABC Freezing Kit (ImmunoSpot) or in CryoStor CS10 (StemCell Technologies). TIL cultures were established from baseline and on-therapy biopsies. To establish cell lines, the tissue was minced with disposable scalpels to generate a single-cell suspension and maintained in the tissue culture plates with DMEM 10% human AB serum (Omega scientific) supplemented with antibiotics and L-glutamine until the cells started growing. We consider that a cell line is established when there is no evidence of contaminating residual fibroblasts after at least 10–15 passages.
Cell lines and cell culture
All melanoma cell lines (M202, M446, M449, M485, M486, M488, M489, M490, M494 and M495) were maintained in RPMI supplemented with 10% fetal bovine serum (Omega Scientific), antibiotics and L-glutamine and kept at 37 °C in a humidified atmosphere of 5% CO2. Cell lines were periodically authenticated using short-tandem repeat analysis (GenePrint 10 System, Promega; analysis was outsourced to Laragen) and tested for mycoplasma (Mycoalert, Mycoplasma detection kit, Lonza). For cytotoxicity studies, all of the cell lines were transduced with a lentiviral vector expressing nuclear red fluorescent protein (nRFP) under the control of the EF1a promoter (Essen Bioscience) according to the manufacturer’s instructions, expanded and sorted using the FACS ARIA or FACS ARIA-H (BD Bioscience) system. Gene-edited T cells were cultured in gas-permeable rapid-expansion plates (G-REX, Wilson Wolf Manufacturing) in TexMACS (Miltenyi Biotec) plus 3% human AB serum (Valley Biomedical) medium supplemented with 12.5 ng ml−1 IL-7 plus 12.5 ng ml−1 IL-15 (Miltenyi Biotec). Supplemented medium was exchanged every 2–3 days.
Identification of tumour somatic coding mutations and neoantigen selection
Tumour cell lines derived from patient tumour biopsies or tumour biopsies and their respectively matched PBMC were analysed using WES. Moreover, RNA-seq was performed on tumour cell lines or biopsies. DNA and RNA were isolated from cell lines (1 million cells) and PBMCs (1–3 million cells) using the Qiagen DNeasy Blood & Tissue Kit (Qiagen) and the Qiagen RNeasy kit (Qiagen) according to the manufacturer’s instructions. For tumour biopsies, DNA and RNA was simultaneously extracted using the AllPrep DNA/RNA Micro kit (Qiagen). WES and RNA-seq was performed at the Technology Center for Genomics & Bioinformatics (TCGB) core at UCLA using the Illumina HiSeq 3000 platform with a read length of 2 × 150 bp paired-end. Libraries for WES were generated using the Nimblegen SeqCap EZ Human Exome Library v.3.0 (Roche). Poly(A) selection was used for RNA-seq library construction.
Two different neoantigen prediction and ranking pipelines were used in this study. In the first pipeline, WES sequences were first aligned to the human hg19 reference genome using BWA-MEM43. Somatic coding mutations identified by both VarScan2 (v.2.3.9) and MuTect (v.1.1.7) were retained as potential neoantigens44–46. Second, RNA-seq sequences were mapped to the human hg19 genome, quantified and normalized using HISAT2 (v.2.0.4) and StringTie (v.1.2.2). Third, the neoantigen sequences and patient’s HLA types identified from patient’s PBMC WES data using OptiType (v.1.3.1)47 were used as an input for HLA–peptide binding affinity prediction using netMHCpan (v.3.4)48. Finally, the HLA-peptide complexes with predicted binding affinities among the top 2% ranking with respect to each HLA were selected and from these, and only the peptides with confirmed expression by RNA-seq were selected to proceed with the screen.
The second neoantigen prediction and ranking was performed using analysis workflows in Common Workflow Language (CWL) developed by the McDonnell Genome Institute followed by pVACtools21 (https://pvactools.readthedocs.io/en/latest/#). In brief, WES sequences were aligned to the human hg19 reference genome using BWA-mem. Somatic coding mutations were identified using VarScan2 (v.2.4.2), MuTect (GATK, v.3.6), Strelka (v.2.9.9) and Pindel (v.0.2.4b8). The results were combined into a variant calling format (VCF) file using the GATK Combine Variants tool and annotated using Variant Effect Predictor (VEP). RNA-seq sequences were mapped to the human hg19 genome using HISAT2, and gene and transcript expression was estimated and normalized using Kallisto. Patients’ PBMC WES data were used as input to OptiType for HLA typing. RNA gene and transcript expression information was added to the VCF file using VAtools. The fully annotated VCF was then analysed with pVACtools (v.1.1.4) using eight class I prediction algorithms for neoantigen peptide lengths 8–11. Current MHC class I algorithms supported by pVACtools are NetMHCpan (v.4.0), NetMHC (v.4.0), NetMHCcons (v.1.1), PickPocket (v.1.1), SMM (v.1.0), SMMPMBEC (v.1.0), MHCflurry (version 1.2.2) and MHCnuggets (v.2.2). Potential neoantigens were then filtered and prioritized according to the following criteria: number of algorithms with good binding predictions (<500 nM) ≥ 2, best fold change > 1, tumour RNA VAF > 5%, tumour RNA coverage > 10 reads, normal DNA VAF < 2%, normal DNA coverage > 5 reads, tumour DNA VAF > 5%, tumour DNA coverage > 10 reads, transcript expression > 1 FPKM and gene expression > 1 FPKM.
The two lists of putative neoantigens were combined and used to proceed with the generation of the HLA–peptide complex library used for the screen from patients 2, 6, 9, 10 and 11.
Preparation of HLA–peptide complex libraries
peptide–HLA complex libraries were generated by assembling single-chain trimers49, where neoantigen peptides were fused in sequence to beta-2-microglobulin (β2M) domains and the HLA, each domain being linked with (G4S)4 motifs. In brief, double-stranded oligo nucleotides (IDT) were ligated into pcDNA3.1 vectors encoding linkers, β2M and the corresponding HLA, and the expression sequence was amplified by PCR. This process was performed in 96-well format for high-throughput library construction. DNA clones were verified by SANGER sequencing and plasmids were complexed with ExpiFectamine (Thermo Fisher Scientific) and transfected into Expi293F (Thermo Fisher Scientific) cells according to the manufacturer’s recommendations. Cells were collected after 5 days, and the supernatants were clarified using 96-well Pall filters. Proteins were biotinylated with biotin ligase BirA (Avidity) for 2 h at room temperature. Biotinylated proteins were purified by IMAC (Ni-Sepharose) using the Phynexus Phytip system and buffer-exchanged into HBS using the Thermo Fisher Scientific Zeba Spin 7k MWCO plates or by Zn(+)-loaded HiTrap capto-chelate resin in tandem with HiTrap Desalting columns to remove imidazole. The manufacturer’s recommendations were followed and protein was resuspended into HEPES 50 mM pH 7.5, NaCl 150 mM. The protein concentration was determined by absorbance at 280 nm.
In parallel, each HLA–peptide protein was DNA-barcoded and multimerized by the two different fluorescent streptavidins (phycoerythrin (PE) or allophycocyanin (APC), Thermo Fisher Scientific) as described previously50,51. The DNA barcode (ordered from IDT) followed the structure: universal primer 1-NNNNN-barcode-NNNNNN-universal primer 2, for example, CTCGCCACGTCGGCTATCCTGATCGGATG NNNNNN TCAATCCG NNNNNN CTGGACGTGAGCAAGCTACAGCGACCTC is a representative DNA barcode sequence. In brief, biotinylated peptide–HLA proteins and biotinylated DNA barcodes were mixed at a 3:1 molar ratio, and then complexed into fluorescently labelled multimers with PE-streptavidin or APC-streptavidin (Life Technologies) at 4:1 molar ratio of streptavidin to biotin. Each patient’s peptide–HLA multimers were then pooled, concentrated and used to stain cells.
Patient sample neoantigen-specific T cell identification
The barcoded and fluorescently multimerized neoantigen–HLA elements were pooled together to create the putative neoantigen–HLA libraries specific for each patient. Cryopreserved patient PBMCs and TILs were thawed. CD8 cells were then enriched from PBMCs and TILs using a negative human CD8 T cell isolation kit (Miltenyi) according to the manufacturer’s recommended protocol. Isolated CD8 T cells were stained with corresponding patient-specific putative neoantigen–HLA libraries (PE and APC labelled) on ice for 15 min. Human TruStain FcX (Fc receptor blocking solution, BioLegend) was used to avoid non-specific binding. Cells were then stained using a cocktail containing antibodies against human CD4 (A161A1), CD14 (63D3), CD19 (H1B19), CD20 (2H7) and CD40 (5C3) (FITC for all, BioLegend); CD8 (HIT8a, PerCp-Cy5.5, BioLegend), CD45RA (HI100, BV711, BioLegend), CD39 (A1, BV510, BioLegend), CD103 (Ber-ACT8, BV650, BD Biosciences) and CD95 (DX2, BV786, BD Biosciences) along with an amine-reactive viability dye (Invitrogen). Finally, cells were stained for annexin V (BV605, BD Horizon) to further differentiate between viable and apoptotic cells before subjecting to flow analysis. Antibodies and dyes were used according to the manufacturer’s suggestions.
Neoantigen-specific T cells were isolated by fluorescence-activated cell sorting (FACS Aria III, BD Biosciences). The gating strategy is shown in Supplementary Fig. 1. Antigen-experienced CD95+multimer (double APC and PE stain)+CD8+ T cells were sorted as single cells using the FACSAria III system (BD Biosciences) into individual wells of plates with lysis buffer (10 mM Tris + RNase inhibitor, Promega). These wells were then processed for reverse transcription and PCR to amplify the T cell receptor and barcode DNA sequences. Reverse transcription and first-round PCR were performed as previously described17. First, the master mix comprising the following reagents were prepared: nuclease-free water (Invitrogen), dNTP (Qiagen), TCR Va multi primer mix, TCR Vb multi primer mix, TCR Ca antisense primer, TCR Cb antisense primer, barcode sense primer, barcode antisense primer (all primers ordered through IDT), Onestep RT-PCR enzyme (Qiagen), 5× buffer for OneStep RT–PCR enzyme and KOD polymerase (Millipore). This master mix was added to each cell lysate well, and the plates were thermally cycled to reverse transcribe and PCR amplify the TCR and barcode DNA sequences. An additional two rounds of PCR were performed to further amplify the TCR and barcode sequences, and to append adapter sequences for next-generation sequencing. The sequencing library was prepared according to Illumina’s recommended protocol, with PhiX controls (Illumina) mixed into the library to provide additional sequence diversity. Next-generation sequencing was performed on the Miniseq (Illumina) sequencer using the manufacturer’s recommended reagents and protocols. The sequencing data were demultiplexed to enable separation of the reads according to their cells of origin; individual reads were categorized as TCRα, TCRβ and barcode reads. TCRα and TCRβ reads were used to identify V and J chains, and to reconstruct CDR3 sequences as well as full-length VDJ regions by leveraging IMGT library52, using the MiXCR program53. Owing to non-specific binding events, not all dual-fluorescent-positive cells are neoantigen specific.
By analysing DNA barcodes, neoantigen-specific T cells would predominantly have the same barcode, whereas non-specific T cells would have different barcodes. TCR sequences from neoantigen-specific T cells were selected and used to genetically modify healthy donor T cells as described below.
Homology-directed repair template generation
The patient-specific homology-directed repair template plasmid (PACT Pharma) was generated using standard molecular cloning techniques. To prepare the vector backbone for cloning, variable alpha and variable beta DNA stuffer sequences were removed by digesting with the restriction enzymes BsmBI and PstI (New England Biolabs). DNA ends were dephosphorylated using calf alkaline phosphatase (New England Biolabs) and stuffer sequences were removed by agarose gel electrophoresis followed by gel extraction of non-stuffer sequences (Zymo Research).
Patient neoTCR variable regions were PCR-amplified from isolated single-cell reverse transcription product or PCR product using variable-region-specific primers (IDT) and KOD Hot Start Master Mix (EMD Millipore). PCR reactions were assembled according to the manufacturer’s protocol and amplification was performed using the following thermocycling conditions: (1) 95 °C for 2 min; (2) 95 °C for 20 s; (3) 62 °C for 15 s; (4) 70 °C for 10 s; (5) repeat steps 2–4 four times; (6) 95 °C for 20 s; (7) 70 °C for 10 s; (8) repeat steps 6–7 24 times; (9) 70 °C for 5 min. Amplicons were column purified (Zymo Research) and normalized using concentrations determined by spectrophotometry (Nanodrop, Thermo Fisher Scientific). Reamplification was performed if necessary using the following thermocycling conditions: (1) 95 °C for 2 min; (2) 95 °C for 20 s; (3) 62 °C for 15 s; (4) 70 °C for 10 s; (5) repeat steps 2–4 four times; (6) 95 °C for 20 s; (7) 70 °C for 10 s; (8) repeat steps 6–7 29 times; (9) 70 °C for 5 min. Amplicons were verified for the correct size by agarose gel electrophoresis and further analysed by Sanger sequencing to verify identity (ELIM Biopharmaceuticals). Vector backbone and amplicons were assembled using Gibson Assembly Ultra (Synthetic Genomics) and transformed into DH5a competent bacterial cells (New England Biolabs). Individual clones were isolated and cultured for plasmid purification by miniprep (Qiagen) and endotoxin-free maxiprep (Thermo Fisher Scientific). Patient-specific HDR templates were verified through Sanger sequencing and agarose gel electrophoresis. The patient-specific HR template plasmids were designed to direct the integration of the gene cassette into the first exon of TRAC as described previously15. In brief, the payload consisted of the following structure: P2A, human growth hormone (HGH) signal sequence, neoTCR β chain, furin-cleavage site, P2A, HGH signal sequence, neoTCR α variable region and partial TRAC constant chain. Homology arm sequences homologous to the TRAC locus flanked the plasmid payload and were 1,000 bp each.
RNP preparation
CRISPR–Cas9 nucleases were introduced into T cells by electroporation of pre-complexed RNPs. These two RNP species each comprised the sNLS-spCas9-sNLS nuclease protein (Aldevron, 9212-5MG) pre-complexed with a single guide RNA (sgRNA) (Synthego Corporation) targeting either the TRAC constant domain sequence of TCRα or TRBC constant domain sequence of TCRβ, respectively (TRAC target sequence: GAGAATCAAAATCGGTGAAT(AGG); TRBC target sequence: GGCTCTCGGAGAATGACGAG(TGG), protospacer adjacent motif (PAM) sequence are denoted in parentheses). Both the TRAC and TRBC sgRNA were synthesized to include three chemically modified bases at both the 5′ and 3′ ends (TRAC sgRNA sequence: [mG](ps)[mA](ps)[mG](ps)AAUCAAAAUCGGUGAAUGUUUUAGAGCUAGAAAUAGCAAGUUAAAAUAAGGCUAGUCCGUUAUCAACUUGAAAAAGUGGCACCGAGUCGGUGC[mU](ps)[mU](ps)[mU](ps)U; and TRBC sgRNA sequence: [mG](ps)[mG](ps)[mC](ps) UCUCGGAGAAUGACGAGGUUUUAGAGCUAGAAAUAGCAAGUUAAAAUAAGGCUAGUCCGUUAUCAACUUGAAAAAGUGGCACCGAGUCGGUGC[mU](ps)[mU](ps)[mU](ps)U. The modifications are denoted above as follows: 2′-O-methyl base modification is denoted by [m] and 3′ phosphorothioate modified linkage is denoted by (ps).
To complex RNPs, lyophilized sgRNAs were first resuspended in TE buffer (Tris 10 mM, EDTA 1 mM, pH 8.0) (Teknova) to 600 μM and then diluted to 120 μM in sterile water. Reconstituted sgRNA was then complexed with Cas9.
T cell gene editing and validation of neoantigen specificity
Primary human T cells were isolated from an enriched leukapheresis product collected from healthy donor peripheral blood (HemaCare) either fresh or previously cryopreserved in 1% human serum albumin (Gemini), 49% plasmalyte (Baxter) and 50% CS10 (Sigma-Aldrich). If cryopreserved cells were used, cells were thawed and washed in TexMACS (Miltenyi) plus 10% human AB serum (Valley Biomedical) and seeded at a density of about 2 × 10⁶ cells per ml in TexMACS plus 3% human AB serum (culture medium). One day after thaw, or immediately if used fresh, CD4+ and CD8+ T cells were isolated by positive selection using the CliniMACs Prodigy (Miltenyi Biotec) system or using magnetic LS columns and CD4 and CD8 microbeads (Miltenyi Biotec). Cells were then reseeded in culture medium at a density of 1.46 × 10⁶ cells per ml plus 12.5 ng ml−1 IL-7 (Miltenyi) plus 12.5 ng ml−1 IL-15 (Miltenyi) plus 1:17.5 ratio of TransACT T cell activation reagent (Miltenyi Biotec) by volume.
Then, 2–3 days after activation, 80 μl of T cells at a concentration of 5–10 million cells per μl resuspended in P3 buffer (Lonza) were electroporated with 30 μg of neoTCR plasmid and 6.67 μl of pre-complexed RNPs as prepared above using Lonza X-unit in 100 μl cuvettes and program EO-115. Cells were expanded in culture medium supplemented with 12.5 ng ml−1 IL-7 plus 12.5 ng ml−1 IL-15 in 24-well G-rex (Wilson Wolf). Supplemented medium was exchanged every 2–3 days.
NeoTCR binding analyses
To validate the neoantigen-specificity of the cloned TCRs, gene-edited T cells were stained with neoantigen–HLA multimers (30 nM, manufactured in-house as described previously15). This procedure was used to validate TCRs for patients 1, 2, 6, 9, 10 and 11. In brief, specific binding of the patient-specific neoTCR was confirmed by flow cytometry. Biotinylated peptide–HLA molecules were fluorescently labelled with PE–streptavidin (Thermo Fisher Scientific) and biotin-labelled dextran (500 kDa, Nanocs) to generate a dextramer for staining as previously described54. Cells were stained with a fixable viability dye, the matched peptide–HLA dextramer to measure neoTCR binding, CD4 and CD8. Cells were permeabilized and stained intracellularly with 2A antibody to assess gene editing. Gene editing was confirmed if ≥5% of the T cells stained positive for 2A. TCR identity was confirmed if ≥5% of neoTCR+ T cells stained positive for the matched peptide–HLA dextramer.
T cell functional analysis of T cell activation, cytokine release, proliferation, degranulation and cytotoxicity
We measured T cell activation, cytokine release and proliferation after co-culture with autologous (M485, M486, M488, M489, M490 and M495) or mismatched (M202) melanoma cell lines, as well as after stimulation with increasing amounts of specific neoantigen–HLA molecules. In brief, for co-cultures with target cells, melanoma cells (25 × 103 cells per well for T cell proliferation and cytokine release or 30 × 103 for T cell activation) were seeded in 96-well plates, and incubated overnight either with medium alone or, where indicated, with medium supplemented with IFNγ (2,000 IU ml−1, Millipore). Melanoma cells were then washed and neoTCR gene-edited T cells were added with a product:target (P:T) of 5:1.
To measure cytokine release, we collected the co-culture supernatant at 24 h and stored it at −80 °C. When ready for the analysis, the supernatants were thawed on ice and the concentration of IFNγ, TNF, IL-2 and IL-6 was measured using a cytokine bead array (Human Th1/Th2 Cytokine kit, BD bioscience). The data are shown normalized to the percentage of gene-edited T cells.
To measure T cell activation, after 20–24 h co-culture, T cells were collected, washed with PBS and stained with Zombie Violet (1:100, BioLegend) live/dead stain in PBS. After incubation, cells were stained with neoantigen–HLA multimers–PE (30 nM) and then with CD45–FITC (HI30, BD Bioscience), 4-1BB-APC (4B4-1), CD8-BV605 (RPA-T8), CD4-BV510 (OKT4) and OX40-PECy7 (Ber-ACT35) (all from BioLegend) antibodies at the concentrations recommended by the manufacturers.
To measure T cell proliferation, after 24, 48, and 72 h co-culture, T cells were collected, washed and stained with Live/Dead NIR fluorescent reactive (1:250 Invitrogen). After incubation, cells were washed, stained with neoantigen–HLA multimers–PE (30 nM), and then with CD8-BV605 (RPA-T8, 1:50, BioLegend) antibodies. After incubation, cells were then washed, permeabilized with fixation/permeabilization working solution (FOXP3/Transcription Factor Staining Buffer Set, Thermo Fisher Scientific), washed with permeabilization buffer (FOXP3/Transcription Factor Staining Buffer Set, Thermo Fisher Scientific) and stained with Ki67-BV421 (B56, 1:100, BD Biosciences) antibodies.
T cell degranulation was measured after 12–16 h co-culture with autologous or mismatched cell lines. A total of 50 × 103 melanoma cells were seeded in 48-well plates and incubated 8 h with either medium alone or medium supplemented with IFNγ (2,000 IU ml−1, Millipore). After incubation, melanoma cells were washed and 250 × 103 neoTCR gene-edited T cells were added (P:T = 5:1) together with CD107a-APC-H7 (H4A3, BD) antibodies at the recommended concentration. After 1 h incubation, brefeldin A and monesin (BD Golgi Plug and BD Golgi stop, BD Biosciences) were added at half the recommended concentration to inhibit the protein transport. Cells were incubated for 11–15 h more and then surface expression of CD107a was measured using flow cytometry. In brief, T cells were collected and stained with Zombie Violet Live/Dead, neoantigen–HLA multimer–APC, CD45-FITC (HI30) and CD107a-APC-H7 (H4A3) (both from BD Bioscience) and CD8-BV605 (RPA-T8) (BioLegend).
In all flow cytometry staining experiments, after the last incubation with antibodies, cells were then washed, fixed and stored at 4 °C until flow cytometry acquisition. All stains and washes were performed in stain buffer (BD bioscience) unless otherwise indicated. Flow cytometry acquisition was performed on the Attune NxT flow cytometer (Invitrogen) according to the gating strategy shown in Supplementary Fig. 2.
To measure cytotoxicity, 25 × 103 cells per well of the nRFP melanoma cell lines were seeded into 96-well plates, and incubated overnight either with medium alone or, where indicated, with medium supplemented with IFNγ (2,000 IU ml−1, Millipore). Melanoma cells were then washed and neoTCR gene-edited T cells were added with P:T ratios ranging from 10:1 to 1:1. After adding the T cells, melanoma cells were imaged using a real-time live cell imaging system (Incucyte, Essen Biosciences) and followed for at least 150 h.
NeoTCR gene-edited T cells targeting an irrelevant mutation in these cell lines (Neo12) were used as a control in all of the experiments. All functional studies were performed in melanoma cell medium, not supplemented with cytokines. T cell activation, degranulation, proliferation and cytokine release assays were performed in biological triplicates. Cytotoxicity experiments were performed in biological quadruplicates unless otherwise stated.
For specific neoantigen–HLA neoTCR-T cell stimulation, plate-bound antigen stimulation was used. In brief, streptavidin-coated plates (Eagle Biosciences) were preincubated with cognate or control neoantigen–HLA molecules at a concentration of 0.1–1,000 ng ml−1 peptide–HLA for 2–5 h at room temperature or 16–30 h overnight at 4 °C. NeoTCR-T cell products were then stimulated on the plates in T cell culture medium (TexMACS plus 3% human AB serum plus 1% penicillin–streptomycin, Gibco) at 37 °C and 5% CO2 overnight, 100 × 103 cells per well were seeded. The supernatant was then collected and used to measure IFNγ, TNF and IL-2 by CBA (Human Th1/Th2 Cytokine Kit II, BD Biosciences), acquired on the Attune NxT flow cytometer (Thermo Fisher Scientific) and EC50 values were calculated for IFNγ in GraphPad Prism.
Software
MiXCR (v.2.1.3) was used to reconstruct CDR3 sequences, FlowJo (v.10.5.0) was used to analyse flow cytometry data and GraphPad Prism (v.7.05) was used for data representation and statistical analysis.
Statistics and reproducibility
In T cell functional studies, two-sided unpaired t-tests with Holm–Sidak adjustment for multiple comparisons was used to compare between neo-antigen-specific TCR and the Neo12 TCR control or between autologous and mismatched control cell lines. The P values adjusted for multiple comparisons are shown in the figures and the exact values are listed in the statistical data tables in the Supplementary Information. The number of biological replicates and significance is indicated in each figure legend. Functional experiments with TCRs isolated from patient 2 were repeated in two different healthy donors with similar results. Experiments for the rest of the patients were not repeated in additional healthy donors.
Reporting summary
Further information on research design is available in the Nature Portfolio Reporting Summary linked to this article.
Extended Data
Extended Data Fig. 1 |. Neoantigen-specific T-cell isolation and TCR clonotype identification. Summary of key parameters from the longitudinal landscape analysis of neoantigen-specific T cells in patients with and without response to therapy.
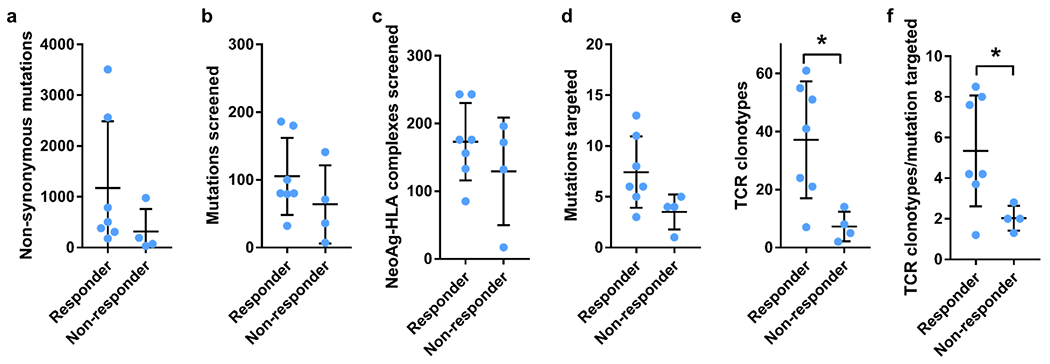
a, Total number of non-synonymous mutations. b, Total number of mutations screened. c, Total number of predicted neoantigen–HLA complexes screened. c, Total number of mutations targeted. e, Total number of neoantigen-specific TCR clonotypes isolated. f, Ratio of the number of neoantigen specific TCR clonotypes isolated per mutation targeted in each patient. Mean ± SD and individual values are plotted. (n) indicates the number of different patients, n = 7 for responders and n = 4 for non-responders. * p < 0.05, two-tailed unpaired t test, using the Two-stage linear step-up procedure of Benjamini, Krieger and Yekutieli, with Q = 1%. p = 0.0190 for TCR clonotypes and p = 0.0434 for TCR clonotype/mutation targeted.
Extended Data Fig. 2 |. Neoantigen-specific T-cell isolation from PBMCs in patients with response to anti-PD-1 therapy.
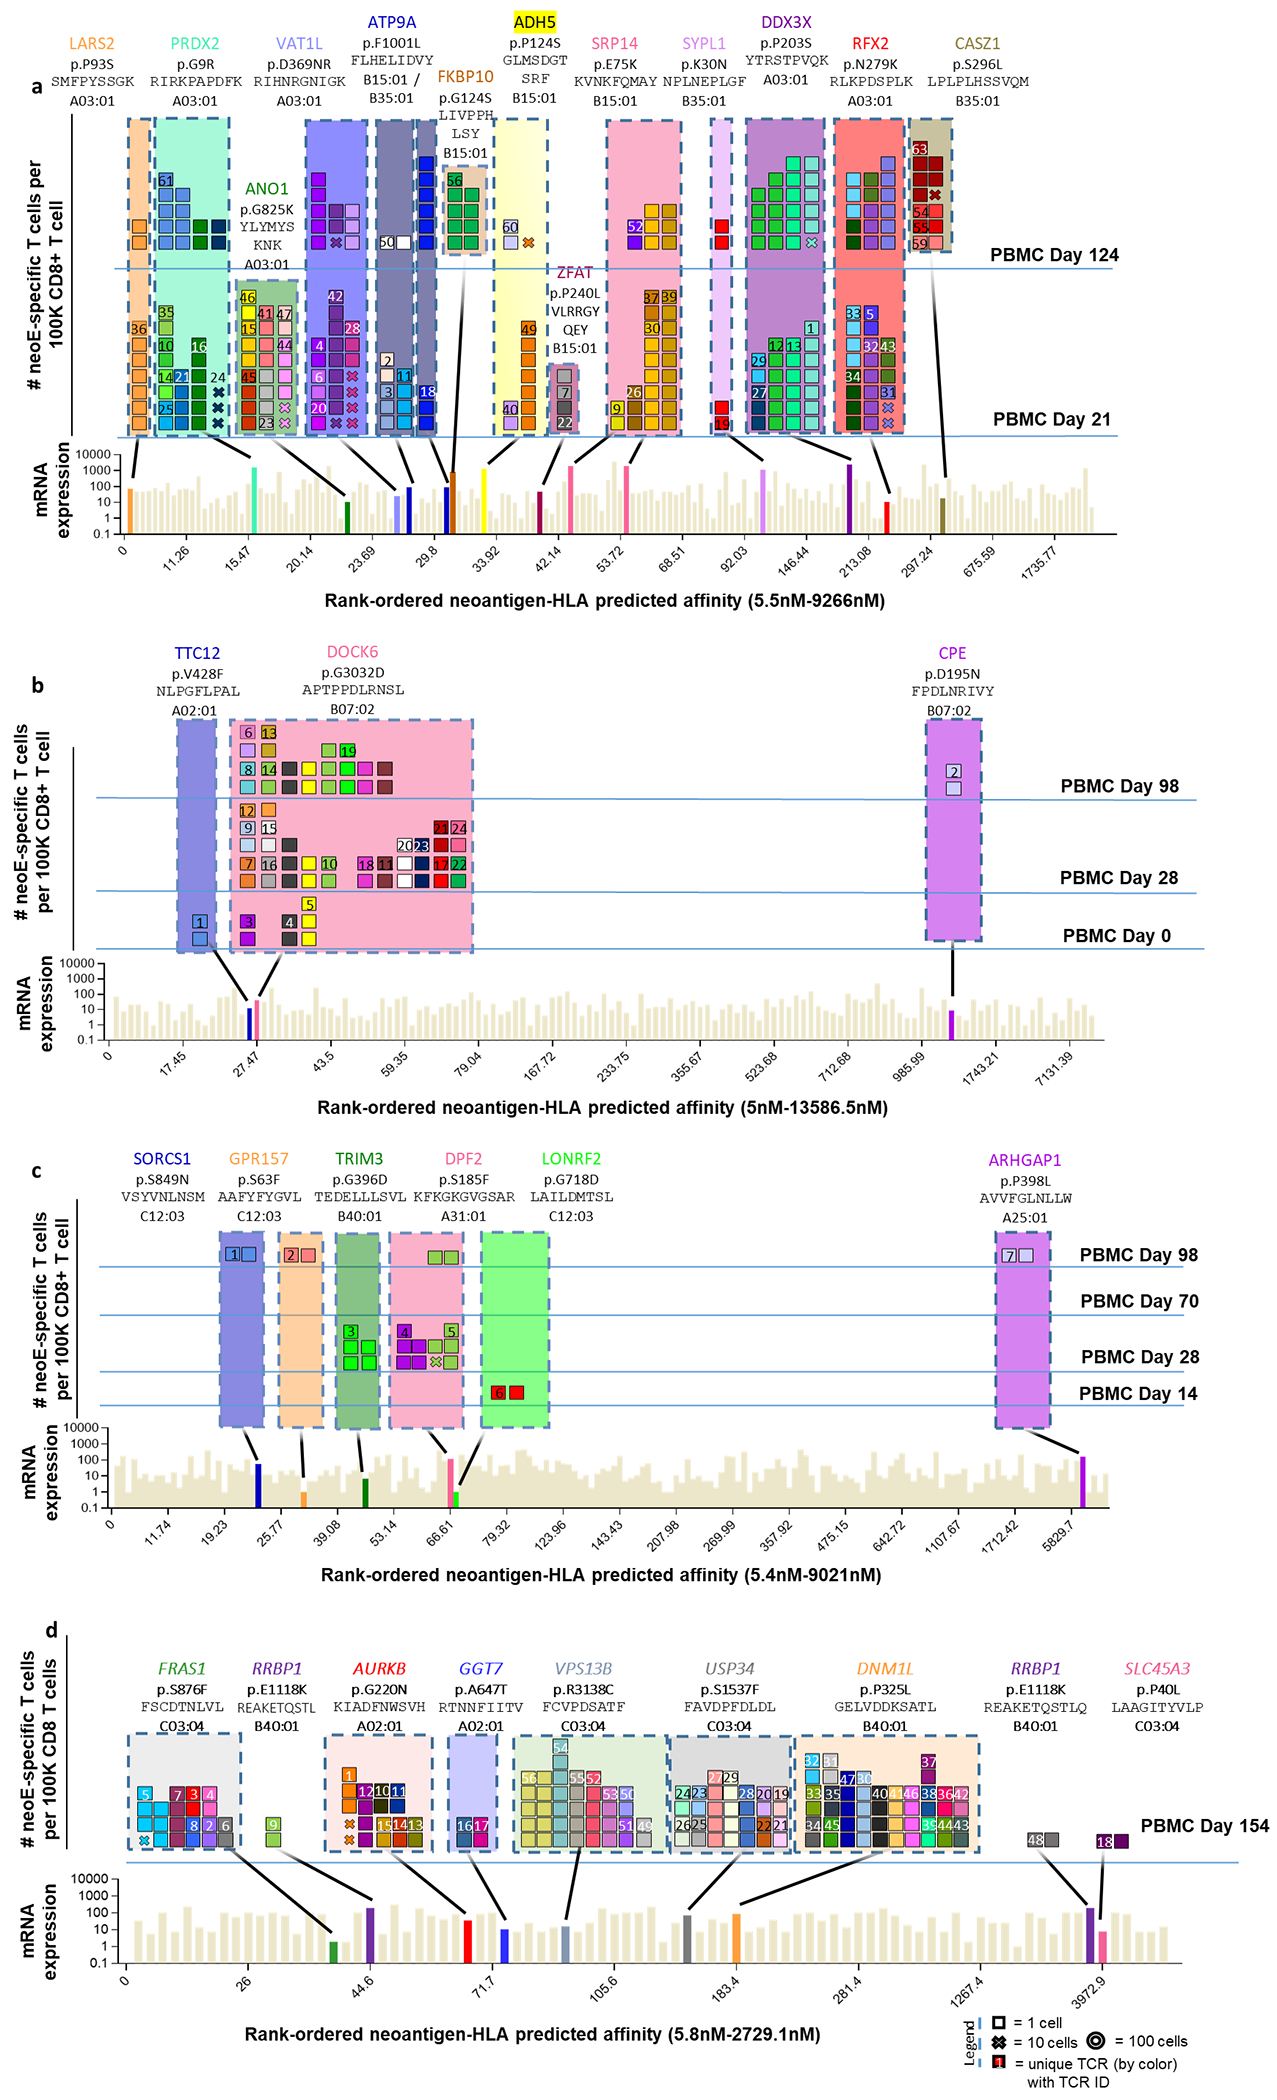
a, Landscape analysis of the neoantigen-specific T cells over time in patient 3. Bottom panel shows mRNA expression and predicted HLA binding affinity of the putative neoantigens screened. Neoantigens targeted by T cells are highlighted in different colours. The same colour code is used in the top panels to show the neoantigen specificity of the isolated T cells. The top panels show the evolution over time of the neoantigen-specific T cells in PBMCs. Each box represents one isolated T cell, each cross is equivalent to ten isolated T cells, and each circle is equivalent to 100 isolated T cells. Each colour represents a different neoantigen-specific T-cell clonotype. The TCR ID is also plotted. The number of isolated T cells is normalized to 100,000 CD8+ T cells using a round up method to plot the data. The mutated gene name, the point mutation, the sequence of the neoantigen, and the HLA are indicated on top of the figure. The T cell clonotypes shown have not been validated by expression in healthy donor T cells and binding to neoantigen–HLA complexes. b, Same as a for patient 4. c, Same as a for patient 5. d, Same as a for patient 7.
Extended Data Fig. 3 |. Captured neoTCR specific neoantigen–HLA binding validation.
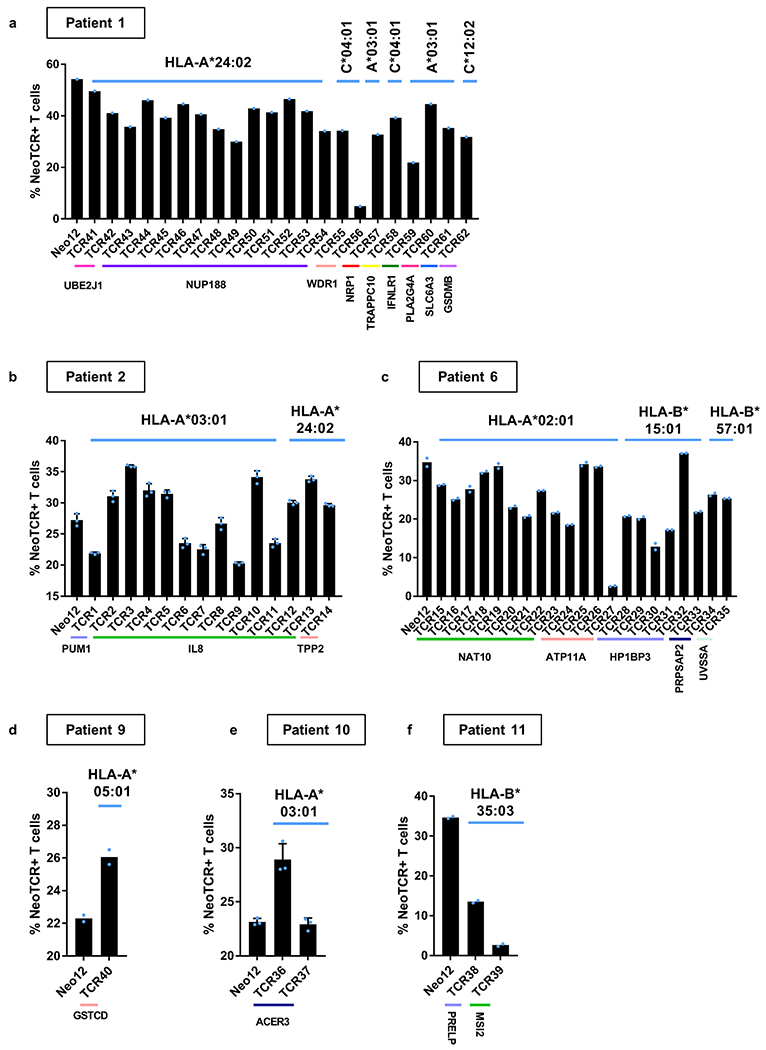
After capture of the neoantigen-specific T cells, the cognate TCR is sequenced, and the sequence used to gene edit healthy donor T cells replacing the endogenous TCR by the neoTCR. The neoTCR specificity and stability are validated by multimer staining of the gene-edited T cells. Only validated TCRs are shown. a-f. Multimer staining of the gene edited T-cell products gated on live cells from patient 1 or Live/CD45+ cells from patients 2, 6, 9, 10, 11 (n = 1 for patient 1, n = 2 for patient 6, 9 and 11, and n = 3 for patients 2 and 10). Mean ± SD and individual values are plotted. (n) indicates the number of technical replicates.
Extended Data Fig. 4 |. Cytotoxicity induced by neoantigen-specific TCRs from patient 1 upon co-culture with the autologous cell line.
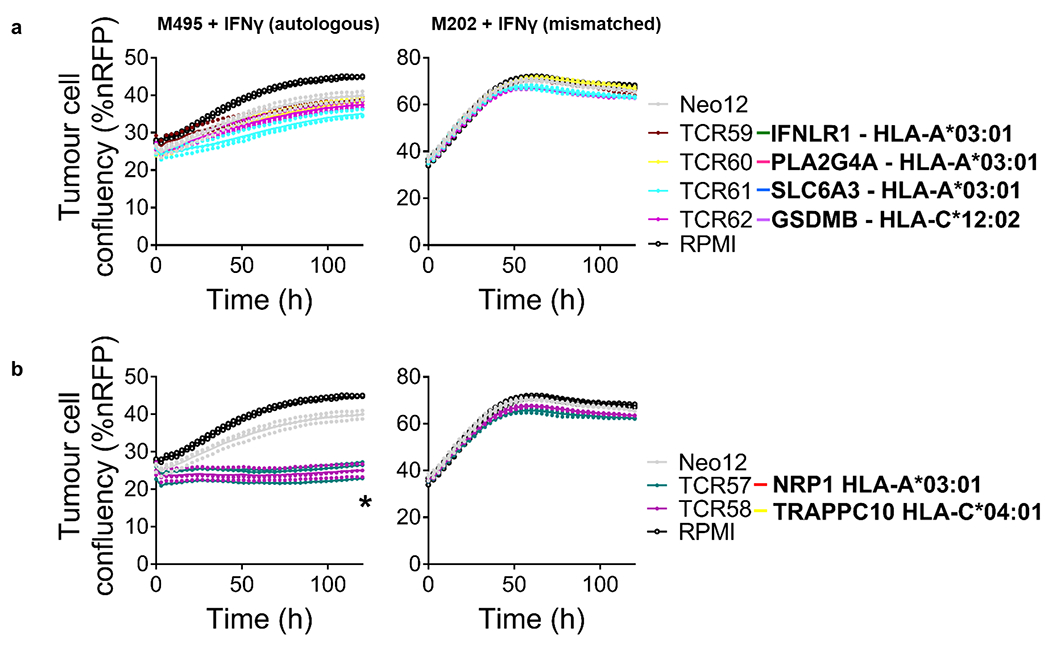
Healthy donor T cells genetically engineered to express the captured neoTCRs from patient 1 were co-cultured with the autologous (M495) or a mismatched cell line (M202). a-b, Specific target-cell killing by neoTCR gene-edited T cells of the autologous cell line and the mismatched control (P:T ratio 5:1, n = 4)). Melanoma cell lines were pre-treated with media with IFNγ 24 h prior co-culture with T cells. The plots are divided between TCRs without killing activity (a) and TCRs with intermediate killing (b). * p < 0.05 vs Neo12, two-tailed unpaired t test with Holm-Sidak adjustment for multiple comparison (n) indicates the number of biological replicates. Exact p-values provided in Supplementary Information. Mean and individual values are shown. All T-cell products contain CD8+ and CD4+ gene-edited T cells.
Extended Data Fig. 5 |. Titration of cytokine secretion by neoantigen-specific TCRs from patient 1 upon binding to specific neoantigen–HLA multimer.
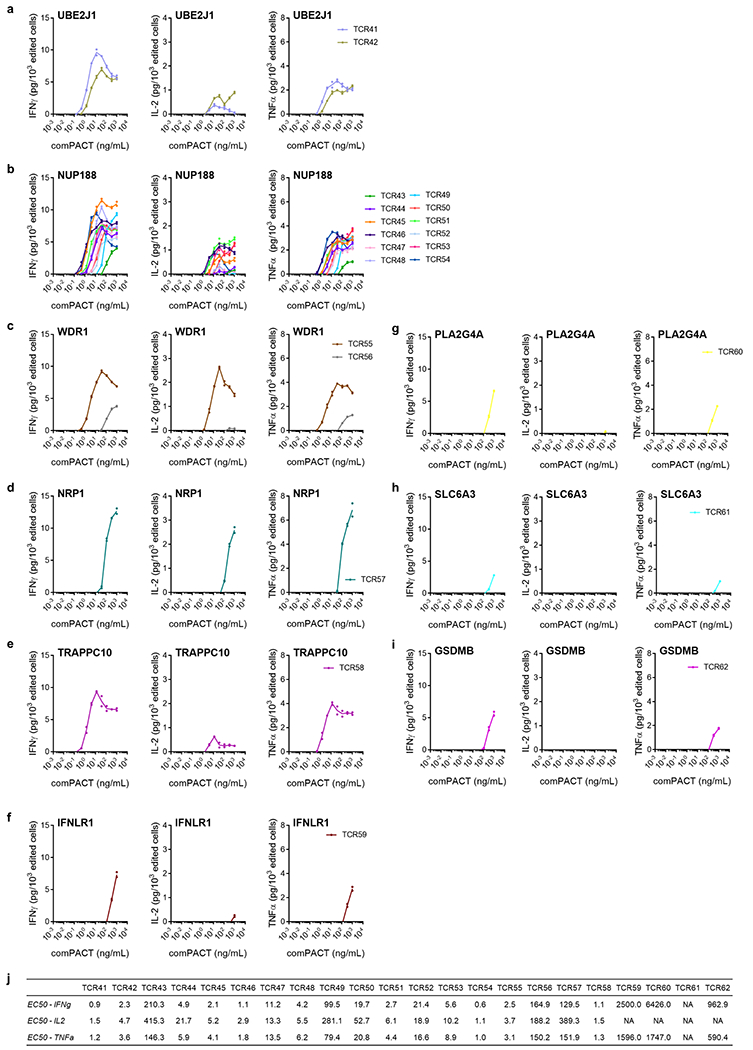
Healthy donor T cells genetically engineered to express the captured neoTCRs from patient 1 were incubated with increasing amounts of plate-bound neoantigen–HLA multimer specific for each TCR and, 24 h after incubation, the IFNγ, IL-2, and TNF secreted were measured. a, NeoTCRs targeting UBE2J1 mutation presented by HLA-A*24:02. b, NeoTCRs targeting NUP188 mutation presented by HLA-A*24:02. c, NeoTCRs targeting WDR1 mutation presented by HLA-A*03:01. d, NeoTCRs targeting NRP1 mutation presented by HLA-A*03:01. e, NeoTCRs targeting TRAPPC10 mutation presented by HLA-C*04:01. f, NeoTCRs targeting IFNLR1 mutation presented by HLA-A*03:01. g, NeoTCRs targeting PLA2G4A mutation presented by HLA-A*03:01. h, NeoTCRs targeting SLC6A3 mutation presented by HLA-A*03:01. i, NeoTCRs targeting GSDMB mutation presented by HLA-C*12:02. j, Summary EC50 calculated for each TCR and each cytokine. (n = 2), (n) indicates the number of biological replicates. Mean and individual values are shown. All T-cell products contain CD8+ and CD4+ gene-edited T cells.
Extended Data Fig. 6 |. Activation, cytotoxicity, cytokine secretion, and proliferation induced by neoantigen-specific TCRs from patient 2 upon co-culture with the autologous cell line.
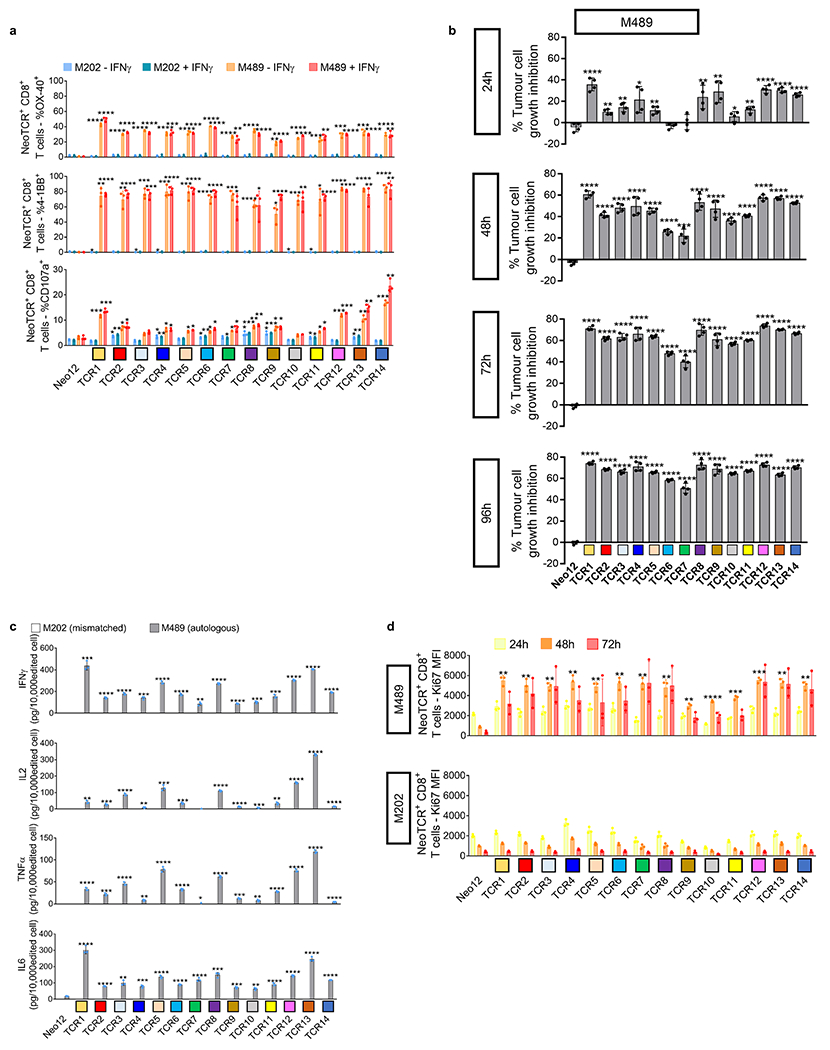
Healthy donor T cells genetically engineered to express the captured neoTCRs from patient 2 were co-cultured with the autologous (M489) or a mismatched cell line (M202). a, 4-1BB, OX-40, and CD107a upregulation in the CD8+ neoTCR+ T cells after co-culture. Melanoma cell lines were pre-treated with regular media or media with IFNγ 24 h prior co-culture with T cells (n = 3). b, percentage of tumour growth inhibition in M489 autologous cell line compared to the cell growth in media alone at 24, 48, 72 and 96 h (n = 4). c, Cytokine release at 24 h after co-culture (n = 3). d, Proliferation of CD8+ neoTCR+ T cells measured by Ki67 mean fluorescence intensity upon 24, 48 and 72 h co-culture with autologous melanoma cell line (M489, top panel) or a mismatched cell line (M202, bottom panel) (n = 3). * p < 0.05, ** p < 0.005, ***p < 0.0005, ****p < 0.0001 vs Neo12, two-tailed unpaired t test with Holm-Sidak adjustment for multiple comparisons in figure a, b and c. * p < 0.05, ** p < 0.005, ***p < 0.0005, ****p < 0.0001 vs M202, two-tailed unpaired t test with Holm-Sidak adjustment for multiple comparisons in figure d. Exact p-values provided in Supplementary Information. (n) indicates the number of biological replicates. Mean ± SD and individual values are shown. All T-cell products contain CD8+ and CD4+ gene-edited T cells.
Extended Data Fig. 7 |. Function of the CD8-independent TCRs in gene-edited CD4+ T cells.
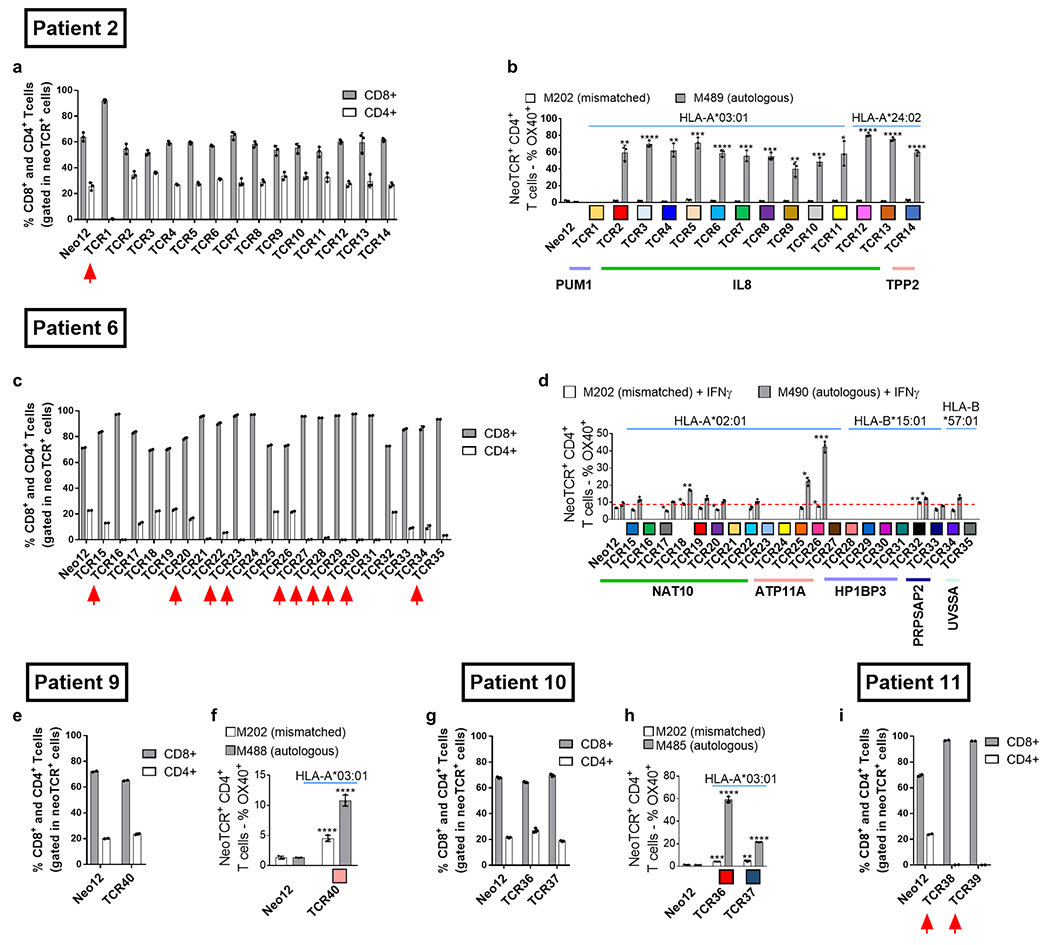
a,c,e,g,i. Percentage of CD8+ and CD4+ in the neoTCR+ T cell population. n = 2 for patients 6, 9 and 11, and n = 3 for patients 2 and 10). CD8-dependent TCRs, described as TCRs that require CD8 co-receptor engagement to bind to the MHC-peptide, are marked with a red arrow. b,d,f,h, Percentage of OX-40+ cells in the NeoTCR+CD4+ T cells. (n = 3) *p < 0.05, **p < 0.005, ***p < 0.0005,****p < 0.0001 vs Neo12, two-tailed unpaired t test with Holm-Sidak adjustment for multiple comparison in figures b, d, and h. The same test without adjustment for multiple comparisons was used in figure f. Exact p-values provided in Supplementary Information. (n) indicates the number of biological replicates. Mean ± SD are shown. All T-cell products contain CD8+ and CD4+ gene-edited T cells.
Extended Data Fig. 8 |. Activation, cytotoxicity, cytokine secretion, and proliferation induced by neoantigen-specific TCRs from patient 6 upon co-culture with the autologous cell line.
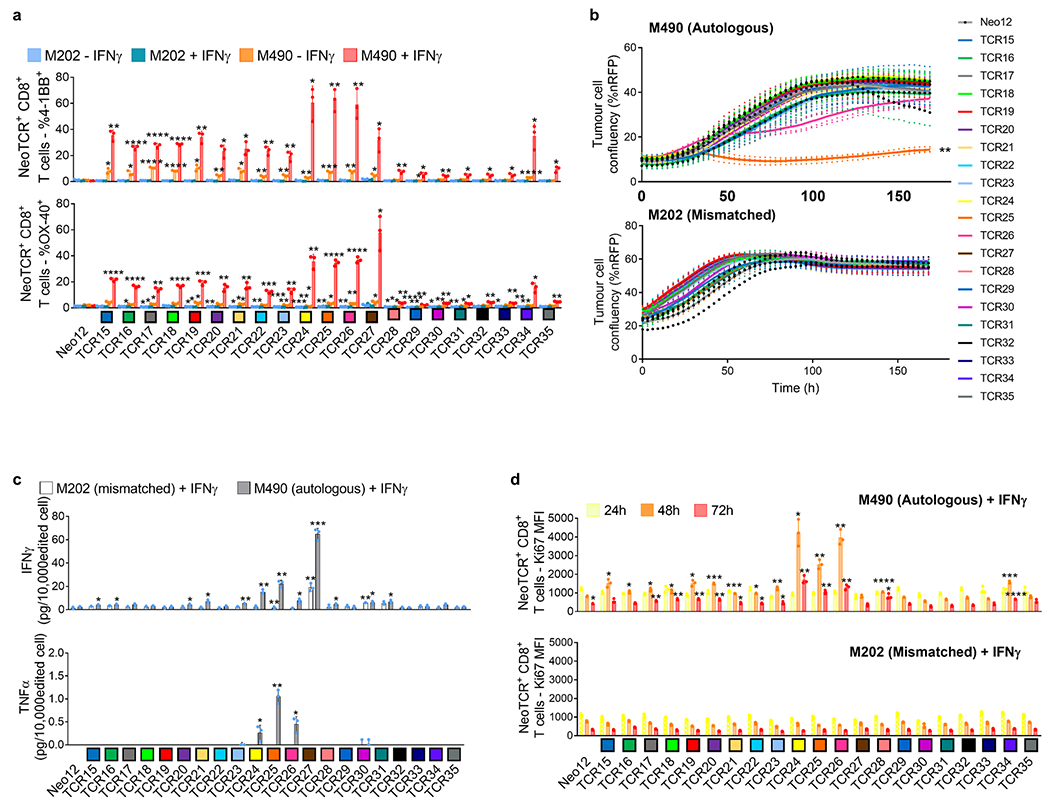
Healthy donor T cells genetically engineered to express the captured neoTCRs from patient 6 were co-cultured with the autologous (M490) or a mismatched cell line (M202). a, 4-1BB and OX-40 upregulation in the CD8+ neoTCR+ T cells after co-culture. Melanoma cell lines were pre-treated with regular media or media with IFNγ 24 h prior co-culture with T cells (n = 3). b, Specific target-cell killing in the autologous cell line (top panel) or a mismatched cell line (bottom panel), (P:T ratio 10:1, n = 4). c, Cytokine release at 24 h after co-culture (n = 3). Melanoma cell lines were pre-treated with IFNγ for 24 h before co-culture with T cells. d, Proliferation of CD8+ neoTCR+ T cells measured by Ki67 mean fluorescence intensity upon 24, 48 and 72 h co-culture with autologous melanoma cell line (M490, top panel) or a mismatched cell line (M202, bottom panel). Melanoma cell lines were pretreated with IFNγ 24 h prior co-culture with T cells (n = 3). *p < 0.05, **p < 0.005, ***p < 0.0005, ****p < 0.0001 vs Neo12, two-tailed unpaired t test with Holm-Sidak adjustment for multiple comparisons in figure a, b and c. *p < 0.05, **p < 0.005, ***p < 0.0005, ****p < 0.0001 vs M202, two-tailed unpaired t test with Holm-Sidak adjustment for multiple comparisons in figure d. (n) indicates the number of biological replicates. Exact p-values provided in Supplementary Information. Mean ± SD and individual values are shown in a, c and d. Mean and individual values are shown in b. All T-cell products contain CD8+ and CD4+ gene-edited T cells.
Extended Data Fig. 9 |. Neoantigen-specific T-cell isolation from PBMCs in patients without response to anti-PD-1 therapy.
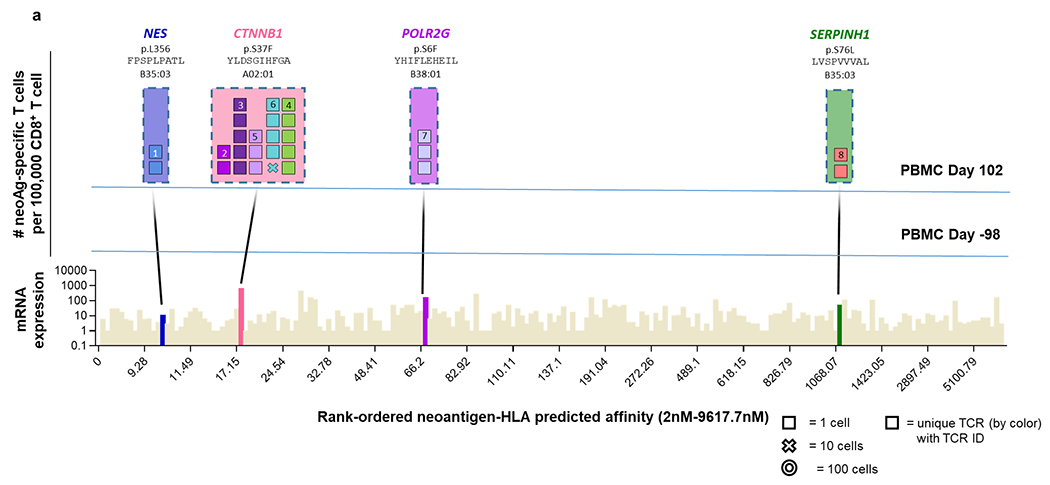
a, Landscape analysis of the neoantigen-specific T cells over time in patient 8. Bottom panel shows mRNA expression and predicted HLA binding affinity of the predicted neoantigens screened. Neoantigens targeted by T cells are highlighted in different colours. The same colour code is used in the top panels to show the neoantigen specificity of the isolated T cells. The top panels show the evolution over time of the neoantigen-specific T cells in PBMCs. Each box represents one isolated T cell, each cross is equivalent to ten isolated T cells, and each circle is equivalent to 100 isolated T cells. Each colour represents a different neoantigen-specific T-cell clonotype. The number of isolated T cells is normalized to 100,000 CD8+ T cells using a round up method to plot the data. The mutated gene name, the point mutation, the sequence of the neoantigen, and the HLA are indicated on top of the figure. The T cell clonotypes shown have not been validated by expression in healthy donor T cells and binding to neoantigen–HLA complexes.
Extended Data Fig. 10 |. Activation, cytokine secretion, and proliferation induced by neoantigen-specific TCRs from patients without response to anti-PD-1 upon co-culture with the autologous cell lines.
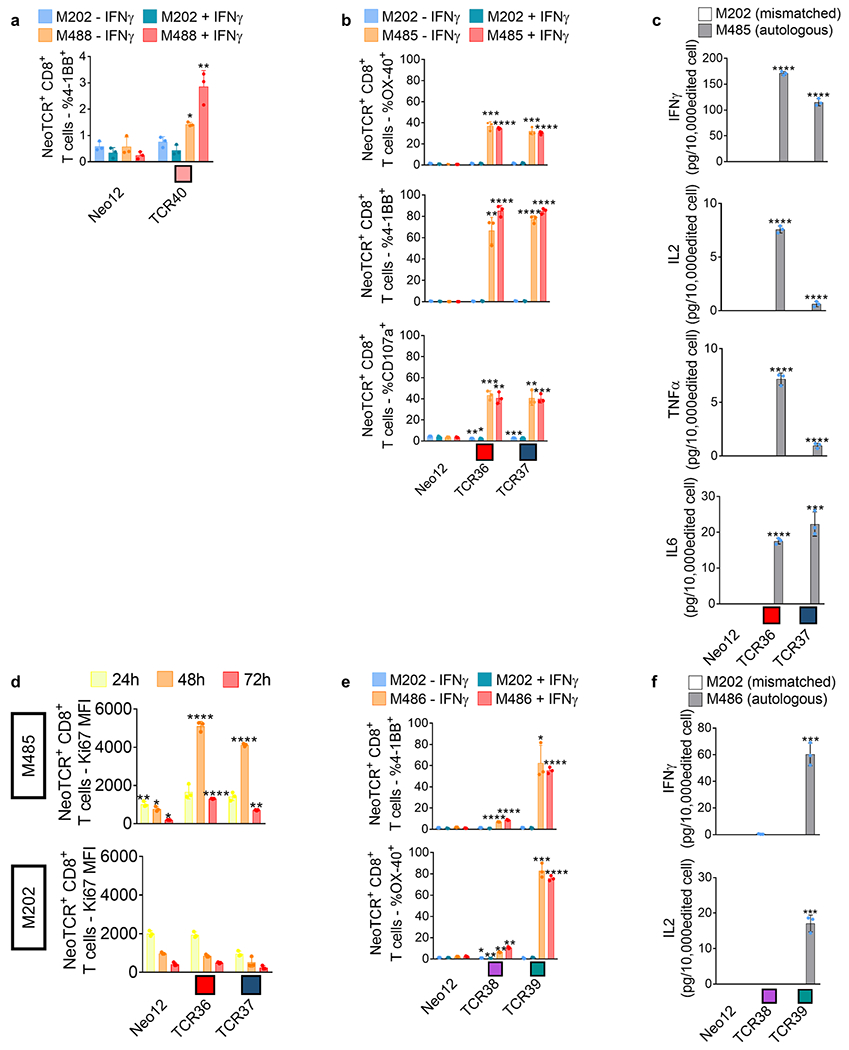
Healthy donor T cells genetically engineered to express the captured neoTCRs from patient9 (a), 10 (b-d) and 11 (e-f) were co-cultured with the autologous (M488, M485 and M486 respectively) or a mismatched cell line (M202). a, 4-1BB upregulation in the CD8+ neoTCR+ T cells from patient 9 after co-culture. Melanoma cell lines were pre-treated with regular media or media with IFNγ 24 h prior co-culture with T cells (n = 3). b, 4-1BB, OX-40, and CD107a upregulation in CD8+ neoTCR+ T cells from patient 10 after co-culture. Melanoma cell lines were pre-treated with regular media or media with IFNγ 24 h prior co-culture with T cells (n = 3). c, Cytokine release at 24 h after co-culture (n = 3). d, Proliferation of CD8+ neoTCR+ T cells from patient 10 measured by Ki67 mean fluorescence intensity upon 24, 48 and 72 h co-culture with autologous melanoma cell line (M485, top panel) or a mismatched cell line (M202, bottom panel) (n = 3). e, 4-1BB and OX-40 upregulation in CD8+ neoTCR+ T cells from patient 11 after co-culture. Melanoma cell lines were pre-treated with regular media or media with IFNγ 24 h prior co-culture with T cells (n = 3). f, Cytokine release at 24 h after co-culture (n = 3). * p < 0.05, ** p < 0.005, ***p < 0.0005, ****p < 0.0001 vs Neo12, two-tailed unpaired t test with Holm-Sidak adjustment for multiple comparisons in figure a, b, c, e, and f. * p < 0.05, ** p < 0.005, ***p < 0.0005, ****p < 0.0001 vs M202, two-tailed unpaired t test with Holm-Sidak adjustment for multiple comparisons in figure d. Exact p-values provided in Supplementary Information. (n) indicates the number of biological replicates. Mean ± SD and individual values are shown. All T-cell products contain CD8+ and CD4+ gene-edited T cells.
Extended Data Table 1 |.
Patient Characteristics
| Patient ID | Response | Gender | Race | Age | Site of origin | Stage | Sites of metastases | Treatment | Best response on therapy | Outcome |
|---|---|---|---|---|---|---|---|---|---|---|
| Patient 1 | R | Male | Caucasian | 64 | Skin (scalp) | M1a | Lymph nodes and subcutaneous tissue | Dostarlimab and cobolimab | PR | 32+ months ongoing response, alive |
| Patient 2 | R | Male | Caucasian | 79 | Skin (scalp) | M1b | Lung | Nivolumab | PR | 58+ months ongoing response, alive |
| Patient 3 | R | Male | Caucasian | 63 | Skin (torso) | M1b | Lung | Pembrolizumab | PR | 111+ months ongoing response, alive |
| Patient 4 | R | Male | Caucasian | 33 | Skin (neck) | M1c | Lung, pleura, lymph nodes, adrenal, kidney | Nivolumab | PR | 48+ months ongoing response, alive |
| Patient 5 | R | Female | Caucasian | 53 | Skin (torso) | M1b | Lung, subcutaneous tissue | Pembrolizumab | CR | 110+ months ongoing response, alive |
| Patient 6 | R | Male | Caucasian | 69 | Unknown primary | M1a | Lymph nodes | Nivolumab | PR | 51+ months ongoing response, alive |
| Patient 7 | R | Male | Caucasian | 60 | Skin (chest) | M1c | Lung, heart, liver, bone, lymph nodes | Nivolumab and NEO-PV-01 | MR | 4 months of MR, alive at 36+ months |
| Patient 8 | NR | Female | Caucasian | 63 | Skin (scalp) | M1b | Skin, lymph nodes, lung | Pembrolizumab | PD | Deceased at 13 months |
| Patient 9 | NR | Male | Caucasian | 63 | Skin (torso) | M1c | Subcutaneous tissue, adrenal | Pembrolizumab and intralesional SD101 | SD | 17 months of SD followed by progression, deceased at 27 months |
| Patient 10 | NR | Female | Caucasian | 73 | Skin (ankle) | M1c | Lymph nodes, adrenal gland, kidney, bone | Nivolumab* | PD | Deceased at 1 month |
| Patient 11 | NR | Female | Asian | 83 | Mucosal (nose) | M1c | Lung, liver | Pembrolizumab | PD | Deceased at 8 months |
Summary of the melanoma patient’s demographics, disease origin and stage, treatment, response to therapy and patient outcome.
Treatment planned, but not received due to rapid progression and death.
CR: complete response; PR: partial response; MR: mixed response; SD: stable disease; PD: progressive disease.
Supplementary Material
Acknowledgements
We thank B. Berent-Maoz and J. Pang for help in sample collections; J. M. Chen and J. Trent for administrative and logistics support; and Y. Qi, Y. Murtanu, L. Guo, M. Dhar, E. Huang and M. Wallace for their help in contributing suggestions and processing the samples. This study was funded in part by PACT Pharma, the Parker Institute for Cancer Immunotherapy (PICI) (to A.R. and to C.P.-S.), the Melanoma Research Alliance—Young Investigator Award (to C.P.-S.), NIH grants R35 CA197633 and P01 CA244118 (to A.R.), the Ressler Family Fund and contributions from K. and D. Schultz, T. and D. Jones, and T. Stutz (to A.R.). C.P.-S. is a Parker Senior Fellow supported by PICI. G.A.-R. was supported by the Isabel and Harvey Kibel Fellowship award and the Alan Ghitis Fellowship Award for Melanoma Research, and currently by a Parker Scholar award; and J.D.S. by the UCLA Tumour Immunology Training Grant (USHHS Ruth L. Kirschstein Institutional National Research Service Award T32 CA009120). Flow Cytometry was performed at the UCLA Jonsson Comprehensive Cancer Center (JCCC) Flow Cytometry Shared Resource that is supported by the National Institutes of Health award P30CA016042 and by the JCCC and the David Geffen School of Medicine at UCLA. Cell sorting was performed at the Eli and Edythe Broad Center of Regenerative Medicine and Stem Cell Research University of California, Los Angeles Flow Cytometry Core Resource. Sequencing studies were conducted at the UCLA Technology Center for Genomics & Bioinformatics.
Competing interests
B.S., S.P., C.L.W., Z.P., B.P., A.C., D.A., B.B.Q., B.Y., K.J., O.D., D.N., K.S., J.G., J. Hoover., S. Said., W.L., C.S., K.H., Y.M., S.C., M.J.P., M.T., R.T., C.M., P.P., S.N., S.P.F., T.H., M.Y., S. Sandoval., R.M., X.R.B., M.T.B., A.F. and S.J.M. are current or former employees of PACT Pharma, and hold stock in the company. S.P., M.T.B., J.R.H. and A.R. are co-founders of PACT Pharma, and hold founder stock. J.R.H. and A.R. are members of the scientific advisory board of PACT Pharma. J.R.H. and A.R. are members of the board of directors of PACT Pharma. A.R. has received honoraria from consulting with Amgen, Bristol-Myers Squibb, Chugai, Dynavax, Genentech, Merck, Nektar, Novartis, Roche and Sanofi; is or has been a member of the scientific advisory board and holds stock in Advaxis, Arcus Biosciences, Bioncotech Therapeutics, Compugen, CytomX, Five Prime, RAPT, ImaginAb, Isoplexis, Kite-Gilead, Lutris Pharma, Merus, Rgenix and Tango Therapeutics. C.P.-S. and A.R. are listed as inventors on and receive licensing revenue from a patent application covering the use of non-viral gene editing of T cells that was licensed by The Regents of the University of California to Arsenal Bio (South San Francisco; WO2019084552A1, application filed by The Regents Of The University Of California); the methods and technology described therein were not used in the experiments performed herein. A.G. reports receiving funding from Novartis, VCN Biosciences and Merck KGaA, has received speaker honoraria from Roche, and has consulted for Achilles Therapeutics, Neon Therapeutics, PACT Pharma and Oxford Immunotherapy. Patent applications have been filed on aspects of the described work by PACT Pharma, entitled ‘Peptide-MHC comPACTs’, ‘Compositions and Methods For Identification of Antigen Specific T Cells’ and ‘Primary Cell Gene Editing’. The other authors declare no competing interests.
Footnotes
Code availability
The software used to analyse the data include: WA-MEM, Sentieon (v.201911.01), VarScan2 (v.2.3.9 and v.2.4.2), MuTect (v.1.1.7 and v.3.6), HISAT2 (v.2.0.4), STAR, RSEM, StringTie (v.1.2.2), Optitype (v.1.3.1), netMHCpan (v.3.4 and v.4.1), CWL (v.1.1), Strelka (v.2.9.9), Pindel (v.0.2.4b8), pVACtools (v.1.1.4; supported by NetMHCpan (v.4.0), NetMHC (v.4.0), NetMHCcons (v.1.1), PickPocket (v.1.1), SMM (v.1.0), SMMPMBEC (v.1.0), MHCflurry (v.1.2.2) and MHCnuggets (v.2.2)), Kallisto and MiXCR (v.2.1.3).
Supplementary information The online version contains supplementary material available at https://doi.org/10.1038/s41586-023-05787-1.
Data availability
Raw sequencing data derived from cell line and normal PBMC control samples collected under UCLA Institutional Review Board approvals 11-003254 have been deposited to dbGAP under accession number phs003153.v1.p1.
References
- 1.Schumacher TN & Schreiber RD Neoantigens in cancer immunotherapy. Science 348, 69–74 (2015). [DOI] [PubMed] [Google Scholar]
- 2.Tran E, Robbins PF & Rosenberg SA Final common pathway’ of human cancer immunotherapy: targeting random somatic mutations. Nat. Immunol 18, 255–262 (2017). [DOI] [PMC free article] [PubMed] [Google Scholar]
- 3.Gros A. et al. Prospective identification of neoantigen-specific lymphocytes in the peripheral blood of melanoma patients. Nat. Med 22, 433–438 (2016). [DOI] [PMC free article] [PubMed] [Google Scholar]
- 4.Gubin MM et al. Checkpoint blockade cancer immunotherapy targets tumour-specific mutant antigens. Nature 515, 577–581 (2014). [DOI] [PMC free article] [PubMed] [Google Scholar]
- 5.Linnemann C. et al. High-throughput epitope discovery reveals frequent recognition of neo-antigens by CD4+ T cells in human melanoma. Nat. Med 21, 81–85 (2015). [DOI] [PubMed] [Google Scholar]
- 6.Robbins PF et al. Mining exomic sequencing data to identify mutated antigens recognized by adoptively transferred tumor-reactive T cells. Nat. Med 19, 747–752 (2013). [DOI] [PMC free article] [PubMed] [Google Scholar]
- 7.Tran E. et al. Cancer immunotherapy based on mutation-specific CD4+ T cells in a patient with epithelial cancer. Science 344, 641–645 (2014). [DOI] [PMC free article] [PubMed] [Google Scholar]
- 8.McGranahan N. et al. Clonal neoantigens elicit T cell immunoreactivity and sensitivity to immune checkpoint blockade. Science 351, 1463–1469 (2016). [DOI] [PMC free article] [PubMed] [Google Scholar]
- 9.Verdegaal EM et al. Neoantigen landscape dynamics during human melanoma-T cell interactions. Nature 536, 91–95 (2016). [DOI] [PubMed] [Google Scholar]
- 10.Andersen RS et al. Parallel detection of antigen-specific T cell responses by combinatorial encoding of MHC multimers. Nat. Protoc 7, 891–902 (2012). [DOI] [PubMed] [Google Scholar]
- 11.Fehlings M. et al. Late-differentiated effector neoantigen-specific CD8+ T cells are enriched in peripheral blood of non-small cell lung carcinoma patients responding to atezolizumab treatment. J. Immunother. Cancer 7, 249 (2019). [DOI] [PMC free article] [PubMed] [Google Scholar]
- 12.Caushi JX et al. Transcriptional programs of neoantigen-specific TIL in anti-PD-1-treated lung cancers. Nature 596, 126–132 (2021). [DOI] [PMC free article] [PubMed] [Google Scholar]
- 13.Oliveira G. et al. Phenotype, specificity and avidity of antitumour CD8+ T cells in melanoma. Nature 596, 119–125 (2021). [DOI] [PMC free article] [PubMed] [Google Scholar]
- 14.Parkhurst MR et al. Unique neoantigens arise from somatic mutations in patients with gastrointestinal cancers. Cancer Discov. 9, 1022–1035 (2019). [DOI] [PMC free article] [PubMed] [Google Scholar]
- 15.Foy SP et al. Non-viral precision T cell receptor replacement for personalized cell therapy. Nature 10.1038/s41586-022-05531-1 (2022). [DOI] [PMC free article] [PubMed] [Google Scholar]
- 16.Chour W. et al. Shared antigen-specific CD8+ T cell responses against the SARS-COV-2 spike protein in HLAA*02:01 COVID-19 Participants. Preprint at 10.1101/2020.05.04.20085779 (2020). [DOI] [Google Scholar]
- 17.Peng S. et al. Sensitive detection and analysis of neoantigen-specific T cell populations from tumors and blood. Cell Rep. 28, 2728–2738 (2019). [DOI] [PMC free article] [PubMed] [Google Scholar]
- 18.Roth TL et al. Reprogramming human T cell function and specificity with non-viral genome targeting. Nature 559, 405–409 (2018). [DOI] [PMC free article] [PubMed] [Google Scholar]
- 19.Oh SA et al. High-efficiency nonviral CRISPR/Cas9-mediated gene editing of human T cells using plasmid donor DNA. J. Exp. Med 219, e20211530 (2022). [DOI] [PMC free article] [PubMed] [Google Scholar]
- 20.Richters MM et al. Best practices for bioinformatic characterization of neoantigens for clinical utility. Genome Med. 11, 56 (2019). [DOI] [PMC free article] [PubMed] [Google Scholar]
- 21.Hundal J. et al. pVACtools: a computational toolkit to identify and visualize cancer neoantigens. Cancer Immunol. Res 8, 409–420 (2020). [DOI] [PMC free article] [PubMed] [Google Scholar]
- 22.Gee MH et al. Antigen identification for orphan T cell receptors expressed on tumor-infiltrating lymphocytes. Cell 172, 549–563 (2018). [DOI] [PMC free article] [PubMed] [Google Scholar]
- 23.Yu YY, Netuschil N, Lybarger L, Connolly JM & Hansen TH Cutting edge: single-chain trimers of MHC class I molecules form stable structures that potently stimulate antigen-specific T cells and B cells. J. Immunol 168, 3145–3149 (2002). [DOI] [PubMed] [Google Scholar]
- 24.Krishna S. et al. Stem-like CD8 T cells mediate response of adoptive cell immunotherapy against human cancer. Science 370, 1328–1334 (2020). [DOI] [PMC free article] [PubMed] [Google Scholar]
- 25.Duhen T. et al. Co-expression of CD39 and CD103 identifies tumor-reactive CD8 T cells in human solid tumors. Nat. Commun 9, 2724 (2018). [DOI] [PMC free article] [PubMed] [Google Scholar]
- 26.Simoni Y. et al. Bystander CD8+ T cells are abundant and phenotypically distinct in human tumour infiltrates. Nature 557, 575–579 (2018). [DOI] [PubMed] [Google Scholar]
- 27.Ribas A. et al. SD-101 in combination with pembrolizumab in advanced melanoma: results of a phase Ib, multicenter study. Cancer Discov. 8, 1250–1257 (2018). [DOI] [PMC free article] [PubMed] [Google Scholar]
- 28.Hugo W. et al. Genomic and transcriptomic features of response to anti-PD-1 therapy in metastatic melanoma. Cell 168, 542 (2017). [DOI] [PubMed] [Google Scholar]
- 29.Le DT et al. PD-1 blockade in tumors with mismatch-repair deficiency. New Eng. J. Med 372, 2509–2520 (2015). [DOI] [PMC free article] [PubMed] [Google Scholar]
- 30.Rizvi NA et al. Cancer immunology. Mutational landscape determines sensitivity to PD-1 blockade in non-small cell lung cancer. Science 348, 124–128 (2015). [DOI] [PMC free article] [PubMed] [Google Scholar]
- 31.Boon T, Coulie PG, Van den Eynde BJ & van der Bruggen P Human T cell responses against melanoma. Annu. Rev. Immunol 24, 175–208 (2006). [DOI] [PubMed] [Google Scholar]
- 32.Yewdell JW Confronting complexity: real-world immunodominance in antiviral CD8+ T cell responses. Immunity 25, 533–543 (2006). [DOI] [PubMed] [Google Scholar]
- 33.Lang F, Schrörs B, Löwer M, Türeci Ö & Sahin U Identification of neoantigens for individualized therapeutic cancer vaccines. Nat. Rev. Drug Discov 21, 261–282 (2022). [DOI] [PMC free article] [PubMed] [Google Scholar]
- 34.Lowery FJ et al. Molecular signatures of antitumor neoantigen-reactive T cells from metastatic human cancers. Science 375, 877–884 (2022). [DOI] [PMC free article] [PubMed] [Google Scholar]
- 35.Prickett TD et al. Durable complete response from metastatic melanoma after transfer of autologous T cells recognizing 10 mutated tumor antigens. Cancer Immunol. Res 4, 669–678 (2016). [DOI] [PMC free article] [PubMed] [Google Scholar]
- 36.Scheper W. et al. Low and variable tumor reactivity of the intratumoral TCR repertoire in human cancers. Nat. Med 25, 89–94 (2019). [DOI] [PubMed] [Google Scholar]
- 37.Wu TD et al. Peripheral T cell expansion predicts tumour infiltration and clinical response. Nature 579, 274–278 (2020). [DOI] [PubMed] [Google Scholar]
- 38.Voabil P. et al. An ex vivo tumor fragment platform to dissect response to PD-1 blockade in cancer. Nat. Med 27, 1250–1261 (2021). [DOI] [PubMed] [Google Scholar]
- 39.Yost KE et al. Clonal replacement of tumor-specific T cells following PD-1 blockade. Nat. Med 25, 1251–1259 (2019). [DOI] [PMC free article] [PubMed] [Google Scholar]
- 40.Gros A. et al. Recognition of human gastrointestinal cancer neoantigens by circulating PD-1+ lymphocytes. J. Clin. Invest 129, 4992–5004 (2019). [DOI] [PMC free article] [PubMed] [Google Scholar]
- 41.Wolchok JD et al. Guidelines for the evaluation of immune therapy activity in solid tumors: immune-related response criteria. Clin. Cancer Res 15, 7412–7420 (2009). [DOI] [PubMed] [Google Scholar]
- 42.Dudley ME, Wunderlich JR, Shelton TE, Even J & Rosenberg SA Generation of tumor-infiltrating lymphocyte cultures for use in adoptive transfer therapy for melanoma patients. J. Immunother 26, 332–342 (2003). [DOI] [PMC free article] [PubMed] [Google Scholar]
- 43.Li H. Aligning sequence reads, clone sequences and assembly contigs with BWA-MEM. Preprint at https://arxiv.org/abs/1303.3997 (2013).
- 44.Cibulskis K. et al. Sensitive detection of somatic point mutations in impure and heterogeneous cancer samples. Nat. Biotechnol 31, 213–219 (2013). [DOI] [PMC free article] [PubMed] [Google Scholar]
- 45.Koboldt DC et al. VarScan 2: somatic mutation and copy number alteration discovery in cancer by exome sequencing. Genome Res. 22, 568–576 (2012). [DOI] [PMC free article] [PubMed] [Google Scholar]
- 46.Lai Z. et al. VarDict: a novel and versatile variant caller for next-generation sequencing in cancer research. Nucleic Acids Res. 44, e108 (2016). [DOI] [PMC free article] [PubMed] [Google Scholar]
- 47.Szolek A. et al. OptiType: precision HLA typing from next-generation sequencing data. Bioinformatics 30, 3310–3316 (2014). [DOI] [PMC free article] [PubMed] [Google Scholar]
- 48.Reynisson B, Alvarez B, Paul S, Peters B & Nielsen M NetMHCpan-4.1 and NetMHCIIpan-4.0: improved predictions of MHC antigen presentation by concurrent motif deconvolution and integration of MS MHC eluted ligand data. Nucleic Acids Res. 48, W449–W454 (2020). [DOI] [PMC free article] [PubMed] [Google Scholar]
- 49.Lybarger L. et al. Enhanced immune presentation of a single-chain major histocompatibility complex class I molecule engineered to optimize linkage of a C-terminally extended peptide. J. Biol. Chem 278, 27105–27111 (2003). [DOI] [PubMed] [Google Scholar]
- 50.Bethune MT et al. Peptide-MHC comPACTs. PACT Pharma. WO/2019/195310, PCT/US2019/025415 (2019). [Google Scholar]
- 51.Peng S. et al. Compositions and methods for identification of antigen specific T cells. PACT Pharma. WO2020167918A1, PCT/US2020/17887 (2020). [Google Scholar]
- 52.Lefranc MP et al. IMGT®, the international ImMunoGeneTics information system® 25 years on. Nucleic Acids Res. 43, D413–D422 (2015). [DOI] [PMC free article] [PubMed] [Google Scholar]
- 53.Bolotin DA et al. MiXCR: software for comprehensive adaptive immunity profiling. Nat. Methods 12, 380–381 (2015). [DOI] [PubMed] [Google Scholar]
- 54.Bethune MT, Comin-Anduix B, Hwang Fu YH, Ribas A & Baltimore D Preparation of peptide-MHC and T-cell receptor dextramers by biotinylated dextran doping. Biotechniques 62, 123–130 (2017). [DOI] [PubMed] [Google Scholar]
Associated Data
This section collects any data citations, data availability statements, or supplementary materials included in this article.
Supplementary Materials
Data Availability Statement
Raw sequencing data derived from cell line and normal PBMC control samples collected under UCLA Institutional Review Board approvals 11-003254 have been deposited to dbGAP under accession number phs003153.v1.p1.


