

Summary
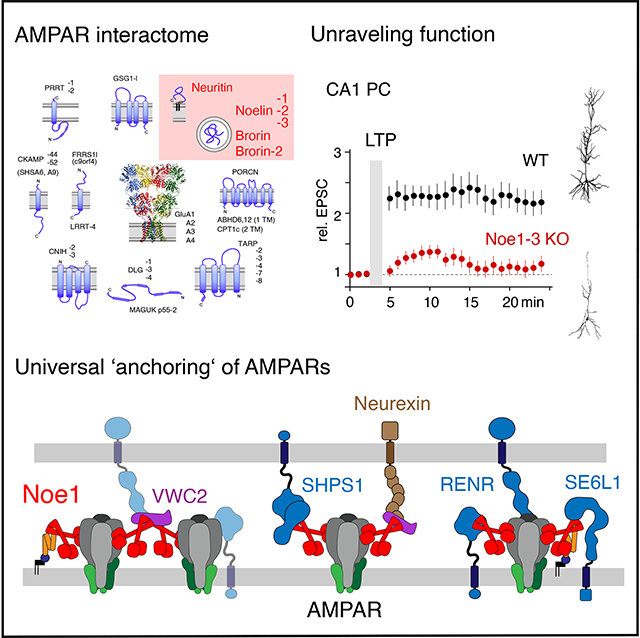
Information processing and storage in the brain rely on AMPA-receptors (AMPARs) and their context-dependent dynamics in synapses and extra-synaptic sites. We found that distribution and dynamics of AMPARs in the plasma membrane are controlled by Noelins, a three-member family of conserved secreted proteins expressed throughout the brain in a cell type-specific manner. Noelin tetramers tightly assemble with the extracellular domains of AMPARs and interconnect them in a network-like configuration with a variety of secreted and membrane-anchored proteins including Neurexin1, Neuritin1, and Seizure 6-like. Knockout of Noelins1-3 profoundly reduced AMPARs in synapses onto excitatory and inhibitory (inter)neurons, decreased their density and clustering in dendrites and abolished activity-dependent synaptic plasticity. Our results uncover an endogenous mechanism for extracellular anchoring of AMPARs and establish Noelin-organized networks as versatile determinants of constitutive and context-dependent neurotransmission.
ETOC Paragraph
Processing and storage of information in the mammalian brain critically rely on AMPA-receptors (AMPARs) and their context-dependent dynamics. Boudkkazi et al. show that distribution and dynamics of AMPARs in the surface membrane are controlled by Noelins, highly conserved secreted proteins that are abundantly expressed throughout the brain in a cell type-specific manner.
Graphical Abstract
Introduction
Fast excitatory neurotransmission and its context-dependent dynamics that are fundamental for processing, propagation and storage of information in the brain are mediated by AMPA-type glutamate receptors (AMPARs) 1–4. These ligand-gated ion channels, built from four pore-forming subunits and auxiliary proteins 5–11, conduct the depolarizing excitatory postsynaptic currents (EPSCs) for point-to-point transmission and adjust their number to the degree of synaptic activity thereby endowing synapses with the plasticity required for memory formation 12,13.
For either task, AMPARs, after proper assembly in the ER 14,15, must be inserted into the surface membrane, precisely localized into synaptic and extra-synaptic sites and finally be maintained/stabilized by distinct anchoring mechanisms on both sides of the membrane. Best characterized is anchoring on the cytoplasmic side, where AMPARs may bind to various constituents of the postsynaptic density (PSD) via PDZ-interactions of their auxiliary TARP subunits 16–19. This interaction appears dynamic and effectively regulated by phosphorylation/dephosphorylation processes 20,21. In addition, anchoring on the extracellular side has been reported to occur via interaction with neuronal pentraxins (NPTX, 19,22–24) that were found to bind with strong preference to GluA4-containing AMPARs and, thus, to impact number and integration of the receptors into the post-synapse of a subset of interneurons in the forebrain 23,24. In line with these observations, a synthetic protein combining structural elements of NPTX and cerebellin-1, an interactor of pre-synaptic neurexin proteins, was found to transiently stabilize AMPARs at excitatory synapses after their stereotactic delivery to the external milieu 25. Despite these findings, however, the molecular nature of the ‘universal’ (i.e. brain-wide active) extra-cellular anchor that controls positioning and stabilization of AMPARs independent of their GluA-composition and is expected to be fundamental for constitutive and activity-dependent excitatory synaptic transmission 19,26 has so far remained unresolved.
Here, we used high-resolution proteomics together with functional and morphological analyses to identify the highly conserved Noelin-family of secreted proteins as the missing puzzle piece. The Noelin proteins are abundantly expressed in all brain regions and, as homo- and heterotetramers, bind to the extracellular portion of all GluA proteins, albeit with some distinction for GluA4 versus GluAs1-3. Via interaction of these tetramers with a network of proteins the Noelins anchor AMPAR complexes at the ipsi- and contra-lateral membranes and thus determine their number/density under steady-state and activity-driven conditions.
Results
Noelins are selective extracellular interactors of AMPARs
The AMPAR interactome, the ensemble of protein building blocks determined in affinity-purifications (APs) of native receptors from brain membrane fractions with antibodies (ABs) against the pore-forming GluA1-4 subunits 7, encompasses several constituents with supposed extracellular localization. Most prominently among those are Noelins 1-3 (Noe1-3, also known as Olfactomedins or Pancortins), a family of highly conserved secreted proteins 27, and Neuritin (Nrn1, originally termed cpg15), a GPI-anchored protein reportedly involved in synaptogenesis and plasticity 28–30. Both, Noe1-3 and Nrn1, were effectively co-purified with the AMPAR complexes in all brain regions (even under high stringency conditions) and correlated well with each other 7,31. Noteworthy, Nrn1 and Noelins may directly interact as evidenced by robust co-purification of Noe1-3 in APs of tagged Nrn1 (Figure S1A).
We first probed the suggested localization of Noelins and Nrn1 with a PI-PLC assay where the extracellular domains of GPI-anchored proteins and proteins attached to them are enzymatically released from cells/neurons in rat brain slices (Figure 1A, inset). Quantitative MS-analysis of the respective supernatants showed that Noelin 1 (Noe1) and Nrn1 are among the 60 most abundant proteins (Figure 1A) released from the plasma membrane(s) thus confirming Noe1 as a secreted protein present in the extracellular milieu of the brain. Moreover, analytical ultra-centrifugation of Noe1 expressed in mammalian cells showed that this protein is made up as a tetramer of substantially glycosylated monomers, in line with previous reports (Figure 1B, 32). Next, we went to investigate the interaction partners of Noe1 using our established approach of multi-epitope affinity-purifications (meAP-MS; 7,15,33,34 with two distinct anti-Noe1 antibodies (ABs) and target-knockouts, as well as preimmunization IgGs as negative controls. Quantitative evaluation of these APs with target-normalized ratios (tnRs, Methods) and subsequent visualization by t-SNE (t-distributed stochastic neighbor embedding) indicated that the prime binding/interaction partners of Noe1 are Noelins 2, 3, Nrn1 and AMPARs (Figure 1C). Importantly, the latter were retrieved in their mature surface form as heteromers assembled from GluA1-4 and members of the TARP 35,36 and cornichon (CNIH) family of proteins 7, and retrieval appeared to be based on direct GluA-Noe1 interactions as inferred from the highly effective co-purification in one-to-one co-expressions (of GluA proteins with Noe1) and the selective abolishment of interaction upon deletion of the GluA4 NTD (Figure S1c). In addition, the t-SNE plot provided two further remarkable observations: First, the preferred interaction partner of Noe1 is GluA4 as indicated by the close co-localization of both proteins in the t-SNE plot (Figure 1C). Second, the anti-Noe1 APs robustly retrieved Brorin, another secreted constituent of the AMPAR interactome (Figure 1C, purple square). Noteworthy, (i) all aforementioned interactors were quantitatively co-purified (Figure S1C) and (ii) no other voltage- or ligand-gated ion channel was retrieved despite the extended dynamic range of the meAP-MS approach of at least three orders of magnitude.
Figure 1. Secreted Noelins interact with native AMPARs and Neuritin in the extracellular milieu.

(A) The 60 most abundant proteins contained in the supernatant of rat brain slice preparations after incubation with (grey bars) or without (black bars) the PI-PLC enzyme releasing GPI-anchored proteins and their extracellular interactors (inset) sorted by their absolute abundance as determined by mass spectrometry (Material and Methods). The GPI-anchored Neuritin1 (Nrn1) and Noelin1 (Noe1) were highlighted, and some established GPI-anchored proteins were indicated for comparison. (B) Sedimentation velocity analytical ultra-centrifugation (AUC) experiment indicating a mass of 297 Da for Noe1 secreted from HEK293-cells (sedimentation coefficient 6.5, frictional ratio of 1.89). This mass is in line with a tetramer of glycosylated monomers. Inset: Domain structure of Noe1, olfmD is olfactomedin domain, NtD is N-terminal domain, ccD is coil-coil domain (adapted from 32). (C) t-SNE plot of tnR-values determined for all proteins identified in meAPs with two distinct anti-Noe1 ABs using target-knockout and preimmunization IgGs as negative controls (grey dots; see Material and Methods). Inset on the right is extension of the framed area highlighting Noe1 and the set of closest interaction partners comprising AMPAR constituents, Noe2, Noe3 and Nrn1. (D) MS-derived protein abundances determined for the indicated constituents of the AMPAR interactome 7 from WT and Noe1-3 triple KO mice. Note that deletion of Noe1-3 led to a loss of Nrn1 and Brorin. (E) Abundance ratios measured for the AMPAR pore-forming GluA1-4 proteins and a selected set of membrane/synaptic proteins in unsolubilized membrane fractions (i.e. without addition of detergents) from three TKO and WT mice (AT1A/B1 is α1/β1 subunit of the Na/K-ATPase, PMCA2 is plasma membrane Ca2+-ATPase 2, GluN1 is NR1 subunit of NMDA-receptors). Data are mean (± SEM) determined by three independent MS-measurements (technical replicates); asterisks denote p-values < 0.01 (Students’ T-test). (F) Scheme illustrating the hypothetical interaction between secreted Noe1, Brorin and GPI-anchored Nrn1 derived from experiments in (A)-(D) and literature.
These findings from anti-Noe1 AP-MS were complemented by comparative analysis of the AMPAR interactomes determined from WT mice and mice where Noe1-3 were removed by targeted gene deletion (triple knockout, TKO, for details on these animals and their survival rate (2.8%) see Methods, Figure S2). Thus, the AMPAR assemblies affinity-isolated with anti-GluA1-4 ABs from TKO brains not only lacked Noe1-3, but, in addition, were entirely deprived of both Nrn1 and Brorin (Figure 1D). Otherwise, the AMPAR assemblies appeared largely unaltered, both at the plasma membrane (judged from the surface constituents CNIHs, TARPs, GSG1l, Shisa-9 or PRRT1) and in the ER; although association of the GluA proteins with the FRRS1l-CPT1c complex, the critical determinant of receptor biogenesis 15, was slightly increased and some TARPs, as well as Shisa9 and GSG1l appeared slightly decreased (Figure S3). Interestingly though, the overall amount of the four GluA proteins determined in unsolubilized membrane fractions from whole brain was significantly reduced by about 12% in TKO mice compared to WT, similar to other abundant membrane or postsynaptic density proteins (Figure 1E).
Together, these results confirmed Noelins as secreted proteins in the mammalian brain which, as homo- and hetero-tetramers, interact with AMPARs on the extracellular side and which recruit the GPI-anchored Nrn1 and the secreted Brorin to the receptor complexes (Figure 1F). Moreover, Noelins impacted the steady-state levels of AMPARs thus raising questions on the molecular mode of their operation and on cellular origin of these extracellular AMPAR constituents.
Noelins1-3 determine distribution and number of AMPARs in synapses and dendrites
We next addressed these questions in the hippocampal formation and initially investigated the cellular expression pattern(s) of the extracellular AMPAR interactors at cellular resolution using RNAscope (Methods, Figure S4) and single cell transcriptomics through a publicly open database (DropViz, 37). Both (independent) approaches were highly consistent in their results and detected markedly distinct patterns for both abundance and cell-type specificity of the respective transcripts (Figure 2A, Figures S4, S5). While mRNA coding for Noe1, the most abundantly detected transcript, was present in all types of excitatory and inhibitory neurons (pyramidal cells in CA1/CA3, granule cells and mossy cells in the dentate gyrus (DG)) and, to a small extent, even in glial cells (Figures S4, S5), transcripts for Noe2, Noe3 and Brorin appeared low in abundance and were preferentially found in interneurons (Figure 2A, Gad1-high in Figure S4). In contrast, Nrn1 transcripts were robustly detected in all types of neurons similar to those of Noe1 (Figure S5), but displayed significant preference for expression in excitatory neurons in the CA1, CA3 fields and in the DG (Figure 2A, Figure S4). These transcriptome data were complemented by AB-stainings, showing that Nrn1 strictly localized to dendrites and the postsynaptic membrane very similar to DLG/PSD95, while Noe1 was predominantly observed in the extracellular space along dendrites and at synaptic sites where parts of its staining overlapped with that of Nrn1 (Figure S6).
Figure 2. Noelins determine distribution and density of AMPARs in synapses and dendrites and impact neuronal morphology.
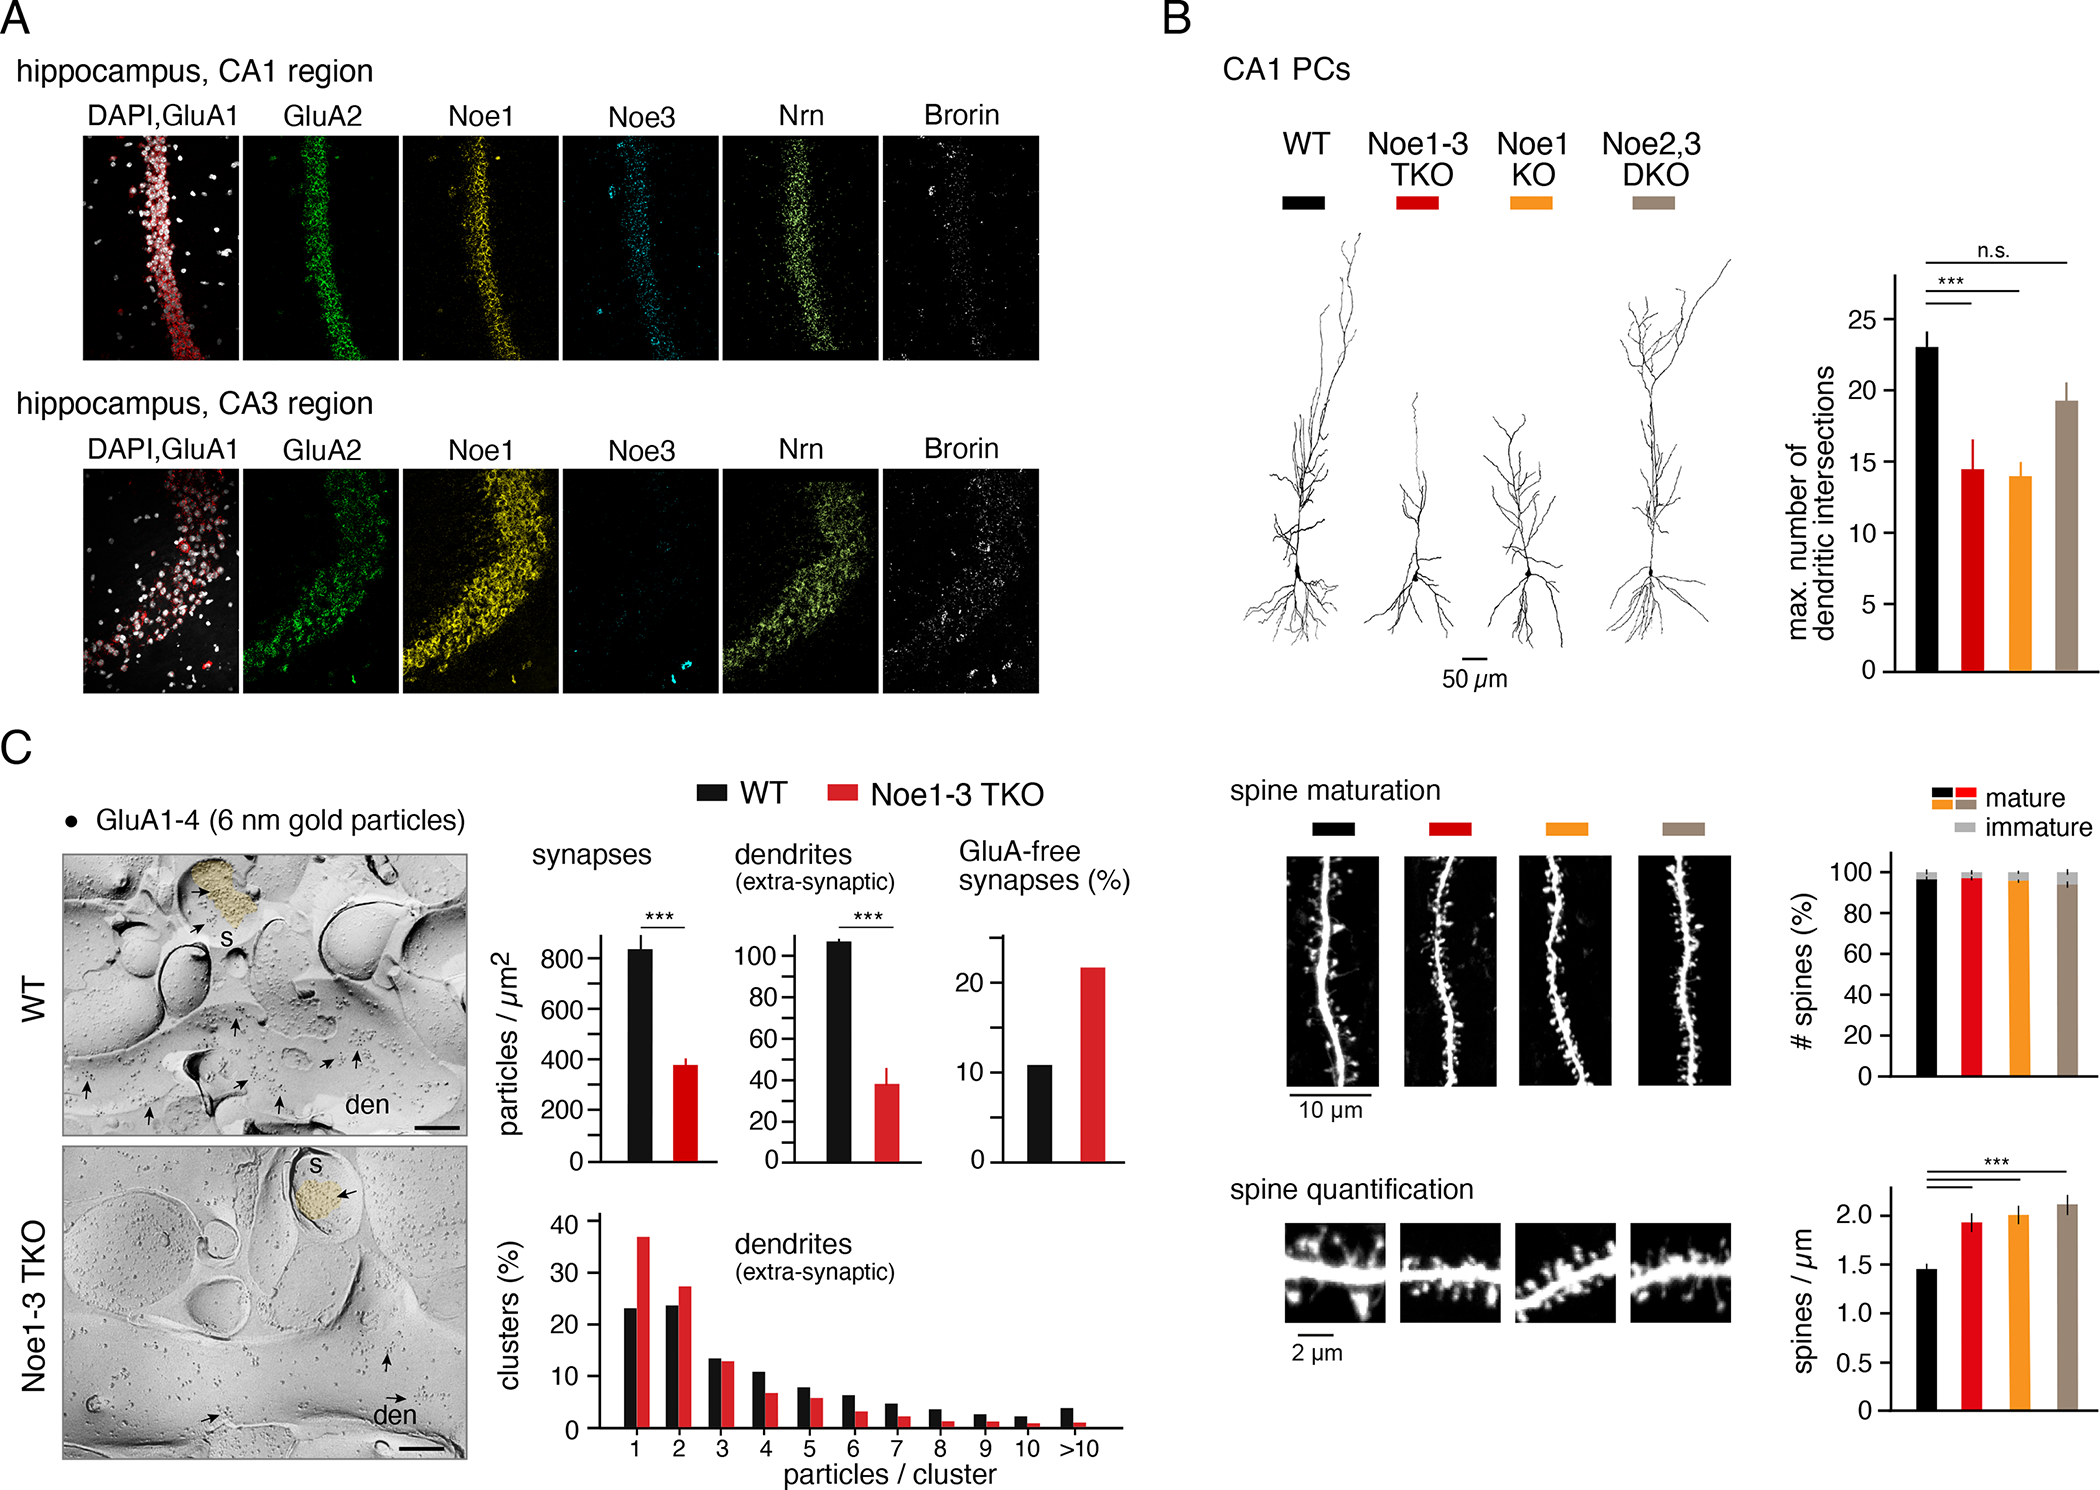
(A) Fluorescence images of RNAScope in situ-hybridizations with probes specific for the indicated proteins in hippocampal CA1 (upper panel) and CA3 (lower panel) regions. Note the distinct abundance and patterns of expression (see also Figures S4, S5). DAPI staining of nuclei (images on the left) is in white. (B) Upper left panel, representative CA1 PCs reconstructed after biocytin-filling through the whole-cell patch-pipette (experiments in Figure 3A) from (adult) WT and the indicated Noelin KO mice. Upper right panel, bars summarizing numbers of dendritic intersections determined by Sholl-analysis (mean ± SD of 12, 7, 7, 4 cells for WT, TKO, Noe1 KO and Noe2,3 DKO, respectively; p-values of student’s T-test < 0.001 (three asterisks for all bar-denoted pairs below) or > 0.05 (not significant, n.s.). Middle and lower panels, left: Confocal images of representative dendritic sections, right: Bar graphs summarizing ratio of mature versus immature spines (middle) and number of spines determined in dendritic sections of WT and the indicated Noelin KO neurons. Data are mean ± SD of 11 sections (8 neurons) for WT, and 14 (7), 15 (9), 6 (3) sections for TKO, Noe1 KO and Noe2,3 DKO, respectively; p-values of student’s T-test < 0.001 (three asterisks for all bar-denoted pairs below). Scale bars are indicated. (C) Left panel, electron micrographs illustrating distribution of immuno-particles for GluA1-4 (6 nm; some highlighted by arrowheads) on the plasma membrane of dendritic shafts (den) and spines (s) of CA1 PCs in hippocampi of WT and TKO mice. Scale bars are 200 nm. Right panel, bar graphs summarizing surface densities of AMPARs in GluA-positive synapses and dendrites (mean ± SD of 45 and 74 synapses (WT, TKO) and of 35 and 48 dendrites; p-values < 0.001 for both sites, Student’s T-test), clusters of GluA1-4 particles determined on dendritic shafts and relative contribution of GluA-free synapses to the total pool of synapses. Note the decrease in AMPAR density and the increase in silent synapses induced by the TKO.
Next, we explored the significance of Noe1-3 for the cell physiology of AMPARs by investigating morphology, receptor distribution and synaptic signal transduction of, and in, neurons lacking individual or all Noelin proteins through single or combined gene knockout. Overall morphology was assessed by three-dimensional reconstructions of hippocampal CA1 pyramidal cells (CA1 PC) of adult mice (> postnatal day 35) filled with biocytin through a patch-pipette. Evaluation by Sholl analyses indicated that the complexity of dendritic arborization determined by the number of (dendritic) intersections was decreased by ~40% following knockout of either Noe1-3 (TKO) or Noe1 alone (Figure 2B, Figure S7; for details on Noe1 KO animals and their survival rate (8.5%) see Methods). In contrast, the combined knock-out of Noe2,3 (DKO) led to only minor alterations in the overall morphology of CA1 PCs (Figure 2B, upper panel, Figure S7), seemingly correlating the observed knock-out effects with the transcript abundances determined for the individual Noelin isoforms in the hippocampus (Figure 2A, Figures S4, S5). Distribution of AMPARs was analyzed in freeze-fracture replicas from the CA1 region using electron-microscopy combined with immunogold-labelling by an anti-GluA1-4 AB (see Methods, 15,38). Quantification of the gold-particles showed that in TKO neurons the number of labeled AMPARs in the surface membrane was largely reduced both in synapses, as well as in extra-synaptic sites of dendrites (Figure 2C). In addition, removal of Noelins1-3 altered the clustered appearance of the receptors on the dendritic membrane where the overall number of clusters was reduced and small clusters with ≤ 3 receptors were strongly preferred in TKO cells compared to WT neurons. In contrast, larger clusters (4–10 and ≥10 labelled receptors/cluster), the preferred appearance in WT neurons, were scarce in TKO cells (Figure 2C, lower right). In addition, ablation of Noe1-3 led to a two-fold increase in AMPAR-free (silent) synapses (Figure 2C), and induced an increase in spine numbers without changing the ratio of mature-to-immature synapses (Figure 2B, middle, lower panel).
Finally, AMPAR-mediated synaptic signal transduction was analyzed by recording spontaneous and miniature EPSCs (sEPSC, mEPSC) in whole-cell mode in various types of hippocampal neurons. In all TKO neurons, the sEPSCs were markedly reduced compared to their WT counterparts, albeit to distinct levels: While in hilar interneurons (IN) the sEPSC amplitude was decreased by about 70%, the decrease observed in excitatory CA1 PCs and granule cells (GCs) was 35% and 38%, respectively (Figure 3A). The mEPSCs recorded in CA1 PCs of TKO mice were reduced by about 33% compared to WT neurons (Figure 3A). Sole removal of Noe1 also led to similarly decreased sEPSCs, although the reduction was somewhat less pronounced (55% in INs, 23% in CA1 PCs, 22% in GCs). The combined KO of Noe2, 3 resulted in a significant decrease of the sEPSC amplitude only in hippocampal INs (32%), whereas in principle cells the sEPSC amplitudes remained essentially unaltered compared to WT (no statistical significance). Interestingly, the prominent reduction observed for the sEPSCs in hippocampal INs was mirrored by two types of inhibitory neurons of the cerebellum, Purkinje cells and basket cells, where removal of Noe1-3 decreased the amplitude of the AMPAR-mediated sEPSCs by 60% (Figure 3A). Different from AMPAR currents, sEPSCs mediated by NMDA-type glutamate receptors (NMDARs) or sIPSCs through GABAA receptors were not affected by the deletion of Noe1-3 (Figure S8A, B), nor was the number/density of NMDARs determined in freeze fracture replicas of postsynaptic spines in Noe1 KO mice altered (GluN1, Figure S8A).
Figure 3. Noe1 is required for activity-dependent plasticity in CA3-to-CA1 synapses.
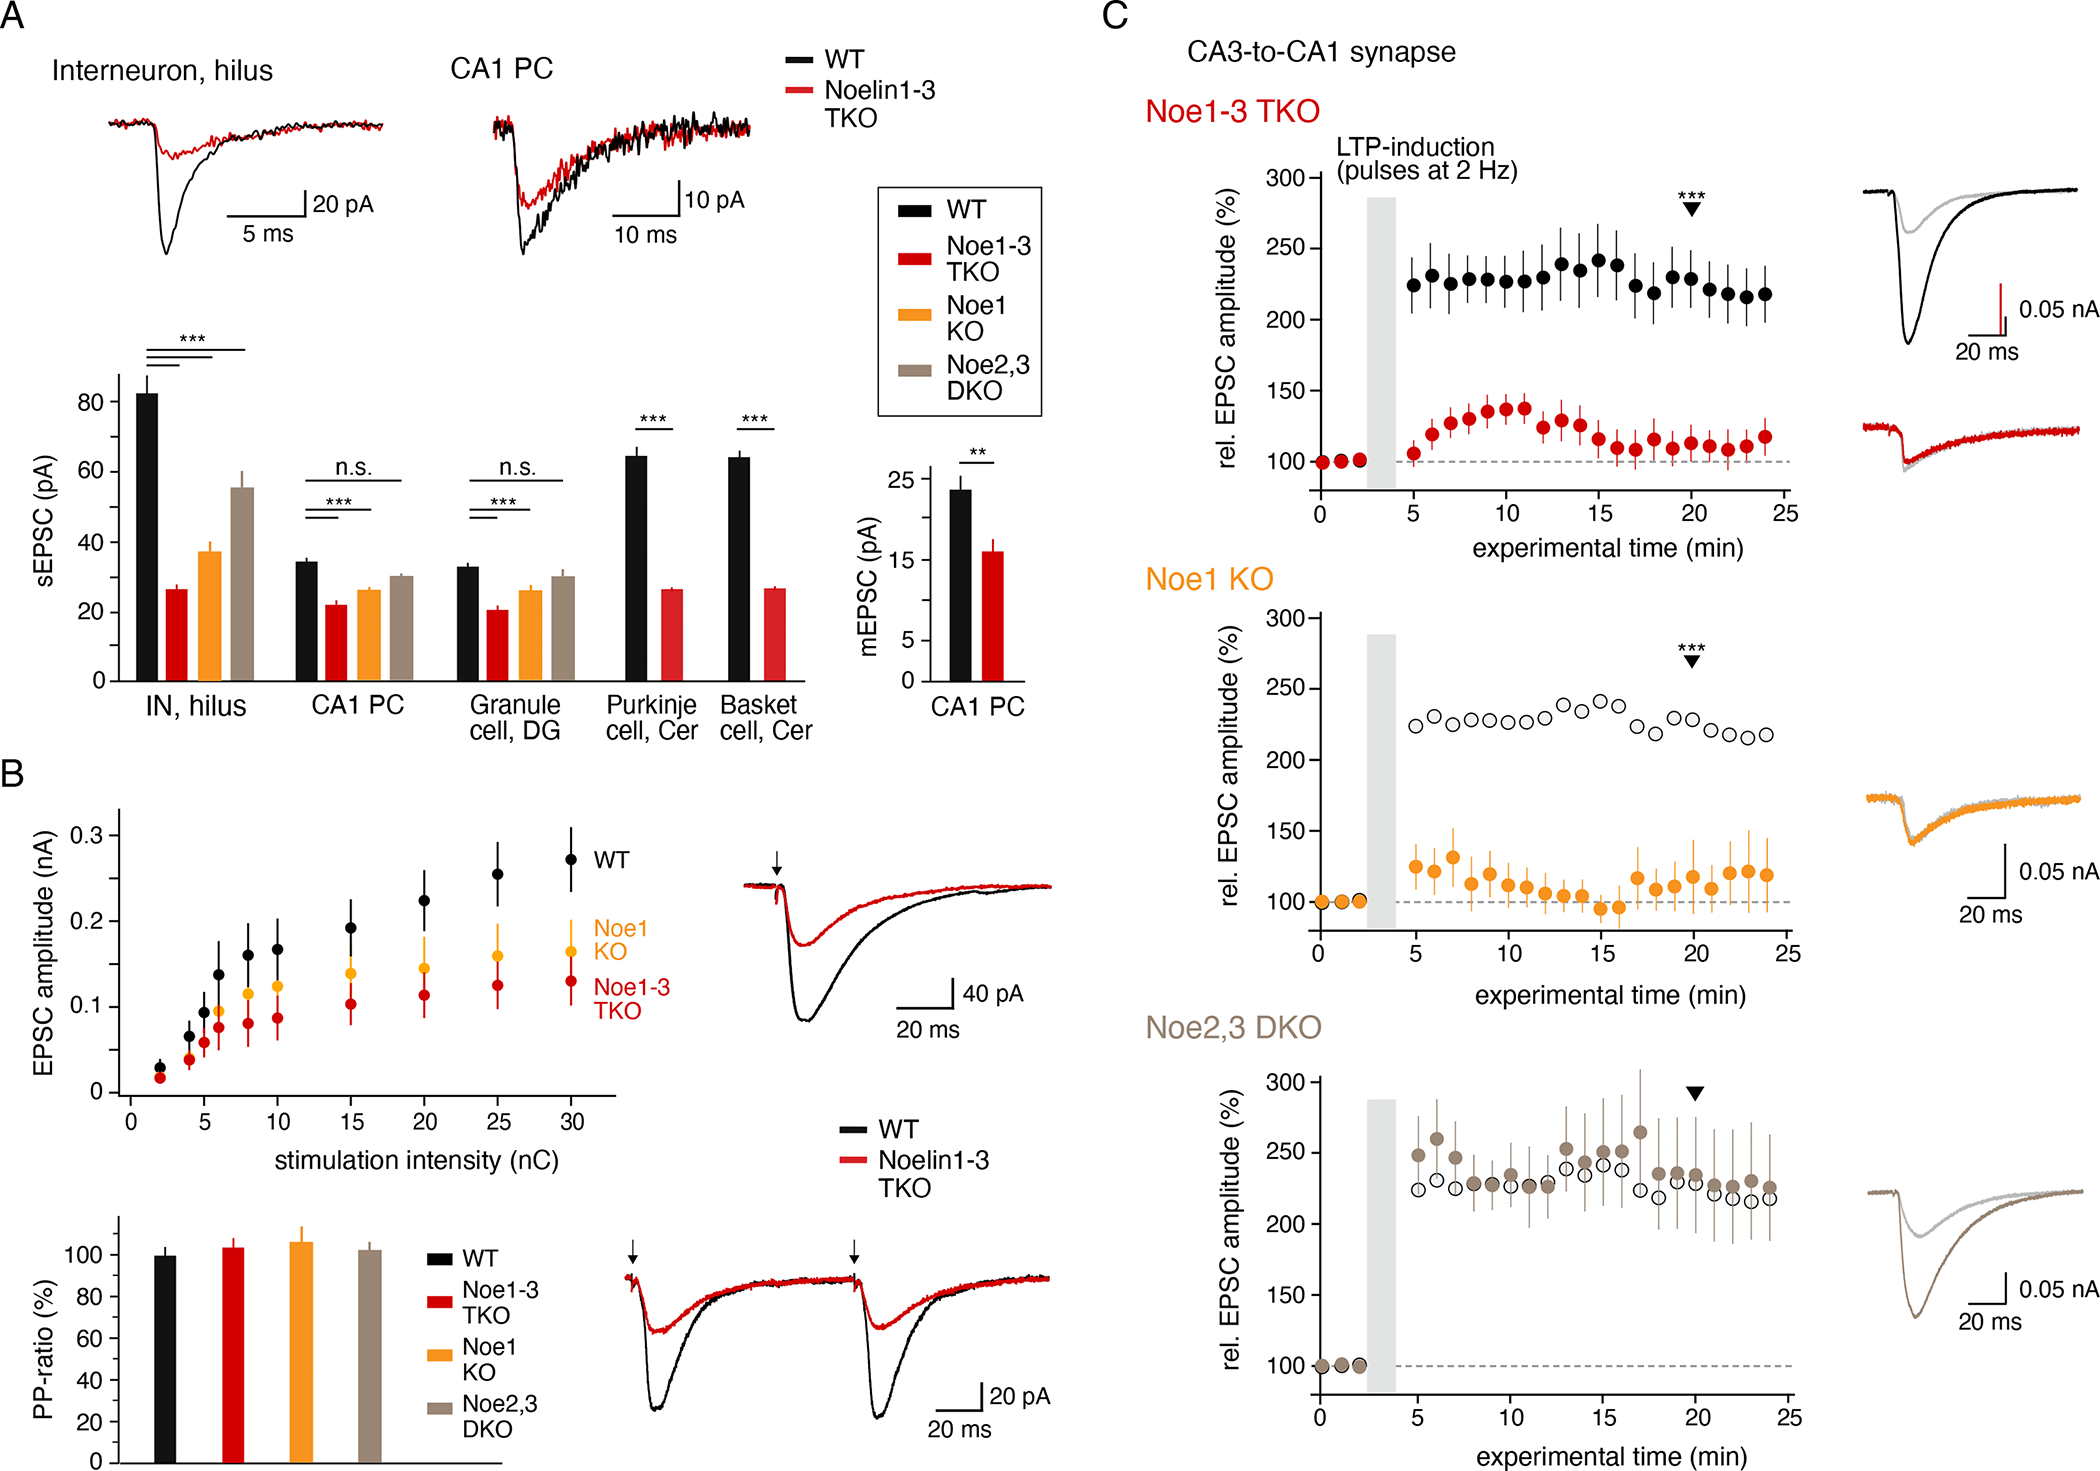
(A) Bar graphs summarizing the amplitudes of AMPAR-mediated sEPSCs or mEPSCs measured in whole-cell recordings in the indicated types of hippocampal and cerebellar neurons of WT, TKO, Noe1 KO and Noe2,3 DKO animals. Data for sEPSCs are mean ± SEM of 10/12/10/9 hilar INs, 10/12/4/3 CA1 PCs, 10/11/4/3 DGs, 10/10 Purkinje cells and 10/10 basket cells (p-values < 0.001 given by three asterisks for all bar-denoted pairs below, Mann-Whitney U-test). Data for mEPSCs are mean ± SEM of 5 WT and TKO neurons (p-values < 0.01, Mann-Whitney U-test). mEPSCs occurred at frequencies of (mean ± SEM) 1.3 ± 0.2 and 2.4 ± 0.7 Hz for WT and TKO neurons, respectively (p-value > 0.05, student’s T-test, not significant). Inset: Representative sEPSCs from hilar interneurons and CA1 PCs; time and current scaling as indicated. Note the distinct reduction of sEPSCs in TKO neurons. (B) Upper panel, input-output relationship determined for Schaffer collaterals-evoked EPSCs in CA1 PCs of WT, Noe1 KO and TKO mice. Data are mean ± SEM of 8 (WT), 6 (Noe1 KO) and 6 (TKO) neurons. Inset: Representative evoked EPSCs recorded in WT and TKO PCs; current and time scaling as indicated. Lower panel, bar graph summarizing the paired-pulse (PP) ratio determined with a stimulation frequency of 10 Hz for CA3-to-CA1 synapses in WT and the indicated Noelin KO neurons. Data are mean ± SEM of 31 (WT), 6 (Noe1 KO), 8 (DKO) and 11 (TKO) CA1 PCs. Inset: Representative PP-ratio recording from WT and TKO neurons; current and time scaling as indicated, arrows indicate time point of stimulation pulses. (C) Amplitudes of EPSCs measured in CA1 PCs upon electrical stimulation before and after LTP induction by the pairing method in brain slices of adult WT and TKO (upper), Noe1 KO (middle) or Noe2,3 DKO (lower) mice. Data are mean ± SEM of 14 WT, 10 TKO, 6 Noe1 KO and 5 Noe2,3 DKO neurons (p < 0.001 for EPSCs marked with the arrowhead; Mann-Whitney U-test). Data for WT were pooled from all WT recordings and used as control for all KOs (see Methods). Right panel, representative EPSCs recorded before (gray) and 20 min after LTP-induction (black and red traces (upper), orange (middle) and brown (lower); arrowhead); current and time scaling as indicated.
Note the small and transient induction of LTP in TKO and Noe1 KO mice, while in Noe2,3 DKO neurons LTP was comparable to WT.
These results indicated that Noelins profoundly and selectively impact, in a cell-type specific manner, the distribution and number of AMPARs in synaptic and extra-synaptic membranes of hippocampal neurons, at least under steady-state conditions.
Noelin1 is required for activity-dependent plasticity in CA3-to-CA1 synapses
To see whether and to what extent extracellular Noelins affect the dynamics of AMPARs in synapses, we recorded AMPAR-mediated evoked EPSCs before and after stimulation of the Schaffer collaterals (CA3-to-CA1 synapses). Noteworthy, electrical stimulation of the synapses probed by paired-pulse recordings at 10 Hz 39 appeared unaffected by the Noelins (Figure 3B), while the input-output relation of the Schaffer collaterals-evoked EPSCs was impaired in TKO and Noe1 KO as a combined result of the aforementioned changes in number and distribution of the AMPARs.
When Schaffer collaterals-stimulation was performed with a pairing protocol (postsynaptic depolarization combined with 2-Hz electrical stimulation (via a bipolar electrode) over 90 s) it triggered robust potentiation of the EPSC amplitude by about 2.5-fold in CA1 PCs from adult WT mice that persisted over a period of at least 20 min (long-term potentiation (LTP, (Schwenk et al., 2019), Figure 3C). In TKO mice, the same stimulation failed to trigger a stable LTP, but rather resulted in a small and transient increase of the evoked EPSCs consistent with recruitment of additional AMPARs into the postsynaptic membrane that failed subsequent stabilization or anchoring (Figure 3C). Importantly, this failure occurred in the presence of close to normal levels of the postsynaptic PDZ-proteins DLG4/PSD95 and DLG1/SAP97 as evidenced by the MS-determined abundance ratios (normalized to the amount of GluA tetramers) in TKO versus WT of 0.91 (Figure S3) and 0.85, respectively. Recapitulation of the LTP-experiment in CA1 PCs with a sole Noe1 KO showed a similarly transient increase in EPSC amplitudes as TKO cells, in line with the prominent expression of this Noelin isoform in the CA1 field (Figures 3C (middle), 2A). In contrast, combined removal of Noe2, 3 failed to affect LTP resulting in an activity-triggered increase of evoked EPCSs in DKO neurons that were identical in amplitude and stability over the entire experimental period to those recorded from WT neurons (Figure 3C, lower).
Together, these results strongly suggested that Noelins are necessary for stabilizing AMPARs in the postsynaptic membrane both under steady-state conditions and after their insertion following increased synaptic activity.
Noelins link AMPARs to a variety of anchoring proteins
For insight into the molecular nature of such stabilization, we searched for additional proteins interacting with Noe1 by extending the quantitative evaluations of the anti-Noelin1 APs (Figure 1C) and performing pull-down experiments with heterologously synthesized Noe1 protein as a bait.
In the first approach, we evaluated the anti-Noe1 APs towards comprehensiveness using tnR-values of >0.25 as a specificity threshold for co-purification and requiring supra-threshold values in at least three of the four AP-datasets (consistency criterion). These efforts identified a number of additional proteins with established expression patterns (Figure S9) as specific interactors of Noe1 (Figure 4A): First, the one-transmembrane-domain (single-pass type I membrane) proteins Neurexin1, Seizure 6-like protein (SE6L1), Ig-domain-containing protein SHPS1 and renin receptor protein (RENR). Both, Neurexin1 and SE6L1 have been related to AMPARs before 40,41 and are localized to the pre-synaptic or the post-synaptic membrane, respectively (Figure S10A). The second class of interactors were secreted/soluble proteins comprising Brorin, Brorin-like (VWC2l), Clusterin (CLUS) and protein HPLN4; Brorin and Brorin-like have been consistently retrieved in previous anti-GluA APs 7,31 in contrast to Clusterin and HPLN4. The remainders of the additionally detected Noe1-interactors were all established constituents of mature AMPARs (TARPs 3, 7, Shisa9 and PRRT1 7).
Figure 4. Noelins link AMPARs to a network of proteins mediating their extracellular anchoring.
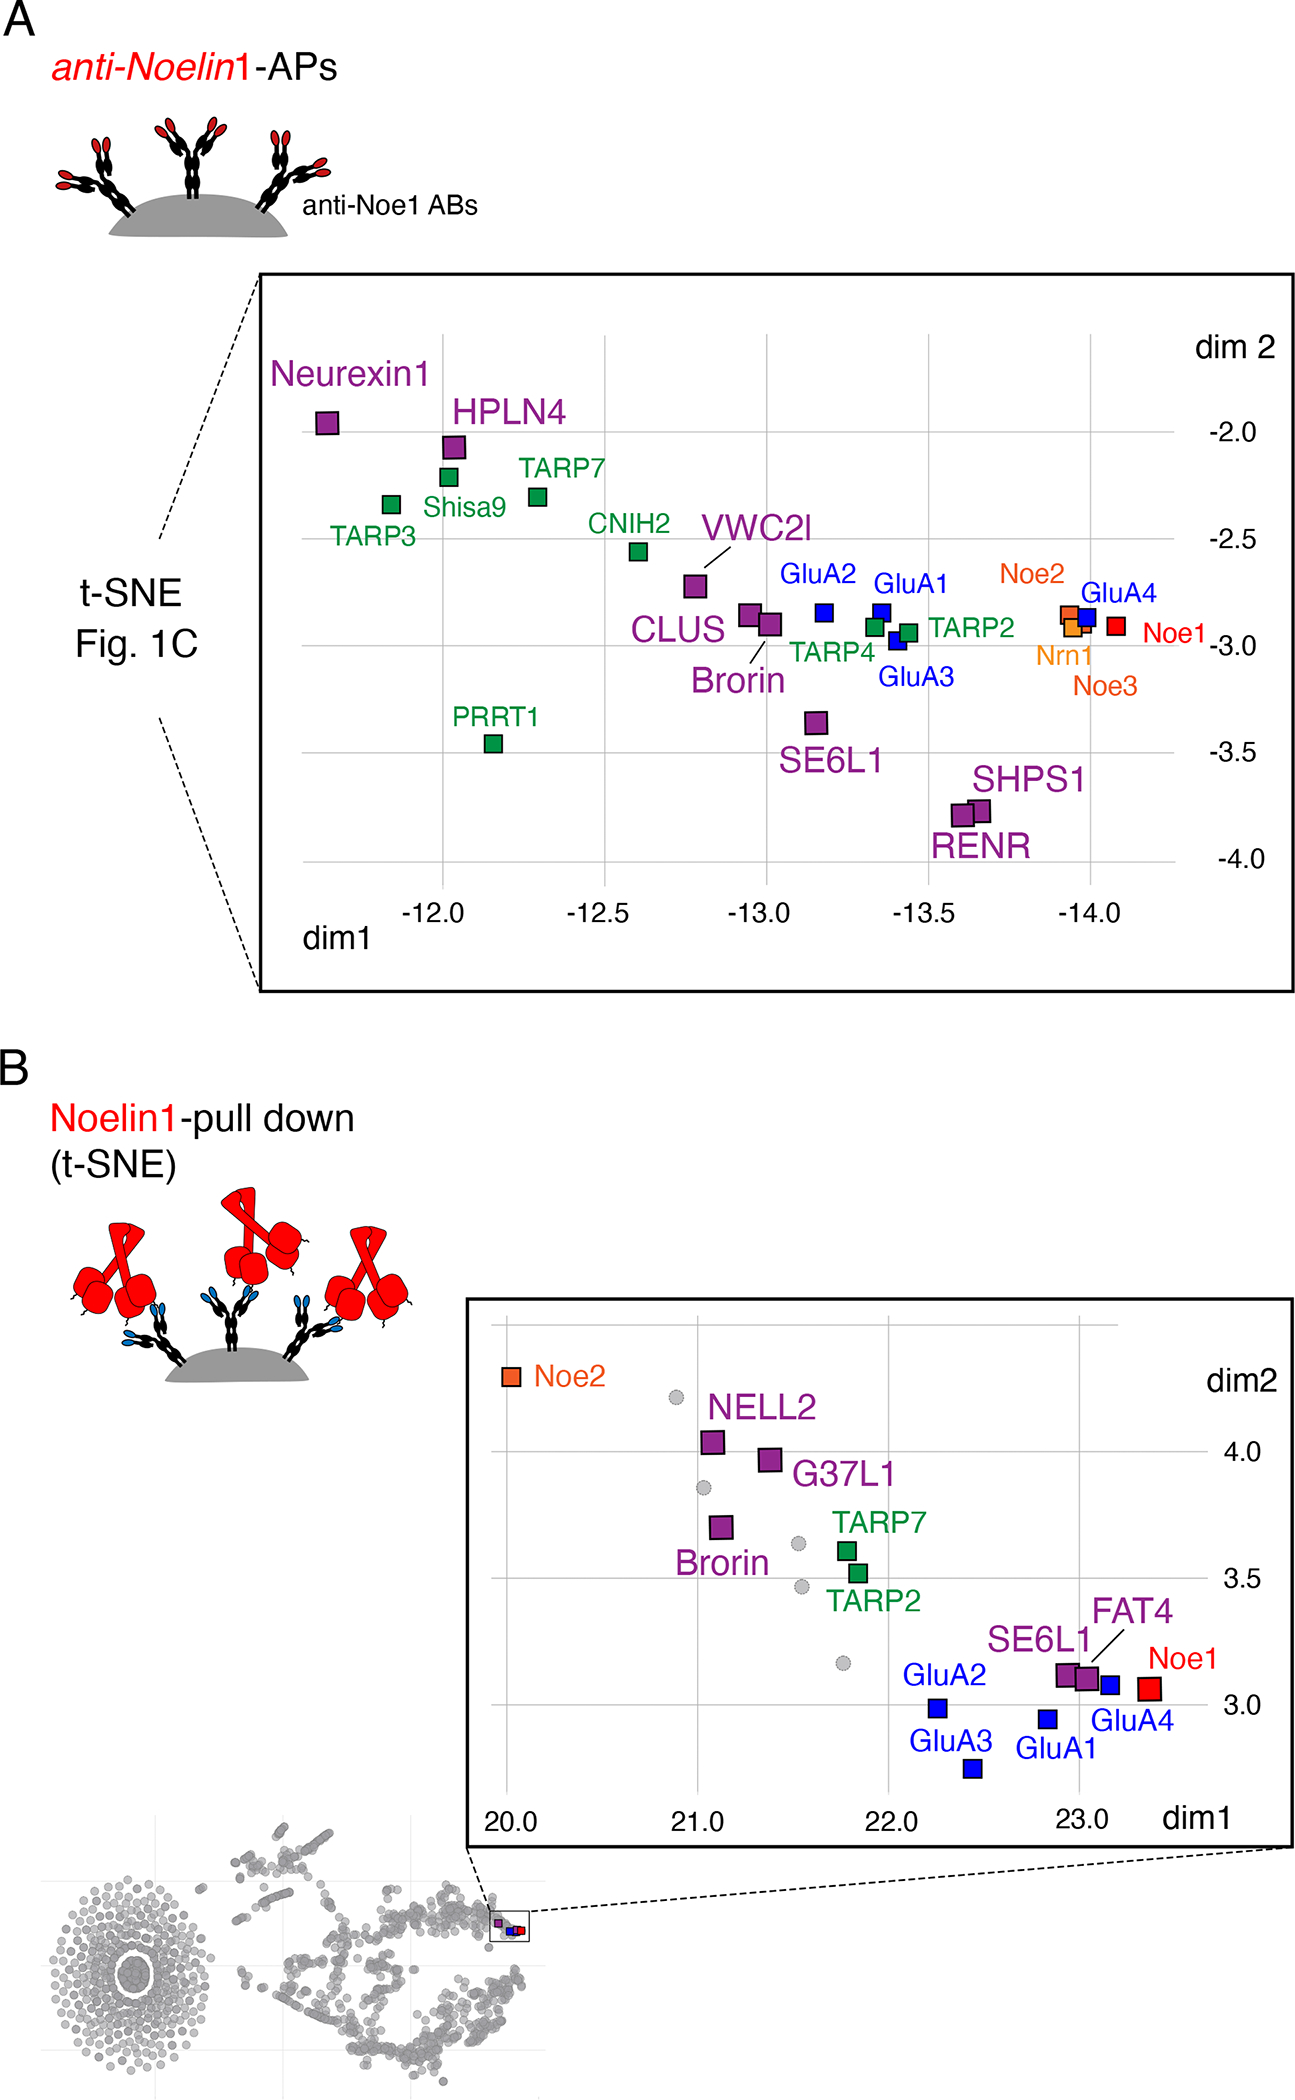
(A) Extension of the t-SNE plot from Figure 1C illustrating all proteins identified as specific interactors of Noe1 (tnR-values > 0.25) in the anti-Noe1 APs. Color-coding for constituents of AMPAR assemblies as in Figure 1C, all extracellular interactors are shown by squares in purple. (B) t-SNE plot of tnR-values as in Figure 1C for all proteins identified (and quantified) by MS-analysis in two independent pull-downs using purified Noe1 protein as a bait and CL-91 solubilized membrane fractions from whole mouse brain as source. Color-coding as in (A), all specific extracellular interactors are shown by squares in purple.
These AP-based interaction data were complemented by pull-down experiments which, instead of the anti-Noe1 ABs, used immobilized Noe1 protein to isolate target interactors from the same source material (Methods, CL-91 solubilized membrane fractions from whole mouse brain(s)). The resulting t-SNE plot (of two independent pull-downs with two negative controls for each experiment, tnR-values >0.25 used for specificity) showed that sole Noe1 specifically bound heteromeric AMPARs, as well as the extracellular interactors SE6L1 and Brorin (Figure 4B). Moreover, the pull-down identified three additional interaction partners, again classifying as secreted protein(s) (NELL2) or single- and multiple transmembrane-domain proteins with extended extracellular domains (G37L1, an adhesion-type G-protein coupled receptor, protocadherin FAT4, a single-pass membrane protein, Figure 4B).
Together, the combined set of membrane-inserted and secreted proteins identified in APs and pull-downs emphasized a polyvalence of Noe1 for protein binding and strongly suggested that Noelins may serve as attachment point(s) for a network of proteins that anchors AMPARs at the surface membrane. In proof-of-principle experiments this hypothesis was finally probed by repeating the functional and morphological analyses shown above in hippocampal neurons where Brorin, one of the identified Noelin-interactors (Figure 1C, D, Figure 4A, B)), was genetically deleted (for details on these animals (normal survival rate) see Methods, Figure S3). Strikingly, the number of AMPARs detected by immuno-EM in the surface membrane was significantly reduced in both synapses and dendrites of Brorin-ablated neurons (Figure 5A), albeit to a lesser extent than by the removal of either Noe1-3 or Noe1 (Figure 2C), while the concomitant increase in AMPAR-free (silent) synapses was again about two-fold (Figure 5A). And, similar to the Noelin KOs, the sEPSC amplitudes were decreased by the Brorin KO again with a stronger impact on IN than principle cells as observed before (Figure 3A, Figure 5B); the mEPSC amplitude was reduced by 23% compared to WT (Figure 5B). Finally, Brorin-depleted CA1 PCs failed to effectively and robustly recruit additional AMPARs into the synapse in response to stimulation by the pairing-protocol (Figure 5C), although the observed impairment relative to WT was less pronounced than induced by removal of the Noelins (Figure 3). Noteworthy, the AMPAR assemblies affinity-isolated with anti-GluA1-4 ABs from Brorin KO showed slight reduced association with the Noelins, whose overall distribution, however, appeared largely unaltered (Figure S11).
Figure 5. Effect of deletion of the network constituent Brorin.

(A) Electron micrograph illustrating distribution (left panel, scale bar is 200 nm) and bar graphs denoting either relative contribution of GluA-free synapses or surface densities (right panels, mean ± SD of 23 GluA-positive synapses and 27 dendrites for Brorin KO, WT data added from Figure 2C; p-values < 0.001 for both sites, Student’s T-test)) of immuno-particles for GluA1-4 (6 nm gold-particles) determined on the plasma membrane of dendritic shafts (den) and spines (s) of CA1 PCs in hippocampi of WT and Brorin KO mice. (B) Bar graphs summarizing the amplitudes of AMPAR-mediated sEPSCs or mEPSCs determined as in Figure 3A in the indicated types of hippocampal neurons in WT (added from Figure 2C) and Brorin KO mice. Data for sEPSCs are mean ± SEM of 5 hilar INs, 27 CA1 PCs, 3 DGs (p-values < 0.01 denoted by three asterisks, Mann-Whitney U-test), data for mEPSCs are mean ± SEM of 5 WT and Brorin KO neurons (p-values < 0.01, Mann-Whitney U-test). mEPSCs occurred at frequencies of (mean ± SEM) 1.7 ± 0.3, not significantly different from WT. Inset: Representative sEPSCs from hilar interneurons; time and current scaling as indicated. (C) LTP-experiment as in Figure 3 performed in CA1 PCs of Brorin KO animals. Data are mean ± SEM of 14 WT (from Figure 3B, open circles) and 6 Brorin KO neurons (p < 0.01 for EPSCs marked with the arrowhead; Mann-Whitney U-test). Inset: Representative EPSCs recorded before (gray) and 20 min after LTP-induction (purple traces); current and time scaling as indicated. Note profound alterations in AMPAR-distribution, sEPSC amplitudes and LTP induction by knockout of Brorin.
Together, these results indicated that effective anchoring of AMPARs at the surface membrane requires a network of proteins rather than an individual component that is affixed to the receptor core via the Noelin-family of proteins.
Discussion
Normal operation of fast excitatory neurotransmission requires AMPARs that are both firmly inserted into the surface membrane and dynamic/adaptive in response to activity throughout the brain. Either feature relies on anchoring of the receptors by distinct mechanisms: One, well-established, occurs on the cytoplasmic side through PDZ-binding of their TARP subunits with PSD proteins, the other is generally thought to occur on the extracellular side via receptor-interactions with yet unknown protein(s) such as neuronal pentraxins (NPTX, NPTXR) reported for a small set of hippocampal (inter)neurons 23.
Here we identified Noe1-3, secreted proteins abundantly expressed in the entire brain 31, as polyvalent center pieces of an (intrinsic) extra-cellular anchor mechanism that firmly stabilizes AMPARs at the surface membrane by attaching the receptors to network(s) formed by a variety of membrane-inserted and soluble proteins (Figure 6). Disruption of this Noe-based anchoring led to cell-type specific reduction of surface AMPARs (at steady-state) and abolished long-term synaptic plasticity in CA3-to-CA1 synapses most likely due to the inability to maintain receptors after their (initial) activity-triggered insertion.
Figure 6. Working model for AMPAR-anchoring by Noelin-based extracellular networks.
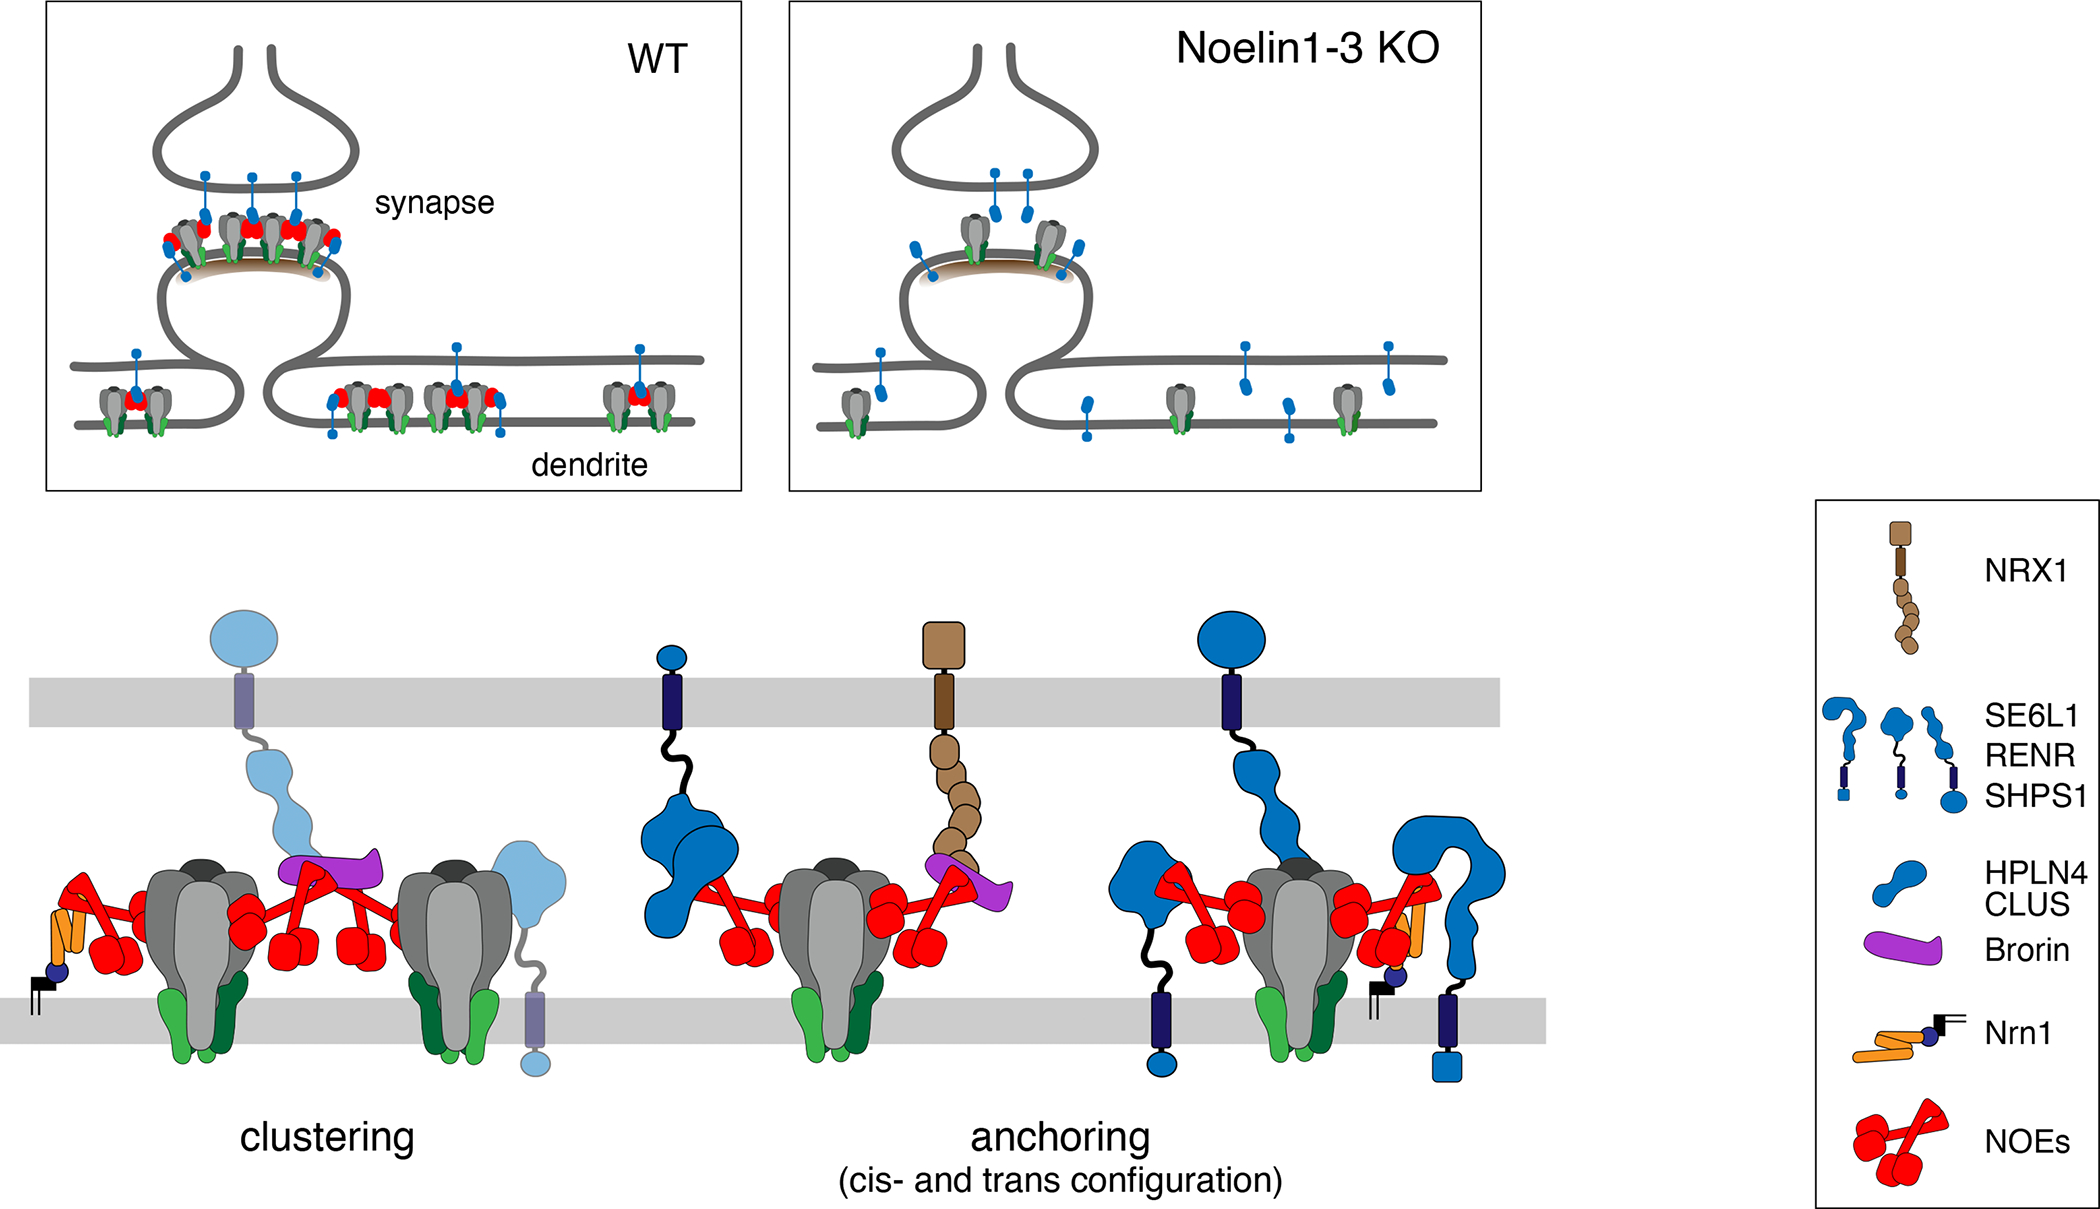
Scheme illustrating the results derived here for the hypothetical molecular appearance and operation of the Noelin-associated protein networks for clustering and anchoring of surface AMPARs in synapses and dendrites. The selected network constituents given on the right are drawn about to scale using data from literature and databases, as well as structural predictions/conclusions from AlphaFold 42. Sites and structural details of interactions were not intended. Most of the newly identified Noe interactors escaped detection in our previous anti-GluA APs for technical reasons (stability of 3rd-line interactors of AP-target). Inset depicts the alterations induced by removal of Noe1-3 leaving accumulation/localization of synaptic AMPARs to interactions with the PSD depicted as a sub-membraneous layer.
Noelin-associated networks of proteins
The Noelins first identified as constituents of the AMPAR interactome in the rodent brain 7,10 are secreted as glycosylated tetramers (Figure 1B, 32) which presumably through their olfactomedin domain(s) (olfmD, Figure 1B) associate with the GluA protein(s) similar to the neuronal pentraxins (NPTX, NPTXR) 22. Strikingly, the olfmD and the pentraxin domain resemble each other in their structural arrangement/folding (as predicted by AlphaFold 42, Figure S12) and exhibit highest affinity for GluA4 (over GluAs1-3, 25). However, while NPTXs (almost) exclusively associate with GluA4, Noelins tightly interact with all GluAs, albeit with some differences in the dependence on the GluA N-terminal domains (NTDs) as seen with heterologously expressed GluA homomers (Figure S1). Noteworthy, Noe1 is highly conserved among vertebrates, but not among in-vertebrates (Figure S13) and does not alter the gating kinetics of the receptor channels (Figure S14).
In native tissue (adult mouse brain) the olfmDs promote tight binding of Noe1 to surface AMPAR assemblies of diverse subunit composition, and, likely together with the ccDs and NtDs (Figure 1B), also enable the formation of hetero-tetramers among the three Noelin isoforms. In addition to AMPARs, these Noe tetramers associate with a series of additional proteins, either transmembrane proteins or secreted proteins, all identified by unbiased quantitative proteomic approaches (APs and pull-down; Figures 1, 4). While Neurexin1, Nrn1 and SE6L1 have been (unequivocally) localized to pre- and postsynaptic/dendritic membranes, respectively, the other transmembrane Noelin interactors currently lack such subcellular annotation(s) in literature and public databases. Nonetheless, based on their bi-lateral interactions, the Noelins, are envisaged to operate as polyvalent adaptors that firmly (inter)link AMPARs with the variety of (newly identified) transmembrane and secreted proteins as schematized in Figure 6. The resulting network-like arrangement(s) provide straightforward explanation for (i) anchoring of AMPAR assemblies in cis- and trans-configuration at both synapses and extra-synaptic sites, as well as for (ii) clustering of the receptor complexes observed along dendrites (Figure 2B, 15). Whether or not Noelin-based anchoring also contributes to the formation of transsynaptic nano-columns 43 remains to be shown. Of note, the illustrated networks are not only built on transmembrane proteins, but well rely on the contribution of secreted proteins as emphasized by the stabilizing effects seen with the Brorin KO (Figure 5).
Although the majority of the newly identified Noelin interactors have not yet been linked to AMPARs, they have been implied in a variety of processes that may well be related to AMPAR physiology such as impact on synaptic transmission and its dynamics, synapse formation, neuronal development and/or differentiation, triggering/induction of epileptic activity, as well as learning and memory formation 40,44–49. Particularly noteworthy, knock-out of SE6L1 led to altered density/morphology of spines and impaired memory formation in the hippocampus and interaction of SE6L1 with GluA2-containing AMPARs has been suggested to be involved in phenotype generation 40. In addition, it appears justified to hypothesize that the variety of Noelin-interactors detected in the whole brain reconstitutes the molecular basis for the cell-type and region-specificity described for synaptic transmission and its plasticity, although future analyses will be required to uncover the precise expression patterns of the network constituents, to clarify where and how the secreted proteins are released, as well as how far they diffuse and what defines their stability in the extracellular milieu.
Significance of Noelin-based anchoring of AMPARs
Independent of these questions, the results obtained for distribution and dynamics of AMPARs in high-resolution replica immuno-EM and patch-clamp recordings on WT and KO neurons emphasized the profound significance of the Noelins and their associated network partners for glutamate-based synaptic transmission and its plasticity (Figures 2–5). Thus, the networks profoundly impacted the number of AMPARs (at steady-state) in dendrites and synapses of excitatory and inhibitory neurons, where the removal of Noe1-3 led to a reduction of about 40% and 70%, respectively. The higher impact in interneurons, that was independent of the brain-region (in hippocampus and cerebellum), appeared to be a combined effect of GluA4, the major pore-forming subunit in inhibitory (inter)neurons, and the higher expression of Noe2, 3 and Brorin in these cells (Figure 3, Figure S5).
Even more striking was the impact of the Noelin-networks on long-term potentiation determined in the most widely used model synapse, the Schaffer collateral to CA1 PCs. In contrast to the robust and maintained increase of AMPARs induced by the pairing protocol in WT neurons, TKO and Noe1 KO (but not Noe2, 3 DKO) neurons displayed a bi-phasic response with a small and transient increase followed by a complete decline to the end of the experimental period (Figure 3). Of note, this time course was observed under conditions where neither AMPAR biogenesis (whose disruption emptied the reserve pool and fully abolished LTP 15) was altered, nor were any obvious changes in the amount of PSD proteins detected by our MS-analysis. It appears, therefore, reasonable to assume that in Noelin-deprived neurons additional AMPARs may be initially inserted into the post-synaptic membrane where they cannot be stably trapped 3,50 and are subsequently removed likely by endocytic pathway(s). In such a model, the Noelins and their associated networks are required for robust (post-synaptic) LTP in response to (acutely) increased activity. PSD-anchoring appears important for accumulating AMPARs in the post-synapse under (slower) steady-state conditions of balanced exo- and endo-cytosis/diffusion in line with previous work 51,52 and evidenced here by sEPSCs (and immuno-gold particles) and the AMPAR-interactome obtained/determined in TKO animals (Figures 1, 2).
The model of AMPAR-anchoring via Noelin-based extra-cellular networks as (major) determinants for generation of LTP and, thus, information storage is reminiscent of the ‘holes in the perineuronal net (PNN)’ hypothesis suggested for long-term memory (by R. Tsien, 53). In fact, several constituents of the Noelin-networks are either established parts of the PNN or the extracellular matrix or are thought to interact with them 48. However, uncovering the details behind the extra-cellular AMPAR anchoring and its dynamics certainly requires further molecular and functional work guided by the results presented here.
Star* Methods
RESOURCE AVAILABILITY
Lead contact
Further information and requests for resources and reagents should be directed to and will be fulfilled by the lead contact Bernd Fakler (bernd.fakler@physiologie.uni-freiburg.de)
Materials availability
Request for resources and reagents should be directed to the lead contact.
Data and code availability
The mass spectrometry proteomics data have been deposited to the ProteomeXchange Consortium via the PRIDE partner repository with the dataset identifier PXD041655 and 10.6019/PXD041655 and are publicly available as of the date of publication.
This paper does not report original code.
Any additional information required to reanalyze the data reported in this paper is available from the lead contact upon request.
EXPERIMENTAL MODEL AND SUBJECT DETAILS
Generation of knockout animals
The Noe1 (Olfm1 gene) KO mouse line was produced by elimination sequences corresponding to exons 4–6. The Olfm1 floxed line was generated using a targeting vector in which exons 4, 5, and 6 were flanked by the LoxP sites. The inserted phosphoglycerate 1 kinase promoter (PGK)-neomycin cassette in this targeting vector was used as a selective marker. After electroporation of the targeting vector into ES cell (129S6), positive clones with homologous recombination were selected using G418. Positive clones after G418 selection were further screened by a long-range genomic PCR. Positive clones were used for a blastocyst injection to generate chimeras. Chimeras were further mated with C57BL/6 and genotyping of the LoxP line was performed using primers designed for 5’- and 3’- LoxP screening. PCR products were further sequenced to confirm the sequence of the LoxP site. The Olfm1 KO line was generated by mating the homozygous Olfm1 floxed line with ZP3 Cre line, a female germ line-specific Cre line. After mating for 2 generations, the Olfm1 homozygous KO mouse line was generated in which exons 4, 5, and 6 were deleted. Following pairs of primers were used for genotyping of Olfm1 KO homozygous, heterozygous and wildtype mice: (Olfm1 C-F) 5’-TCGAATCTCCATGTCATCGG-3’, (Olfm1 WT R) 5’-CAGGGCACTAGG AAAACTCT-3’, (Olfm1 KO R) 5’-AGAGCATCACACAGAGTCCC-3’. Forward common and WT reverse primers were selected from the region located in intron 1 while knockout reverse primer was located in intron 4. A single genotyping PCR was carried out with the hot start at 94°C. The PCR conditions used includes initial denaturation at 95°C for 5 min, followed by 35 cycles consisting of denaturation at 94°C for 30 sec, annealing at 57°C for 32 sec and extension at 72°C for 35 sec. A final extension at 72°C was carried out for 7 minutes. The resulting size of PCR products from these reactions were 308 bp and 469 bp for wildtype and knockout alleles, respectively. Heterozygous Olfm1 KO mice were further mated with C57BL/6 five times before mating to produce homozygous Olfm1 mice used in the experiments.
The Noe2 (Olfm2 gene) KO mouse line has been characterized and reported in a previous study 54.
The Noe3 (Olfm3 gene) KO mouse line was generated in the Uconn Health Center (Connecticut) by designing a targeting vector, in which the genomic sequence including exon 4, exon 5, and exon 6 of the Olfm3 gene was flanked by the neomycin gene preceded by a PGK-neomycin cassette. After electroporation of targeting vector into ES cells, G418 selection and PCR screening for positive clones were performed as described for the Olfm1 KO line above. Positive clones were selected for blastocyst injection to generate chimera mice. Those mice were further mated with C57BL/6 for two generations. Genotyping of mice was performed using the following primers: (Olf3gt5F) 5’-CCATGACCCCTTTAGGGATT-3’, (Olf3gt5R) 5’-GCTAAAGGATCCGTCATCCA-3’, and (PL452scr5R2) 5’-ATGATCGGAATTGGGCTGCA-3’. The resulting size of PCR products from these reactions were 273 bp and 173 bp for WT and KO alleles, respectively. These mice were used for the study after crossing for more than 5 generations with C57BL/6. Olfm1, Olfm2, and Olfm3 single KO were intercrossed to produce Olfm2-3 double KO and Olfm1-3 triple KO. Since the Olfm1 knockout did not produce pups, the triple knockout mice were produced by mating Olfm1+/−-Olfm2−/−-Olfm3−/− males and Olfm1+/−-Olfm2−/−-Olfm3−/− females. The absence of all three Noelin proteins in the triple KO was confirmed by proteomic analysis.
The Brorin KO (B6;129S5-Vwc2tm1Lex/Mmcd, Stock# 031621-UCD) was purchased as cryopreserved sperms from MMRRC-UC-Davis. The sperm was restored by the Genetic Engineering Core at the National Eye Institute, National Institutes of Health. The third exon coding 231 amino acid of the N-terminal Brorin was knocked out, and the lack of the protein in the brain LP1 fraction was confirmed by immunoprecipitation, Western blot and proteomic analysis.
The Nrn1 KO (B6;FVB-Nrn1tm1.2Ndiv/J, Stock# 018402) was purchased from The Jackson Laboratory. The mouse phenotype was previously studied in detail (Fujino et al., 2011).
Female and male Noe1 KO mice are fertile although they don’t actively breed. Starting from 12 hrs after birth, Noelin1 KO and Noelin1-3 TKO tended to be smaller than the Noe1+/− or Noe1+/−-Noe2−/−-Noelin3−/− littermates. Most of the Noe1 KO and Noe1-3 TKO died within the first two days after birth. 8.5% of Noelin1 KO pups and 2.8% of Noe1-3 TKO pups survived longer than 3 weeks. Surviving Noe1 KO and Noe1-3 TKO demonstrated reduced behavioral (motor) activities; detailed behavioral studies were precluded by the limited number of surviving Noe1 KO and Noe1-3 TKO animals. Brain and retinal phenotypes of Noe2 KO mice have been described in a previous report (Sultana et al. 2014). These mice demonstrated reduced exploration, locomotion, olfactory sensitivity, abnormal motor coordination, and anxiety related behavior. Their retinal and olfactory functions are partially defected. Noe3 KO mice breed normally, and 76.7% of their pups survived longer than 3 weeks. The behavior of Noe3 KO mice appears normal and preliminary assessment of the brain sections found no defects. Brorin KO mice showed normal fertilization rate and their pups survived into adulthood without any problems. Their general phenotype is largely normal. The Brorin KO data are available on the website of UC-Davis (https://mmrrc.ucdavis.edu/lexiconphenotype.php?id=PSC212N1).
METHOD DETAILS
Molecular Biology
The cDNAs used were all verified by sequencing. Noe1 (GenBank: BC026547.1 ) was subcloned into pcDNA3.1, the signal peptide (1-16) replaced by a mouse Ig kappa leader-sequence and a C-terminal hexa-histidine tag attached (Noe1-His) or an additionally Flag-tag inserted at residue 18 (Noe1-Flag). Human Neuritin (NM_016588.2) was modified with an HA-tag at residue 29. GluA1-4 and N-terminal deletions 55 were: GluA1 (M38060.1), GluA2 (NM_017261.2), GluA3 (X54656.1), GluA1 ΔNTD (EDM04494.1, residue 1-18, 392–907), GluA2ΔNTD (M38061.1, residue: 1-21, 399–883), GluA4 (NM 017263.2), GluA4 ΔNTD (NM 017263.2, residue: 1-21, 400–902).
Biochemistry and Cell Biology
PI-PLC assay
30 transverse hippocampal brain slices (250 μm) from 3 WT Wistar rats were freshly prepared and transferred into a 12-well petri dish containing 0.5 ml PBS buffer at 37°C. Each well was loaded with 5 randomly picked slices. PBS was replaced with 0.5 ml PBS supplemented with 1 mM EDTA. PI-PLC digest was started by adding 5 μl PI-PLC (#P6466, Invitrogen) per well. 3 wells served as control and were left without enzyme. After incubation for 45 minutes at room temperature supernatants from each well were transferred to 1.5 ml LoBind tubes (Eppendorf) and centrifuged (5 min., 10,000×g). Supernatants were concentrated by centrifugation in ultrafiltration columns (0.5 ml, 10K, Amicon) and adjusted to a final volume of 40 μl. 8 μl of each sample was mixed with Laemmli buffer and separated on a 10% SDS-PAGE. Proteins were silver stained and gel lanes cut in three pieces. Proteins were in-gel digested with sequencing-grade modified trypsin (Promega, Germany). Extracted peptides were processed for MS analysis as described 7.
Protein expression and purification
Noe1-His was expressed in transiently transfected tsA201 cells cultivated in Freestyle 293 (Thermo Scientific) medium + 2% FCS at 37°C, 5% CO2 in shaker flasks in suspension. After transfection (PEI, Polyscience) cells were cultivated for 10 days with 20% medium supplement after 7 days. Cells were separated by centrifugation (20 min., 3,000×g). Medium was cleared by filtration through a 0.45 μm vacuum filter (Sigma) and adjusted to pH 8 with 0.1 M sodium phosphate buffer. 0.6 l medium was loaded on a 5 ml HiTrap Excel column (Cytiva) with 1,5 ml/min flow using an HPLC ÄKTA system (Cytiva). The column was washed with 20 mM Na-Phosphate pH 8, 300 mM NaCl, 50 mM Imidazole and proteins eluted by linear increase of Imidazole to 300 mM. After inspection on SDS-PAGE fractions with Noe1-His in highest purity were pooled and concentrated by ultrafiltration (Vivaspin 100.000 MWCO). Subsequently, proteins were loaded on a Superdex 200 increase 10/300 GL (Cytiva) in 20 mM Na-phosphate, 300 mM NaCl pH 8 and separated as monodisperse peak. Purity of proteins was checked by SDS-PAGE and Coomassie stains. Protein concentrations were determined by absorbance measurement at 280 nm; proteins were used for analytical ultracentrifugation (AUC) or shock-frozen in liquid nitrogen and stored at −80°C.
Analytical ultracentrifugation (AUC)
Sedimentation velocity analytical ultracentrifugation was used to analyze mass and shape of Noelin1 protein. Experiments were performed on an Optima XL-A centrifuge (Beckman). Briefly, a 2-sector centerpiece was filled with 400 μl protein solution (5 μM Noe1-His in PBS) and sole buffer as a reference. AN-60 Ti rotor (Beckman) together with samples in place were adjusted to 10°C under high vacuum for 4 hours or overnight. Runs were made at 50.000 rpm and the absorbance monitored at 280 nm wavelength. 100 data points were measured and used for data analysis by SEDFIT using continuous c(S) mode 56. The partial specific volumes of Noe1-His (0.722 mL/g), buffer density (1.0068 g/ml) and viscosity (0.001329 Pa*s) were calculated.
Affinity purifications and proteomic analysis
Noelin1.
Mouse brains of three WT, Noe1 KO or Noe1-3 TKO were dissected, cut in pieces and homogenized in 10 mM Tris/HCl pH 7,5, 300 mM Sucrose, 1,5 mM MgCl2, 1 mM EGTA, 1 mM Iodoacetamide and protease inhibitors (Aprotinin, Leupeptin, Pepstatin A, PMSF) with 15 ml Dounce homogenizer. The supernatants after centrifugation (4 min., 1,000×g) were subjected to ultracentrifugation (20 min., 200,000×g). Pellets were homogenized in lysis buffer (5 mM Tris/HCl pH 7,4, 2 mM Iodoacetamide), incubated on ice for 30 minutes, and pelleted again by ultracentrifugation (20 min., 200,000×g). Respective membrane pellets were resuspended in 10 mM Tris/HCl pH 7.4, 0.5 M Sucrose, filled in thin layer UC-tubes and thoroughly underlayed with 10 mM Tris/HCl pH 7.4, 0.5 and 10 mM Tris/HCl pH 7,4, 1.3 M Sucrose buffer. After ultracentrifugation (45 min., 30,000 rpm, Sorvall Surespin 630) the membrane phase was harvested, washed and finally resuspended with 20 mM Tris/HCl pH 7.4. Protein concentrations were measured by Bradford assay. For each affinity purification (AP) 1.5 mg membranes were solubilized in 1.5 ml CL-91 (Logopharm) supplemented with 2 mM Ca2+ and protease inhibitors (see above). After clearing by ultracentrifugation (10 min., 125,000×g) solubilisates were incubated for 2 hours with 15 μg antibodies pre-coupled to protein A Dynabeads. The following antibodies were used: sheep anti-Noe1 (#AF4636, RnD Systems), rabbit anti-Noe1 (epitope: full-length protein, 57), IgG (Millipore). Subsequently, antibodies were briefly washed with 2× 0.5 ml CL-91 and proteins eluted with 10 μl Laemmli buffer w/o DTT. Eluted proteins were shortly separated on SDS-PAGE and silverstained. Gels were cut in two pieces (low and high molecular weight).
AMPARs.
For complete affinity-isolation of AMPARs a mixture of antibodies coupled to Protein A Dynabeads (anti-GluA1 (#AB1504, Millipore), anti-GluA2/3 (#07-598, Millipore), anti-GluA4 (#AB1508, Milipore), anti-GluA1-4 (#AB182411, Synaptic Systems)) was incubated with 0.5 mg membranes either from WT or Noe1-3 TKO solubilized in 0.5 ml CL-47 (Logopharm; Figures 1D, S3) or from WT and Brorin KO solubilized in 0.5 ml CL-91 (Logopharm; Figure S11). Experiments were done as described for Noe1 APs and performed in triplicates.
Neuritin.
Primary cortical neurons were prepared from rats at E18 and cultured similarly as described (Goslin and Banker, 1989). Cells were transduced with Nrn1-HA AAV2/9n (pAAV-Syn-Nrn1-HA-Ubi-GFP) or control AAV2/9n (pAAV-Ubi-GFP). At DIV21, medium was removed and cells were released in ice-cold PBS buffer by the use of cell scrapers. After centrifugation (20 min., 150,000×g) cells were homogenized in 20 mM Tris/HCl pH 7,4 and protein concentrations measured by Bradford assay. Equal amounts of crude membranes were solubilized with CL-47 (Logopharm) and 2 mM Ca2+ and, after clearing by ultracentrifugation (10 min., 125,000×g), incubated with 5 μg anti-HA antibodies (#47877600, Roche), coupled to ProteinA Dynabeads (Thermo Fisher), for 2 hours. All other steps were done as described for Noe1 APs.
Proteomic analysis of membranes
Membrane suspensions of WT and Noe1-3 KO were denatured in Laemmli buffer and 5 μg per lane shortly run on SDS-PAGE. Experiments were performed in triplicates. After silver staining, gel lanes were cut out in three pieces. All Samples were processed for MS analysis as described above and in 7.
Reconstitution of protein complexes
Noe1-Flag together with the indicated proteins was expressed in transiently transfected adherent tsA-201 cells. Two days after transfection (polyethyleneimine transfection, Polysciences, USA) cells were harvested and pelleted by ultracentrifugation (10 min., 125,000×g). Cells from 2 wells of a 6-well plate were solubilized with 0.4 ml CL-91 buffer (Logopharm). After incubation for 30 minutes on ice insoluble proteins were removed by ultracentrifugation (10 min., 125,000×g). Solubilisates transferred to LoBind tubes (Eppendorf) and incubated for 2 hours with 3 μg anti-Noelin1 (#Af4636, RnD Systems) antibodies. The beads were washed twice with 0.5 ml CL-91 buffer and proteins eluted in 10 μl 1x Laemmli buffer. Solubilisates (10 μl) and eluates (4 μl) were separated on 10% SDS-PAGE and transferred for western blotting on PVDF membranes. Immunodecoration was performed with anti-Flag (#F3165, Sigma), anti-GluA1 (#AB1504, Millipore), anti-GluA2/3 (#07-598, Millipore), anti-GluA4 (#AB1508, Millipore) and HRP-conjugated secondary antibodies in combination with ECL Prime (GE Healthcare, Germany) were used for visualization.
Noe1 pull-down
The affinity matrix for all pull-down experiments were prepared as follows. Protein A Dynabeads (Thermo Fisher) were incubated with 20 μg anti-Histidine (#MCA1396, AbD Serotec) antibodies for 1 hour and after a short wash with PBS and 0.05% Tween crosslinked with 20 mM Dimethyl Pimelimidate dissolved in sodium-borate buffer (pH 9) for 20 minutes. After blocking with 200 mM Ethanolamine (pH 8) His-beads were incubated with 40 μg of purified Noe1-His for 1 hour and washed with PBST. As control Protein A Dynabeads were immobilized with IgG (Millipore). 1 mg of brain membranes from WT mice were solubilized with CL-91 (Logopharm, 1 ml detergent buffer per mg protein). After 30 min incubation on ice unsolubilized material was separated by ultracentrifugation (10 min., 125,000×g). 1 ml supernatant was incubated with 20 μg Noe1-His or 20 μg IgG for 2 hours while constantly head-over-rotation. After two washing steps with 0.5 ml CL-91 buffer, proteins were eluted in 10 μl Laemmli buffer without DTT. 100 mM DTT was added after transfer in a new Eppendorf cup. Further analyses were performed as described for Noe1 APs.
Mass Spectrometry
Silver-stained gel lanes were split into two (upper/lower) or three (upper/middle/lower) sections to reduce complexity. Then, proteins were in-gel digested with sequencing grade modified trypsin (Promega GmbH, Walldorf, Germany) following the procedure described 58. Vacuum-dried peptides were dissolved in 13 μL or 20 μL of 0.5% (v/v) trifluoroacetic acid. Appropriate amounts were loaded onto trap columns (C18 PepMap100, 5 μm particles, Thermo Fisher Scientific GmbH, Dreieich, Germany) with 0.05% trifluoroacetic acid (5 min, 20 μL/min; Figure 1E: 4 min, 10 μL/min) and separated on C18 reversed phase columns (SilicaTip emitters, 75 μm i.d., 8 μm tip, New Objective, Inc, Littleton, USA, manually packed 11 to 12 cm (Orbitrap Elite mass spectrometer) or 21 to 22 cm (Q Exactive HF-X mass spectrometer) with ReproSil-Pur ODS-3, 3 μm particles, Dr. A. Maisch HPLC GmbH, Ammerbuch-Entringen, Germany; flow rate: 300 nL/min) using a UltiMate 3000 RSLCnano HPLC systems (Thermo Fisher Scientific GmbH, Dreieich, Germany). Gradients were built with eluent ˈAˈ (0.5% (v/v) acetic acid in water) and eluent ˈBˈ (0.5% (v/v) acetic acid in 80% (v/v) acetonitrile / 20% (v/v) water): 5 min 3% ˈBˈ, 60 min from 3% ˈBˈ to 30% ˈBˈ, 15 min from 30% ˈBˈ to 99% ˈBˈ, 5 min 99% ˈBˈ, 5 min from 99% ˈBˈ to 3% ˈBˈ, 15 min 3% ˈBˈ (Orbitrap Elite mass spectrometer) or up to 5 min 3% ˈBˈ, 120 min from 3% ˈBˈ to 30% ˈBˈ, 20 min from 30% ˈBˈ to 40% ˈBˈ, 10 min from 40% ˈBˈ to 50% ˈBˈ, 5 min from 50% ˈBˈ to 99% ˈBˈ, 5 min 99% ˈBˈ, 5 min from 99% ˈBˈ to 3% ˈBˈ, 10 min 3% ˈBˈ (Q Exactive HF-X mass spectrometer). Eluting peptides were electrosprayed at 2.3 kV (positive polarity) via Nanospray Flex ion sources into an Orbitrap Elite mass spectrometer (CID fragmentation of the 10 most abundant at least doubly charged new precursors per scan cycle; Figures 1C, 1D, 4B, S1, and S3) or into a Q Exactive HF-X mass spectrometer (HCD fragmentation of the 25 most abundant doubly, triply, or quadruply charged new precursors per scan cycle; Figures 1A, E) (all Thermo Fisher Scientific GmbH, Dreieich, Germany) and analyzed with the following major settings: scan range 370 to 1,700 m/z, full MS resolution 240,000, dd-MS2 resolution ˈnormalˈ (ion trap) or 15,000, respectively, maximum dd-MS2 injection time 200 ms or 100 ms, respectively, intensity threshold 2,000 or 40,000, respectively, dynamic exclusion 30 s or 60 s, respectively, isolation width 1.0 m/z.
LC-MS/MS RAW files were converted into peak lists (Mascot generic format, mgf) with ProteoWizard msConvert (https://proteowizard.sourceforge.io/). All peak lists were searched twice with Mascot Server 2.6.2 (Matrix Science Ltd, London, UK) against a database containing all mouse, rat, and human entries of the UniProtKB/Swiss-Prot database. Initially broad mass tolerances were used. Based on the search results peak lists were linear shift mass recalibrated using in-house developed software and searched again with narrow mass tolerances for high-resolution peaks (peptide mass tolerance ± 5 ppm; fragment mass tolerance 0.8 Da for Orbitrap Elite peak lists and ± 20 mmu for Q Exactive HF-X peak lists). One missed trypsin cleavage and common variable modifications were accepted. Default significance threshold (p < 0.05) and an expect value cut-off of 0.5 were used for displaying search results.
MS quantification of proteins
Proteins were quantitatively evaluated using a recently developed label-free quantification procedure 59. First, peptide signal intensities (peak volumes, PVs) were extracted from FT full scans and mass calibrated using MaxQuant v1.6.3 (http://www.maxquant.org). Peptide PV elution times were then aligned (pairwise, Loess regression) and assigned to peptides (obtained directly or indirectly from MS/MS-based identification) based on matching m/z and elution times (tolerances 2–3 ppm / ± 1 min) as described 60. The obtained PV tables (protein-specific peptide signal intensities in all runs) were then further processed to eliminate the influence of PV outliers, false assignments and gaps by exploring the consistency of PV relations within proteins (i.e. protein-specific PV ratios between and within runs). Orthogonal combinations of these relations provided ‘expected PV values’ (EPVs) for each interconnected PV value that served as a measure of accuracy and weighting factor. In addition, time- and run-dependent detectability thresholds were estimated for each cell in the PV table based on the distribution of measured PVs (3rd percentile within a 3 min elution time window). Qualified PV data in each protein PV matrix was then aggregated to obtain global protein references termed ‘protein reference ridges’ (i.e. vectors that represent the maximum protein coverage of MS/MS-identified and quantified peptides with their ionization efficiencies). In the final step, proteins were quantified by weighted fitting of their measured peptide PVs to their respective reference ridge. In case no (consistent) peptide PVs were identified, an apparent protein detection limit was determined using the detectability thresholds of the three best ionizing peptides fitted to the protein reference ridge. Abundancenormspec values (as a measure of molecular abundance) were calculated as described 60 from the fitted protein ridges. In essence, this procedure is comparable to MaxQuant LFQ (61; all data is fitted without weighting) but quantification is more robust and accurate, in particular when only sparse PV data is available.
Determination of specificity in affinity purifications (APs) was based on target-normalized abundance ratios (tnRs) of proteins in wt versus control APs (calculated as described in 59) together with information on molecular abundance and detection thresholds of proteins. These information were collectively inspected using the BELKI software suite (https://github.com/phys2/belki). Two anti-Noe1 datasets with two controls (target knockout and IgG) provided 4 ratio combinations. tnR values were visualized by t-distributed stochastic neighbor embedding (t-SNE, Figure 1C) and signal-to-noise levels inspected in plots of abundancenormspec and threshold abundance profiles. This suggested a minimum tnR of 0.25 as indicator for positive interaction. The same way, two Noe1 pull-downs with two independent control datasets were evaluated and tnR values displayed (t-SNE, Figure 4B). For quantitative comparison of the AMPAR interactome in Noe1-3 TKO vs. WT (Figure 1D) abundancenormspec values were plotted as mean of three experiments. The change in the association of individual AMPAR interactors (Figures S3, S11) was determined by first normalizing the respective protein abundances to the sum of the GluA1-4 proteins, and subsequently calculating ratios between Noe1-3 TKO and WT. Mean values of three experiments were plotted. In Figure 1E, ratios of abundancenormspec values obtained in three independent measurements from membrane fractions of Noe1-3 TKO and WT (three mice each) were calculated and given as mean ± SEMs.
Transcription analysis
Fluorescence in-situ hybridization (RNA Scope)
Two months old C57BL/6j mouse brain was dissected, trimmed and fresh frozen in OCT compound (Fisher Healthcare). The frozen brain was horizontally cut into 10 mm-thick sections by a cryostat (Leica, CM1860). The sections were collected on RNase-free glass slides and kept at −80°C until use. Sections were fixed in phosphate-buffered saline (PBS) containing 4% paraformaldehyde, and then dehydrated by immersing sequentially into 50%, 70%, 100% and 100% ethyl alcohol. Fluorescent in-situ hybridization was performed using RNAscope™ Fluorescent HiPlex Assay (Advanced Cell Diagnostics). Hybridization probes specific to mouse Olfm1 (Noelin1, NM_019498.2), Olfm2 (Noelin2, NM_173777.4), Olfm3 (Noelin3, NM_153458.3), Gria1 (GluA1, NM_001113325.2), Gria2 (GluA2, NM_001039195.1), Gria3 (GluA3, NM_001281929.1), Gria4 (GluA4, NM_001113181.1), Vwc2 (Brorin, NM_177033.3), Vwc2l (Brorin-like, NM_177164.3), Nrn1 (Neuritin, NM_153529.2), and GAD1 (NM_008077.4) genes were designed, produced, and supplied by the company. Each of 11 probes contained individual tags for each of 11 channels (T1-T11). The hybridization and detection were carried out following the procedure recommended by the company. Three sets of 5 channel images of hippocampal CA1, CA3 and dentate gyrus regions labeled with FITC, Cy3, Cy5, Cy7 and DAPI for nuclei were acquired using a confocal and epifluorescence microscope (Zeiss, LSM-880 and Imager Z2) with Zen software (Zeiss). Obtained 14 images (11 genes and 3 times DAPI) for each region were registered to one stacked image file using three DAPI images to adjust the tissue structures profile and cell arrangement by the HyPlex image registration software (Advanced Cell Diagnostics). The images were analyzed using Imaris software (Oxford Instruments) to measure the number of mRNA puncta per cell for each gene.
Evaluation of data from DropViz
Transcript levels of individual genes in defined cell-types were calculated using the online software DropViz 37. For this purpose all subclusters assigned to a particular cell-type, according to the common name function of DropViz, were combined to a meta-group using the cluster comparison feature of DropViz with default parameter settings. The RNA count of a selected gene per 100000 unique molecular identifiers in the meta-group was then given as target sum per 100k in a downloadable table containing differentially expressed genes.
Identification of homologous sequences and phylogenetic analysis
Proteins homologous to human Noe1 were retrieved by searching the non-redundant protein database of various vertebrate and non-vertebrate organisms with BLASTP (https://blast.ncbi.nlm.nih.gov/Blast.cgi) and default parameter settings. Only proteins with homology in the region of both, the noelin-1 domain (aa55-152) and the olfactomedin domain (aa226-478) of human Noe1 were selected. MAFFT version 6 (https://mafft.cbrc.jp/alignment/server/) with standard settings was used to generate a multiple sequence alignment and a rooted neighbor-joining phylogenetic tree. Results were visualized in Archeopteryx.js.
Immunocytochemistry
Sholl-analysis
CA1 pyramidal neurons were filled during whole-cell recording with 0.2% biocytin (Molecular Probes) added to the pipette (intracellular) solution. After recording, slices were fixed overnight at 4°C in 0.1 M phosphate buffer (PB) containing 4% paraformaldehyde. Biocytin is revealed by Alexa 546-conjugated streptavidin (Molecular Probes). Entire CA1 pyramidal cells were rendered (Z stack acquisition) using a confocal laser-scanning microscope (LSM 710 meta, Zeiss) equipped with either a Fluar 10× 0.5 N.A or an Apochromat 20× 0.8 N.A. objective and images were imported into Fiji (NIH) for analysis. A total of 32 neurons with intact secondary and tertiary dendrites (5 WT; 7 Noe1-3 TKO; 3 Noe2/3 DKO; 10 Brorin KO and 7 Noe1 KO ) were analyzed for dendritic complexity. Binary images were created in Fiji from manual tracings of the entire dendritic arbor for each neuron and analyzed using the Fiji Sholl-analysis plug-in 62. Sholl-analysis was performed on total dendritic contents using 1 μm incremental increases in concentric circular diameters. The maximum number of dendritic intersections determined in each neuron was used for calculation of the mean values shown for WT and KO neurons in Figure 2B.
Staining
After fixation, slices were incubated overnight at 4°C in a 0.1 M PB buffer containing 0.1% Triton X-100 and 6% normal goat serum or normal donkey serum with antibodies. For GluA1 and PSD95 staining, slices were pre-treated with Pepsin 1mg/ml. The following antibodies were used: rabbit anti-Neuritin (Invitrogen PA5-20368), sheep anti-Noe1 (R&D System AF-4636), sheep anti-SEZ6L (R&D System AF-4804), mouse anti-PSD95 (NeuroMab 75-028), mouse anti-vGlut1 (NeuroMab 75-066). Immunoreactions were visualized by goat anti-rabbit and goat anti-mouse, or donkey anti-rabbit and donkey anti-mouse and donkey anti-sheep secondary antibodies conjugated with distinct Alexa fluorophores (488, 555 or 647). Images from the hippocampus were acquired with a N-Achroplan 5x/0.13, images from hippocampal CA1 regions were acquired with a Plan-Apochromat 40× 1.3 N.A. objective on a confocal laser-scanning microscope (LSM 710 meta, Zeiss). For higher resolution, CA1 pyramidal regions were acquired by a ZEISS LSM 880 Examiner with a Fast Airyscan 63–65 using a Plan-Apochromat 40x/1.4 Oil DIC (UV) VIS-IR. Each channel was acquired at a resolution of 43 nm/pixel in 16 bit. Fluorescence peak profiling was done as follows: First, a line was drawn through the fluorescence peak signals of a protein to be used as reference in close proximity to a putative principal dendrite using the Fiji software. Subsequently, the fluorescence signal(s) of up to two target proteins were acquired along this reference line (in distinct channels). Finally, the intensity values around the peak signals (± 172 nm) defined by the reference were averaged in all cases and used for direct comparison of co-localization between reference and target(s) (see intensity vs distance-to-peak intensity plots, Figure S6).
Electronmicroscopy (EM)
SDS-FRL immunoelectron microscopy
Immunogold labeling of freeze-fracture replicas was carried out as previously described 66. Briefly, brains of two adult wild-type (WT), two Noe1-3 knockout (TKO), 2 Noe1 KO and one Brorin KO mice were removed after perfusion fixation with 0.9% NaCl followed by a fixative containing 2% paraformaldehyde (Merck, Germany) and 15% saturated picric acid made up in 0.1 M phosphate buffer (PB). Hippocampal slices (130 μm) were cut on a vibratome (VT 1000, Leica, Vienna, Austria) and cryoprotected with 30% glycerol in 0.1M PB overnight (O/N) at 4°C. Blocks containing all layers of the CA1 area were trimmed and frozen under high-pressure (HPM 100, Leica). Frozen samples were fractured into two pieces at −140°C and coated with carbon (5 nm), platinum-carbon (2 nm) and an additional layer of carbon (18 nm) in a freeze-fracture replica machine (ACE 900, Leica). Replicas were digested for 18 h at 80°C in a solution containing 2.5% sodium dodecyl sulfate (SDS) and 20% sucrose made up in 15 mM tris buffer (TB, pH 8.3). Replicas were washed and incubated in a blocking solution (5% bovine serum albumin /BSA/, Roth, Germany). Subsequently, replicas obtained from WT, Noe1-3 TKO and Brorin KO were incubated with an anti-GluA1-4 antibody (pan-GluA AB, 3 μg/ml, epitope aa 742–798 GluA1, Synaptic Systems, Göttingen, Germany), while samples from Noe1 KO were incubated with an anti-GluN1 antibody (6 μg/ml, Frontier Institute, Hokkaido, Japan) at room temperature (RT) and, after washing, with either a 6 nm-gold-coupled (for GluA1-4) or 12-nm-gold-coupled (for GluN1) donkey anti-rabbit IgG secondary antibodies (1:30, Jackson ImmunoResearch Laboratories, PA) diluted in Tris-buffered saline (TBS) containing 1% BSA O/N at 15°C. Finally, replicas were rinsed in TBS, ultrapure water, mounted on 100-mesh grids and examined with a transmission electron microscope (JEM 2100 Plus). The anti-GluA1-4 antibody targets an extracellular epitope on GluAs, whereas the anti-GluN1 antibody targets an intracellular epitope on the receptor subunits; therefore, labeling was detected on the exoplasmic face (E-face) and protoplasmic face (P-face) of the plasma membrane, respectively. For the pan-GluA AB 1-to-1 labelling of AMPARs was shown 38.
Quantification of particle density
The density of immune-particles at synaptic (membrane characterized by a high density of intramembrane particles (IMPs) on the E-face and P-face of the membrane) and extra-synaptic membranes were calculated by dividing the absolute number of gold particles by the surface of the respective segments of the dendritic spines and dendritic shafts obtained from WT and TKO animals. For evaluation of the size of clusters, the number of particles in each cluster, defined by particles located within distances of ≤ 38 nm from each other 67, was determined.
Electrophysiology
Slice preparation
Transverse 300-μm-thick hippocampal and cerebellar slices were cut from brains of 1 to 5-month-old C57BL/6 WT and KO mice, as described 68; the total number of KO animals was 5 (TKO), 6 (Noe1 KO), 4 (DKO) and 5 (Brorin KO). Slices were cut in ice-cold sucrose-containing physiological saline using a commercial vibratome (VT1200S, Leica Microsystems). Slices were incubated at 35°C, transferred into a recording chamber, and super-fused with physiological saline at room temperature.
Patch-clamp recordings in brain slices
Patch pipettes were pulled from borosilicate glass (Hilgenberg; outer diameter, 2 mm; wall thickness, 0.5 mm for somatic recordings) and had resistances of ~2–4 MΩ when filled with internal solution. Patch pipettes were positioned using a Kleindiek micromanipulator (Kleindiek Nanotechnik, Reutlingen). Recordings were done with a Multiclamp 700B amplifier (Molecular Devices, Sunnydale). Pipette capacitance was compensated to 70%–90%. Voltage and current signals were filtered at 10 kHz with the built-in low-pass Bessel filter and digitized at 20 kHz using a Digidata 1440A (Molecular Devices, Sunnydale). pClamp10 software (Molecular Devices, Sunnydale) was used for stimulation and data acquisition. Spontaneous EPSCs (sEPSCs) and miniature EPSCs (mEPSCs) were measured at either −70 mV (AMPAR-mediated) or 40 mV (NMDAR-mediated); spontaneous IPSCs were recorded at −70 mV. All synaptic responses were analyzed with the Stimfit software using the match-template process 69.
Synaptic responses were evoked by stimulation at 0.1 Hz with a monopolar glass electrode filled with ACSF in the stratum radiatum of CA1 or the stratum lucidum of CA3. LTP was induced after recording a stable 3–5 minute baseline (but not more than 6 minutes after breaking into whole cell-mode) by a 90 s-stimulation at 2 Hz while clamping the cell at 0 mV. To ensure stable recording, membrane holding current, input resistance, and pipette series resistance were monitored throughout the recording. Six evoked EPSC responses were averaged for each stimulation intensity values. Due to the low survival rate of the TKO and Noe1 KO animals, collection of LTP data extended over a considerable period with each ‘experimental series’ comprising both knock-out and WT mice. Finally, the data from each KO animal type (TKO, Noe1 KO, DKO and Brorin KO) was pooled, as were the data determined with WT. WT and all KO animals shared the same genetic background and were matched with respect to their postnatal age. Accordingly, the same WT data were used throughout Figure 3C.
Input-output relationships were obtained by 100 and 500 μs-extracellular stimulations of variable amplitude between 100 and 1000 μA (100 μA steps) of the Schaffer collaterals. Five evoked EPSC responses were averaged for each stimulation intensity value.
Membrane potentials are given without correction for liquid junction potentials. Values given throughout the manuscript indicate mean ± SEM. Significance of differences was assessed by nonparametric Mann-Whitney U-test or Student’s T-test (as indicated in the respective figure legends).
Solutions
For dissection and storage of slices, a sucrose-containing physiological saline was used containing (in mM): 87 NaCl, 25 NaHCO3, 25 D-glucose, 75 sucrose, 2.5 KCl, 1.25 NaH2PO4, 0.5 CaCl2, and 7 MgCl2. Slices were superfused with physiological extracellular solution that contained (in mM): 125 NaCl, 25 NaHCO3, 2.5 KCl, 1.25 NaH2PO4, 1 MgCl2, 2 CaCl2, and 25 glucose (equilibrated with a 95% O2/5% CO2 gas mixture). Pipettes were filled with intracellular solution containing (in mM): 120 KMeHSO3, 20 KCl, 2 MgCl2, 2 Na2ATP, 10 HEPES, and 0.1 EGTA. For spontaneous IPSCs, pipettes were filled with (in mM) 110 KCl, 35 Kgluconate, 10 EGTA, 2 MgCl, 2 Na2ATP, 10 HEPES, and 1 mM QX-314. For sEPSCsNMDAR CNQX (50 μM, Tocris) and picrotoxin (100 μM, Tocris), for sIPSCs CNQX (50 μM, Tocris) and D-APV (50 μM, Tocris) was added to the bath solution. mEPSCs were recorded in presence of TTX (1 μM, Tocris). Hippocampal slices were kept in the respective drug for at least 30 mins prior to electrophysiological recordings.
Patch-clamp recordings in culture cells
Experimental procedures for CHO cell handling, cDNA-transfection and patch-clamp recordings in out-side configuration and solutions were as described in (Brechet et al., 2017). The piezo-driven fast application system enabled complete solution exchanges within 100 μs; current recordings were performed with an EPC10 amplifier. Data analysis was done with Igor Pro 9; time constants characterizing deactivation and desensitization processes were derived from mono- and bi-exponential fits to the decay phase of AMPAR-currents measured in response to 1- or 100-ms applications of glutamate. Data are given as mean ± SD.
QUANTIFICATION AND STATISTICAL ANALYSIS
All statistical details are indicated in the METHODS and/or in the figure legends. Data are given as means ± SEM or SD throughout the manuscript. Significance was assessed by non-parametric Mann-Whitney U-test or Student’s T-test. Significance levels are indicated (***, ** and * for p-values of < 0.001, 0.01 and 0.05, respectively).
Supplementary Material
Highlights.
Noelins1-3 are highly abundant secreted proteins expressed throughout the brain
Noelin tetramers interlink AMPARs with extracellular networks of proteins
Noelins are required for activity-dependent synaptic plasticity
Noelins are ‘universal’ anchors controlling distribution and dynamics of AMPARs
Acknowledgements
We thank the Fakler lab for helpful discussions. A. Sultana is currently at the NIH Center for Scientific Review, this work was completed while she was at the National Eye Institute.
Funding:
This work was supported by grants of the Deutsche Forschungsgemeinschaft (DFG, German Research Foundation) SFB 1381 (project-ID 403222702 to B.F), FA 332/15-1 and FA 332/16-1 (to B.F.) and by the Intramural Research Programs of the National Eye Institute, NIH (to S.T.).
Footnotes
Declaration of Interests
The authors declare no competing interests.
Publisher's Disclaimer: This is a PDF file of an unedited manuscript that has been accepted for publication. As a service to our customers we are providing this early version of the manuscript. The manuscript will undergo copyediting, typesetting, and review of the resulting proof before it is published in its final form. Please note that during the production process errors may be discovered which could affect the content, and all legal disclaimers that apply to the journal pertain.
References
- 1.Collingridge GL, Peineau S, Howland JG, and Wang YT (2010). Long-term depression in the CNS. Nat Rev Neurosci 11, 459–473. DOI: 10.1038/nrn2867. [DOI] [PubMed] [Google Scholar]
- 2.Cull-Candy S, Kelly L, and Farrant M (2006). Regulation of Ca2+-permeable AMPA receptors: synaptic plasticity and beyond. Curr Opin Neurobiol 16, 288–297. DOI: 10.1016/j.conb.2006.05.012. [DOI] [PubMed] [Google Scholar]
- 3.Greger IH, Watson JF, and Cull-Candy SG (2017). Structural and Functional Architecture of AMPA-Type Glutamate Receptors and Their Auxiliary Proteins. Neuron 94, 713–730. DOI: 10.1016/j.neuron.2017.04.009. [DOI] [PubMed] [Google Scholar]
- 4.Traynelis SF, Wollmuth LP, McBain CJ, Menniti FS, Vance KM, Ogden KK, Hansen KB, Yuan H, Myers SJ, and Dingledine R (2010). Glutamate receptor ion channels: structure, regulation, and function. Pharmacol Rev 62, 405–496. DOI: 10.1124/pr.109.002451. [DOI] [PMC free article] [PubMed] [Google Scholar]
- 5.Herguedas B, Watson JF, Ho H, Cais O, Garcia-Nafria J, and Greger IH (2019). Architecture of the heteromeric GluA1/2 AMPA receptor in complex with the auxiliary subunit TARP gamma8. Science 364. DOI: 10.1126/science.aav9011. [DOI] [PMC free article] [PubMed] [Google Scholar]
- 6.Nakagawa T (2019). Structures of the AMPA receptor in complex with its auxiliary subunit cornichon. Science 366, 1259–1263. DOI: 10.1126/science.aay2783. [DOI] [PMC free article] [PubMed] [Google Scholar]
- 7.Schwenk J, Harmel N, Brechet A, Zolles G, Berkefeld H, Muller CS, Bildl W, Baehrens D, Huber B, Kulik A, et al. (2012). High-resolution proteomics unravel architecture and molecular diversity of native AMPA receptor complexes. Neuron 74, 621–633. DOI: 10.1016/j.neuron.2012.03.034. [DOI] [PubMed] [Google Scholar]
- 8.Schwenk J, Harmel N, Zolles G, Bildl W, Kulik A, Heimrich B, Chisaka O, Jonas P, Schulte U, Fakler B, and Klocker N (2009). Functional proteomics identify cornichon proteins as auxiliary subunits of AMPA receptors. Science 323, 1313–1319. DOI: 10.1126/science.1167852. [DOI] [PubMed] [Google Scholar]
- 9.Shanks NF, Savas JN, Maruo T, Cais O, Hirao A, Oe S, Ghosh A, Noda Y, Greger IH, Yates JR 3rd, and Nakagawa T (2012). Differences in AMPA and kainate receptor interactomes facilitate identification of AMPA receptor auxiliary subunit GSG1L. Cell Rep 1, 590–598. DOI: 10.1016/j.celrep.2012.05.004. [DOI] [PMC free article] [PubMed] [Google Scholar]
- 10.von Engelhardt J, Mack V, Sprengel R, Kavenstock N, Li KW, Stern-Bach Y, Smit AB, Seeburg PH, and Monyer H (2010). CKAMP44: a brain-specific protein attenuating short-term synaptic plasticity in the dentate gyrus. Science 327, 1518–1522. DOI: 10.1126/science.1184178. [DOI] [PubMed] [Google Scholar]
- 11.Zhao Y, Chen S, Swensen AC, Qian WJ, and Gouaux E (2019). Architecture and subunit arrangement of native AMPA receptors elucidated by cryo-EM. Science 364, 355–362. DOI: 10.1126/science.aaw8250. [DOI] [PMC free article] [PubMed] [Google Scholar]
- 12.Bliss TV, and Collingridge GL (1993). A synaptic model of memory: long-term potentiation in the hippocampus. Nature 361, 31–39. DOI: 10.1038/361031a0. [DOI] [PubMed] [Google Scholar]
- 13.Huganir RL, and Nicoll RA (2013). AMPARs and synaptic plasticity: the last 25 years. Neuron 80, 704–717. DOI: 10.1016/j.neuron.2013.10.025. [DOI] [PMC free article] [PubMed] [Google Scholar]
- 14.Schwenk J, and Fakler B (2020). Building of AMPA-type glutamate receptors in the endoplasmic reticulum and its implication for excitatory neurotransmission. J Physiol 599, 2639–2653. DOI: 10.1113/JP279025. [DOI] [PubMed] [Google Scholar]
- 15.Schwenk J, Boudkkazi S, Kocylowski MK, Brechet A, Zolles G, Bus T, Costa K, Kollewe A, Jordan J, Bank J, et al. (2019). An ER Assembly Line of AMPA-Receptors Controls Excitatory Neurotransmission and Its Plasticity. Neuron 104, 680–692. DOI: 10.1016/j.neuron.2019.08.033. [DOI] [PubMed] [Google Scholar]
- 16.Opazo P, Sainlos M, and Choquet D (2012). Regulation of AMPA receptor surface diffusion by PSD-95 slots. Curr Opin Neurobiol 22, 453–460. DOI: 10.1016/j.conb.2011.10.010. [DOI] [PubMed] [Google Scholar]
- 17.Schnell E, Sizemore M, Karimzadegan S, Chen L, Bredt DS, and Nicoll RA (2002). Direct interactions between PSD-95 and stargazin control synaptic AMPA receptor number. Proc Natl Acad Sci U S A 99, 13902–13907. DOI: 10.1073/pnas.172511199. [DOI] [PMC free article] [PubMed] [Google Scholar]
- 18.Sumioka A, Brown TE, Kato AS, Bredt DS, Kauer JA, and Tomita S (2011). PDZ binding of TARPgamma-8 controls synaptic transmission but not synaptic plasticity. Nat Neurosci 14, 1410–1412. DOI: 10.1038/nn.2952. [DOI] [PMC free article] [PubMed] [Google Scholar]
- 19.Watson JF, Pinggera A, Ho H, and Greger IH (2021). AMPA receptor anchoring at CA1 synapses is determined by N-terminal domain and TARP gamma8 interactions. Nat Commun 12, 5083. DOI: 10.1038/s41467-021-25281-4. [DOI] [PMC free article] [PubMed] [Google Scholar]
- 20.Park J, Chavez AE, Mineur YS, Morimoto-Tomita M, Lutzu S, Kim KS, Picciotto MR, Castillo PE, and Tomita S (2016). CaMKII Phosphorylation of TARPgamma-8 Is a Mediator of LTP and Learning and Memory. Neuron 92, 75–83. DOI: 10.1016/j.neuron.2016.09.002. [DOI] [PMC free article] [PubMed] [Google Scholar]
- 21.Tomita S, Stein V, Stocker TJ, Nicoll RA, and Bredt DS (2005). Bidirectional synaptic plasticity regulated by phosphorylation of stargazin-like TARPs. Neuron 45, 269–277. DOI: 10.1016/j.neuron.2005.01.009. [DOI] [PubMed] [Google Scholar]
- 22.Lee SJ, Wei M, Zhang C, Maxeiner S, Pak C, Calado Botelho S, Trotter J, Sterky FH, and Sudhof TC (2017). Presynaptic Neuronal Pentraxin Receptor Organizes Excitatory and Inhibitory Synapses. J Neurosci 37, 1062–1080. DOI: 10.1523/JNEUROSCI.2768-16.2016. [DOI] [PMC free article] [PubMed] [Google Scholar]
- 23.Pelkey KA, Barksdale E, Craig MT, Yuan X, Sukumaran M, Vargish GA, Mitchell RM, Wyeth MS, Petralia RS, Chittajallu R, et al. (2015). Pentraxins coordinate excitatory synapse maturation and circuit integration of parvalbumin interneurons. Neuron 85, 1257–1272. DOI: 10.1016/j.neuron.2015.02.020. [DOI] [PMC free article] [PubMed] [Google Scholar]
- 24.Sia GM, Beique JC, Rumbaugh G, Cho R, Worley PF, and Huganir RL (2007). Interaction of the N-terminal domain of the AMPA receptor GluR4 subunit with the neuronal pentraxin NP1 mediates GluR4 synaptic recruitment. Neuron 55, 87–102. DOI: 10.1016/j.neuron.2007.06.020. [DOI] [PubMed] [Google Scholar]
- 25.Suzuki K, Elegheert J, Song I, Sasakura H, Senkov O, Matsuda K, Kakegawa W, Clayton AJ, Chang VT, Ferrer-Ferrer M, et al. (2020). A synthetic synaptic organizer protein restores glutamatergic neuronal circuits. Science 369, eabb4853 DOI: 10.1126/science.abb4853. [DOI] [PMC free article] [PubMed] [Google Scholar]
- 26.Diaz-Alonso J, and Nicoll RA (2021). AMPA receptor trafficking and LTP: Carboxy-termini, amino-termini and TARPs. Neuropharmacology 197, 108710. DOI: 10.1016/j.neuropharm.2021.108710. [DOI] [PMC free article] [PubMed] [Google Scholar]
- 27.Tomarev SI, and Nakaya N (2009). Olfactomedin domain-containing proteins: possible mechanisms of action and functions in normal development and pathology. Mol Neurobiol 40, 122–138. DOI: 10.1007/s12035-009-8076-x. [DOI] [PMC free article] [PubMed] [Google Scholar]
- 28.Fujino T, Wu Z, Lin WC, Phillips MA, and Nedivi E (2008). cpg15 and cpg15-2 constitute a family of activity-regulated ligands expressed differentially in the nervous system to promote neurite growth and neuronal survival. J Comp Neurol 507, 1831–1845. DOI: 10.1002/cne.21649. [DOI] [PMC free article] [PubMed] [Google Scholar]
- 29.Nedivi E, Wu GY, and Cline HT (1998). Promotion of dendritic growth by CPG15, an activity-induced signaling molecule. Science 281, 1863–1866. DOI: 10.1126/science.281.5384.1863. [DOI] [PMC free article] [PubMed] [Google Scholar]
- 30.Subramanian J, Michel K, Benoit M, and Nedivi E (2019). CPG15/Neuritin Mimics Experience in Selecting Excitatory Synapses for Stabilization by Facilitating PSD95 Recruitment. Cell Rep 28, 1584–1595. DOI: 10.1016/j.celrep.2019.07.012. [DOI] [PMC free article] [PubMed] [Google Scholar]
- 31.Schwenk J, Baehrens D, Haupt A, Bildl W, Boudkkazi S, Roeper J, Fakler B, and Schulte U (2014). Regional diversity and developmental dynamics of the AMPA-receptor proteome in the mammalian brain. Neuron 84, 41–54. DOI: 10.1016/j.neuron.2014.08.044. [DOI] [PubMed] [Google Scholar]
- 32.Pronker MF, Bos TG, Sharp TH, Thies-Weesie DM, and Janssen BJ (2015). Olfactomedin-1 Has a V-shaped Disulfide-linked Tetrameric Structure. J Biol Chem 290, 15092–15101. DOI: 10.1074/jbc.M115.653485. [DOI] [PMC free article] [PubMed] [Google Scholar]
- 33.Schmidt N, Kollewe A, Constantin CE, Henrich S, Ritzau-Jost A, Bildl W, Saalbach A, Hallermann S, Kulik A, Fakler B, and Schulte U (2017). Neuroplastin and Basigin Are Essential Auxiliary Subunits of Plasma Membrane Ca2+-ATPases and Key Regulators of Ca2+ Clearance. Neuron 96, 827–838. DOI: 10.1016/j.neuron.2017.09.038. [DOI] [PubMed] [Google Scholar]
- 34.Schwenk J, Perez-Garci E, Schneider A, Kollewe A, Gauthier-Kemper A, Fritzius T, Raveh A, Dinamarca MC, Hanuschkin A, Bildl W, et al. (2016). Modular composition and dynamics of native GABAB receptors identified by high-resolution proteomics. Nat Neurosci 19, 233–242. DOI: 10.1038/nn.4198. [DOI] [PubMed] [Google Scholar]
- 35.Chen L, Chetkovich DM, Petralia RS, Sweeney NT, Kawasaki Y, Wenthold RJ, Bredt DS, and Nicoll RA (2000). Stargazin regulates synaptic targeting of AMPA receptors by two distinct mechanisms. Nature 408, 936–943. DOI: 10.1038/35050030. [DOI] [PubMed] [Google Scholar]
- 36.Tomita S, Adesnik H, Sekiguchi M, Zhang W, Wada K, Howe JR, Nicoll RA, and Bredt DS (2005). Stargazin modulates AMPA receptor gating and trafficking by distinct domains. Nature 435, 1052–1058. DOI: 10.1038/nature03624. [DOI] [PubMed] [Google Scholar]
- 37.Saunders A, Macosko EZ, Wysoker A, Goldman M, Krienen FM, de Rivera H, Bien E, Baum M, Bortolin L, Wang S, et al. (2018). Molecular Diversity and Specializations among the Cells of the Adult Mouse Brain. Cell 174, 1015–1030. DOI: 10.1016/j.cell.2018.07.028. [DOI] [PMC free article] [PubMed] [Google Scholar]
- 38.Tanaka J, Matsuzaki M, Tarusawa E, Momiyama A, Molnar E, Kasai H, and Shigemoto R (2005). Number and density of AMPA receptors in single synapses in immature cerebellum. J Neurosci 25, 799–807. DOI: 10.1523/JNEUROSCI.4256-04.2005. [DOI] [PMC free article] [PubMed] [Google Scholar]
- 39.Zutshi I, Valero M, Fernandez-Ruiz A, and Buzsaki G (2022). Extrinsic control and intrinsic computation in the hippocampal CA1 circuit. Neuron 110, 658–673. DOI: 10.1016/j.neuron.2021.11.015. [DOI] [PMC free article] [PubMed] [Google Scholar]
- 40.Nash A, Aumann TD, Pigoni M, Lichtenthaler SF, Takeshima H, Munro KM, and Gunnersen JM (2020). Lack of Sez6 Family Proteins Impairs Motor Functions, Short-Term Memory, and Cognitive Flexibility and Alters Dendritic Spine Properties. Cereb Cortex 30, 2167–2184. DOI: 10.1093/cercor/bhz230. [DOI] [PubMed] [Google Scholar]
- 41.Sudhof TC (2017). Synaptic Neurexin Complexes: A Molecular Code for the Logic of Neural Circuits. Cell 171, 745–769. DOI: 10.1016/j.cell.2017.10.024. [DOI] [PMC free article] [PubMed] [Google Scholar]
- 42.Senior AW, Evans R, Jumper J, Kirkpatrick J, Sifre L, Green T, Qin C, Zidek A, Nelson AWR, Bridgland A, et al. (2020). Improved protein structure prediction using potentials from deep learning. Nature 577, 706–710. DOI: 10.1038/s41586-019-1923-7. [DOI] [PubMed] [Google Scholar]
- 43.Biederer T, Kaeser PS, and Blanpied TA (2017). Transcellular Nanoalignment of Synaptic Function. Neuron 96, 680–696. DOI: 10.1016/j.neuron.2017.10.006. [DOI] [PMC free article] [PubMed] [Google Scholar]
- 44.Chen F, Swartzlander DB, Ghosh A, Fryer JD, Wang B, and Zheng H (2021). Clusterin secreted from astrocyte promotes excitatory synaptic transmission and ameliorates Alzheimer’s disease neuropathology. Mol Neurodegener 16, 5. DOI: 10.1186/s13024-021-00426-7. [DOI] [PMC free article] [PubMed] [Google Scholar]
- 45.Giddens MM, Wong JC, Schroeder JP, Farrow EG, Smith BM, Owino S, Soden SE, Meyer RC, Saunders C, LePichon JB, et al. (2017). GPR37L1 modulates seizure susceptibility: Evidence from mouse studies and analyses of a human GPR37L1 variant. Neurobiol Dis 106, 181–190. DOI: 10.1016/j.nbd.2017.07.006. [DOI] [PMC free article] [PubMed] [Google Scholar]
- 46.Kim HR, Kim DH, An JY, Kang D, Park JW, Hwang EM, Seo EJ, Jang IH, Ha CM, and Lee BJ (2020). NELL2 Function in Axon Development of Hippocampal Neurons. Mol Cells 43, 581–589. DOI: 10.14348/molcells.2020.0032. [DOI] [PMC free article] [PubMed] [Google Scholar]
- 47.Matsuyama S, Doe N, Kurihara N, Tanizawa K, Kuroda S, Iso H, and Horie M (2005). Spatial learning of mice lacking a neuron-specific epidermal growth factor family protein, NELL2. J Pharmacol Sci 98, 239–243. DOI: 10.1254/jphs.fp0050211. [DOI] [PubMed] [Google Scholar]
- 48.Nojima K, Miyazaki H, Hori T, Vargova L, and Oohashi T (2021). Assessment of Possible Contributions of Hyaluronan and Proteoglycan Binding Link Protein 4 to Differential Perineuronal Net Formation at the Calyx of Held. Front Cell Dev Biol 9, 730550. DOI: 10.3389/fcell.2021.730550. [DOI] [PMC free article] [PubMed] [Google Scholar]
- 49.Ong-Palsson E, Njavro JR, Wilson Y, Pigoni M, Schmidt A, Muller SA, Meyer M, Hartmann J, Busche MA, Gunnersen JM, et al. (2022). The beta-Secretase Substrate Seizure 6-Like Protein (SEZ6L) Controls Motor Functions in Mice. Mol Neurobiol 59, 1183–1198. DOI: 10.1007/s12035-021-02660-y. [DOI] [PMC free article] [PubMed] [Google Scholar]
- 50.Pandya NJ, Seeger C, Babai N, Gonzalez-Lozano MA, Mack V, Lodder JC, Gouwenberg Y, Mansvelder HD, Danielson UH, Li KW, et al. (2018). Noelin1 Affects Lateral Mobility of Synaptic AMPA Receptors. Cell Rep 24, 1218–1230. DOI: 10.1016/j.celrep.2018.06.102. [DOI] [PMC free article] [PubMed] [Google Scholar]
- 51.Carroll RC, Beattie EC, von Zastrow M, and Malenka RC (2001). Role of AMPA receptor endocytosis in synaptic plasticity. Nat Rev Neurosci 2, 315–324. DOI: 10.1038/35072500. [DOI] [PubMed] [Google Scholar]
- 52.Choquet D (2018). Linking Nanoscale Dynamics of AMPA Receptor Organization to Plasticity of Excitatory Synapses and Learning. J Neurosci 38, 9318–9329. DOI: 10.1523/JNEUROSCI.2119-18.2018. [DOI] [PMC free article] [PubMed] [Google Scholar]
- 53.Tsien RY (2013). Very long-term memories may be stored in the pattern of holes in the perineuronal net. Proc Natl Acad Sci USA 110, 12456–12461. DOI: 10.1073/pnas.1310158110. [DOI] [PMC free article] [PubMed] [Google Scholar]
- 54.Sultana A, Nakaya N, Dong L, Abu-Asab M, Qian H, and Tomarev SI (2014). Deletion of olfactomedin 2 induces changes in the AMPA receptor complex and impairs visual, olfactory, and motor functions in mice. Exp Neurol 261, 802–811. DOI: 10.1016/j.expneurol.2014.09.002. [DOI] [PMC free article] [PubMed] [Google Scholar]
- 55.Watson JF, Ho H, and Greger IH (2017). Synaptic transmission and plasticity require AMPA receptor anchoring via its N-terminal domain. Elife 6. DOI: 10.7554/eLife.23024. [DOI] [PMC free article] [PubMed] [Google Scholar]
- 56.Brown PH, and Schuck P (2006). Macromolecular size-and-shape distributions by sedimentation velocity analytical ultracentrifugation. Biophys J 90, 4651–4661. DOI: 10.1529/biophysj.106.081372. [DOI] [PMC free article] [PubMed] [Google Scholar]
- 57.Nakaya N, Sultana A, Lee HS, and Tomarev SI (2012). Olfactomedin 1 interacts with the Nogo A receptor complex to regulate axon growth. J Biol Chem 287, 37171–37184. DOI: 10.1074/jbc.M112.389916. [DOI] [PMC free article] [PubMed] [Google Scholar]
- 58.Pandey A, Andersen JS, and Mann M (2000). Use of mass spectrometry to study signaling pathways. Sci STKE 2000, pl1. DOI: 10.1126/stke.2000.37.pl1. [DOI] [PubMed] [Google Scholar]
- 59.Kocylowski MK, Aypek H, Bildl W, Helmstädter M, Trachte P, Dumoulin B, Wittösch S, Kühne L, Aukschun U, O., K., et al. (2022). A slit-diaphragm-associated protein network for dynamic control of renal filtration. Nature Communications 13, 6446. DOI: 10.1038/s41467-022-33748-1. [DOI] [PMC free article] [PubMed] [Google Scholar]
- 60.Bildl W, Haupt A, Muller CS, Biniossek ML, Thumfart JO, Huber B, Fakler B, and Schulte U (2012). Extending the dynamic range of label-free mass spectrometric quantification of affinity purifications. Mol Cell Proteomics 11, M111 007955. DOI: 10.1074/mcp.M111.007955. [DOI] [PMC free article] [PubMed] [Google Scholar]
- 61.Cox J, Hein MY, Luber CA, Paron I, Nagaraj N, and Mann M (2014). Accurate proteome-wide label-free quantification by delayed normalization and maximal peptide ratio extraction, termed MaxLFQ. Mol Cell Proteomics 13, 2513–2526. DOI: 10.1074/mcp.M113.031591. [DOI] [PMC free article] [PubMed] [Google Scholar]
- 62.Ferreira TA, Blackman AV, Oyrer J, Jayabal S, Chung AJ, Watt AJ, Sjostrom PJ, and van Meyel DJ (2014). Neuronal morphometry directly from bitmap images. Nat Methods 11, 982–984. DOI: 10.1038/nmeth.3125.. [DOI] [PMC free article] [PubMed] [Google Scholar]
- 63.Huff J, Bathe W, Netz R, Anhut T, and Weissenhart K (2015). The Airyscan Detector from ZEISS Confocal Imaging with Improved Signal-to-Noise Ratio and Superresolution. Nat Methods 12, i–ii. [Google Scholar]
- 64.Huff J, Kleppe I, Naumann A, and Nitschke R (2018). Airyscan detection in multiphoton microscopy: super-resolution in improved signal-to-noise ratio beyond the confocal depth. Nat Methods d42473-018-00102-3. [Google Scholar]
- 65.Wu X, and Hammer JA (2021). ZEISS Airyscan: Optimizing Usage for Fast, Gentle, Super-Resolution Imaging. Methods Mol Biol 2304, 111–130. DOI: 10.1007/978-1-0716-1402-0_5. [DOI] [PMC free article] [PubMed] [Google Scholar]
- 66.Booker SA, Harada H, Elgueta C, Bank J, Bartos M, Kulik A, and Vida I (2020). Presynaptic GABAB receptors functionally uncouple somatostatin interneurons from the active hippocampal network. Elife 9. DOI: 10.7554/eLife.51156. [DOI] [PMC free article] [PubMed] [Google Scholar]
- 67.Althof D, Baehrens D, Watanabe M, Suzuki N, Fakler B, and Kulik A (2015). Inhibitory and excitatory axon terminals share a common nano-architecture of their Cav2.1 (P/Q-type) Ca2+ channels. Front Cell Neurosci 9, 315. DOI: 10.3389/fncel.2015.00315. [DOI] [PMC free article] [PubMed] [Google Scholar]
- 68.Boudkkazi S, Brechet A, Schwenk J, and Fakler B (2014). Cornichon2 dictates the time course of excitatory transmission at individual hippocampal synapses. Neuron 82, 848–858. DOI: 10.1016/j.neuron.2014.03.031. [DOI] [PubMed] [Google Scholar]
- 69.Guzman SJ, Schlogl A, and Schmidt-Hieber C (2014). Stimfit: quantifying electrophysiological data with Python. Front Neuroinform 8, 16. DOI: 10.3389/fninf.2014.00016. [DOI] [PMC free article] [PubMed] [Google Scholar]
Associated Data
This section collects any data citations, data availability statements, or supplementary materials included in this article.
Supplementary Materials
Data Availability Statement
The mass spectrometry proteomics data have been deposited to the ProteomeXchange Consortium via the PRIDE partner repository with the dataset identifier PXD041655 and 10.6019/PXD041655 and are publicly available as of the date of publication.
This paper does not report original code.
Any additional information required to reanalyze the data reported in this paper is available from the lead contact upon request.