

Abstract
Background
While the literature suggests a correlation between posterior tibial slope and sagittal stability of the knee, there is a lack of consensus relating to how to measure the slope, what a normal slope value would be, and which critical values should guide extra surgical treatment.
We performed a systematic literature review looking at the posterior tibial slope and cruciate ligament surgery. Our aims were to define a gold standard measurement technique of posterior tibial slope, as well as determining its normal range and the important values for consideration of adjuncts during cruciate ligament surgery.
Methods
Electronic searches of MEDLINE (PubMed), CINAHL, Cochrane, Embase, ScienceDirect, and NICE in June 2020 were completed. Inclusion criteria were original studies in peer-reviewed English language journals. A quality assessment of included studies was completed using the Methodological Index for Non-Randomized Studies (MINORS) Criteria.
Results
Two-hundred and twenty-one papers were identified; following exclusions 34 papers were included for data collection. The mean MINORS score was 13.8 for non-comparative studies and 20.4 for comparative studies, both indicating fair to good quality studies. A large variation in the posterior tibial slope measurement technique was identified, resulting in a wide range of values reported. A significant variation in slope value also existed between different races, ages and genders.
Conclusion
Cautiously, the authors suggest a normal range of 6-12º, using the proximal tibial axis at 5 and 15 cms below the joint. We suggest 12º as a cut-off value for slope-reducing osteotomy as an adjunct to revision ligament reconstruction.
Keywords: ACL, Knee, Ligament, Tibia
Introduction
Anterior cruciate ligament (ACL) rupture is a common injury [1], with risk factors for initial injury and success of reconstruction known to be multi-factorial [2, 3]. These include patient age, sex, graft choice, graft size, fixation method, tunnel position, femoral notch diameter, activity level and rehabilitation. Knowledge of modifiable factors is essential for the provision of high-quality treatment.
There has been growing interest recently in the association of posterior tibial slope (PTS) and sagittal stability of the knee. PTS is defined as the angle between the line perpendicular to the tibial axis and the posterior inclination of the tibial plateau. However, controversy surrounds how to measure PTS, what imaging modality to use and what landmarks of the tibial plateau are measured [4, 5] PTS can also be influenced by ethnicity, sex, age, tibial rotation and the presence of osteoarthritis [6–9].
Several authors have reported increased PTS as a risk factor for non-contact ACL rupture [10–17]. Other authors have demonstrated increased failure rates for ACL reconstruction [2, 3, 18–22]. In their long-term prospective radiograph-based study, Webb et al. described a fivefold increase in graft failure with increased PTS [2]. This has led to several authors advocating slope-reducing osteotomies in conjunction with revision ACL reconstruction [6, 23–25].
The purpose of this study was to systematically review the literature relating to PTS and anterior cruciate ligament surgery. The study is required to address the lack of consensus in the literature relating to various facets of PTS, which makes assessment, communication and treatment challenging.
The aims of this study were firstly to define a gold standard measurement technique, secondly to determine “normal” ranges for PTS and thirdly to determine a maximum PTS value, above which corrective osteotomy should be considered.
Materials and Methods
Literature Search
A systematic search was performed following the PRISMA (Preferred Reporting Items for Systematic Reviews and Meta-Analyses) guidelines [25]. The literature search was performed in June 2020 using MEDLINE (PubMed), Cumulative Index to Nursing and Allied Health Literature, Cochrane, Embase, ScienceDirect, and National Institute for Health and Care Excellence evidence. The search algorithm was “posterior tibial slope” OR “posterior inferior tibial slope” OR “tibial slope” in the title, AND language was limited to English.
After duplicate removal, the title and abstract of all potential studies were screened by two reviewers (MGRB and VIM), those remaining were evaluated by the same two reviewers on the inclusion and exclusion criteria. A review of the references of each included study was undertaken to identify any additional studies of interest.
Inclusion criteria were (I) original studies, (II) published in the English language and (III) articles studying PTS in ACL injuries or treatments. Exclusion criteria were (I) abstracts without full text, (II) articles in other languages, (III) animal studies, (IV) case reports, (V) review articles, (VI) description of surgical techniques, (VII) multiple studies reporting on the same cohort of patients and (VIII) articles of poor quality. Article quality was assessed using the MINORS criteria, with scores less than 8 for non-comparative studies or less than 12 for comparative studies not included.
Quality Assessment of Included Studies
A quality assessment of included studies was completed using the Methodological Index for Non-Randomized Studies (MINORS) criteria [26]. MINORS is a validated scoring tool for nonrandomized studies. Twelve items are given scores of 0 for not reported, 1 for reported but inadequately and 2 if reported adequately. This produces a maximum score of 16 for noncomparative and 24 for comparative studies. Two authors (MGRB and VIM) performed MINORS scoring independently, and discrepancies were resolved by discussion until agreement on score. The level of evidence of all included papers was recorded.
Data Extraction
All data was collected using Microsoft Excel (Microsoft Corp., Redmond, WA, USA). A review template was developed to aid data collection. Baseline information for each article was recorded including, authors name, year of publication, journal of publication, study type and level of evidence. Specific data extracted for the review included methods of PTS measurement, imaging modality, patient demographics, number of subjects, mean values, ranges, number of subjects, population characteristics if any comparison was used and the presence of disease within the studied knees.
Statistical Analysis
All statistical analysis was performed using Microsoft Excel and p-values of 0.05 were considered significant. Information was presented in tablet form, with simple statistical analysis such as mean and range calculations performed.
Results
Literature Search
Two hundred and twenty-one articles were returned during the initial search. There were twelve duplicate studies. The remaining 209 abstracts were screened for eligibility and a further 155 articles were excluded. The full text of 54 articles was reviewed by the two observers in accordance with the described inclusion and exclusion criteria. These studies were evaluated for eligibility if a direct measure of PTS was undertaken; in total 33 studies were included for analysis (Fig. 1). Eleven papers were excluded since they were review articles, 6 were deemed to be of low quality, 3 described interventions and 1 paper was published in French with and English abstract. Finally, the references of all included studies were reviewed, and no other potential studies were identified for inclusion.
Fig. 1.

PRISMA Flow diagram of studies’ screening and selection
Study Quality
Included papers were assessed using the MINORS criteria (Table 1). The mean score was 13.8 (range 12–16) for non-comparative studies and 20.4 [17–23] for comparative studies, both indicating fair to good quality studies. Thirty of the papers included were level 3 evidence and one paper was level 2 evidence.
Table 1.
Quality assessment of all included articles using MINORS criteria
| Author | Year | Journal | Evidence | Study design | MINORS Score |
|---|---|---|---|---|---|
| B Beynnon et al. [4] | 2014 | Am J Sports Med | III | Case–control | 22 (C) |
| S Bisicchia et al. [5] | 2017 | J Orth Traumatol | III | Cross sectional | 15 (NC) |
| M Brandon et al. [6] | 2006 | Arthroscopy | III | Case–control | 17 (C) |
| J Christensen et al. [7] | 2015 | Am J Sports Med | III | Case–control | 20 (C) |
| D Dare et al. [8] | 2015 | AM J Sports Med | III | Case–control | 23 (C) |
| H Dejour et al. [10] | 1994 | JBJS (Br) | III | Cross sectional | 12 (NC) |
| N DePhillipo et al. [11] | 2018 | Am J Sports Med | III | Case–control | 21 (C) |
| M. Faschingbauer et al. [13] | 2014 | KSSTA | III | Cross sectional | 14 (NC) |
| A Grassi et al. [15] | 2019 | Arthroscopy | III | Case–control | 22 (C) |
| H Han et al. [16] | 2008 | KSSTA | III | Cross sectional | 12 (NC) |
| J Hashemi et al. [17] | 2008 | JBJS | III | Cross sectional | 23 (C) |
| J Ho et al. [18] | 2017 | J Arthroplasty | III | Cross sectional | 15 (NC) |
| R Hudek et al. [19] | 2009 | Clin Orthop Relat Res | III | Cross sectional | 14 (NC) |
| V Jaecker et al. [20] | 2018 | Arch Orthop Trauma Surg | III | Case–control | 22 (C) |
| E Karimi et al. [22] | 2017 | ABJS | III | Cross sectional | 15 (NC) |
| M Khan et al. [23] | 2011 | Int J Orthop | III | Case–control | 22 (C) |
| A Kiapour et al. [24] | 2019 | Am J Sports Med | II | Cohort | 15 (NC) |
| V Kızılgoz et al. [26] | 2019 | Radiography | III | Case–control | 21 (C) |
| C Lee et al. [27] | 2018 | Arthroscopy | III | Case–control | 20 (C) |
| Y Li et al. [28] | 2014 | Am J Sports Med | III | Cross sectional | 12 (NC) |
| M O’Malley et al. [31] | 2014 | Arthroscopy | III | Case–control | 22 (C) |
| C Pangaud et al. [32] | 2020 | Orthop J Sports Med | III | Cross sectional | 16 (NC) |
| L Stijak et al. [39] | 2008 | KSSTA | III | Case–control | 20 (C) |
| A Su et al. [40] | 2018 | J Knee Surg | III | Case–control | 23 (C) |
| S Utzschneider et al. [42] | 2011 | KSSTA | Cadaveric | 14 (NC) | |
| C Wahl et al. [43] | 2012 | JBJS | III | Cross sectional | 21 (C) |
| J Webb et al. [45] | 2013 | AM J Sports Med | III | Case–control | 16 (NC) |
| D Weinberg et al. [46] | 2016 | Am J Sports Med | Cadaveric | 13 (NC) | |
| J Yoo et al. [47] | 2008 | J Arthroplasty | III | Cross sectional | 13 (NC) |
| K Yoon et al. [48] | 2020 | Arthroscopy | III | Cross sectional | 12 (NC) |
| C Zeng et al. [49] | 2014 | KSSTA | III | Case–control | 23 (C) |
| Y Zhang et al. [50] | 2018 | Knee | III | Cross sectional | 13 (NC) |
| Y Zhang et al. [51] | 2014 | Medicine | III | Cross sectional | 15 (NC) |
C Comparative study and NC Non-comparative study
‘Normal Values’ for Posterior Tibial Slope
Thirty-one of the 33 studies reported values for PTS in ‘healthy’ patients. Data from these papers were extracted and is shown in Table 2. Three papers compared imaging modalities [19, 42]. All other studies described results for a single imaging modality. In total 5,562 images from 5277 “healthy” knees were measured with a mean PTS across all imaging modalities of 7.2º ( – 8 to 17º).
Table 2.
Values of PTS depending on the imaging modality studied
| Xray | CT | MRI | |
|---|---|---|---|
| No. studies | 14 | 7 | 14 |
| No. patients | 2172 | 2410 | 980 |
| Min (degrees) | 1 | – 8 | – 6 |
| Max (degrees) | 21 | 17 | 14.5 |
| Mean (degrees) | 8.8 | 6.6 | 4.9 |
Description of Methods of PTS Measurement
PTS is an angle between a line drawn on the tibial plateau and a line drawn at 90 degrees to the tibial axis, Fig. 2. The tibial plateau line is relatively easy to draw, irrespective of the imaging modalities. However, the landmarks for the longitudinal tibial axis can vary significantly depending on imaging modality.
Fig. 2.

Measurement of posterior tibial slope using mechanical axis on a lateral radiograph
Variants Used to Measure Longitudinal Tibial Axes
There was significant variation in the longitudinal axes used to calculate PTS. Five different axes were noted; the anterior tibial cortex (ATC), posterior tibial cortex (PTC), fibular shaft axis (FSA), central tibial axis (CTA) and proximal tibial axis (PTA) [4, 27], A description is provided in Table 3 as well as a pictural reference in Fig. 3. Depending on which of these axes is chosen, the measurement of PTS can differ by more than 5º [4, 28]. Yoo et al. used lateral radiographs of the whole tibia to compare these different axes to the mechanical axis. They demonstrated that the proximal tibial axis was the closest with a mean slope of 10.8º compared to 10.6º [27].
Table 3.
Variants used to measure longitudinal tibial axes
| Variant name | Brief description of the axis |
|---|---|
| Mechanical axis | Line drawn down the mechanical axis of the tibia |
| Anterior tibial cortex | Line drawn down anterior tibia distal to the tibial tuberosity |
| Posterior tibial cortex | Line drawn down posterior tibia distal to the tibial tuberosity |
| Proximal tibial axis | Line drawn between mid-point of the tibia at the level of the tibial tubercle as well as point 10 cm distal to this |
| Central tibial axis | Line centred around the midpoint of tibial medulla extending to the midpoint of the medullary canal at approximately ¼ and ¾ of the length of the bone |
| Fibula shaft axis | Line drawn down the length of fibula shaft |
Fig. 3.

Different tibial axes, MA Mechanical Axis, ATC Anterior Tibial Axis, PTC Posterior Tibial Axis, PTA Proximal Tibial Axis, CTA Central Tibial Axis and FSA Fibular Shaft Axis
Dejour described a method [29]. By marking the mid-point of the tibia at the level of the tibial tubercle as well as 10 cm distal to this, the two points are then connected to give the axis. This roughly correlates to 2 central points 5 and 15 cm [5], and is one of the most common interpretations of PTA as per our review [3, 9, 12, 13, 19, 33].
Various techniques have been described to define the PTA on MRI scans. Hudek et al. described a method utilising the centre of two circles in the proximal tibia to define the PTA. The proximal circle touches the joint surface, anterior and posterior cortices. The distal circle touches the anterior and posterior cortices with centre placed on the circumference of the proximal circle [30], Fig. 4.
Fig. 4.

Hudek’s technique for axis calculation with medial and lateral PTS measurement
Hudek et al. described the PTS on MRI measuring on average 3.4º less than lateral radiographs [34] Fig. 5 demonstrates this difference, by comparing Hudek’s et al. method to Dejour’s method of measuring proximal tibial axis using two landmarks at approximately 5 and 15 cm distal to the joint on an MRI.
Fig. 5.
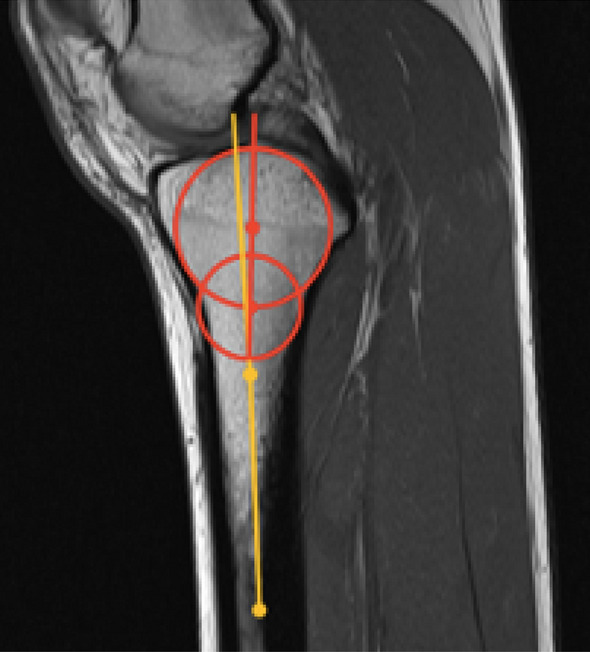
Sagittal MRI comparing Hudek’s technique and a method using two landmarks at approximately 5 and 15 cm distal to the joint to calculate the proximal tibial axis
Rotation
Several authors have demonstrated that rotation of the tibia increases PTS measurement on lateral radiographs; Weinberg demonstrated an increase of 1–2º with 10º of axial rotation in either direction [8] and Utzschneider et al. showed an increase of up to 3º with both 40º internal and external rotation [31].
Ethnic Origin, Sex and Age
The geometry of the proximal tibia and subsequently degree of PTS can be influenced by a series of genetic and environmental factors, such as ethnic origin, sex and age [5, 28]. Pangaud’s CT-based study demonstrated significantly higher mean PTS and medial PTS (1.9º and 3.2º higher, respectively) in Asian patients compared to Caucasian patients. There was no difference in lateral PTS slope. Weinberg’s CT study of over 1000 cadavers [8]. Demonstrated both a higher medial (2.9º) and lateral (2.1º) PTS in Black patients compared to Caucasian patients. This was repeated by Bisicchia’s study demonstrating on lateral radiographs that Black patients had on average a 2.5º greater PTS compared to Caucasians [7]. However, differences in slope and ethnicity do not necessarily correspond directly to an injury, with one paper reporting six times the rate of ACL rupture in white female athletes compared to non-white [32]. This corresponds with the original statement that the pathophysiology of cruciate injury is multifactorial.
Pangaud reported a higher mean PTS in men compared to women [6]. This was contrasted by the work of Weinberg, who reported a lower mean PTS in men (6.8º compared to 7.5º) [8]. Bisicchia et al. noted in their White population there was a tendency for women to have higher PTS, as opposed to men having higher PTS amongst their Black patients [7]. This variation in the literature makes it difficult to attribute any reliable relationships between PTS, sex and ethnic origin.
The tibial slope is known to flatten as adolescents approach skeletal maturity, Dare et al. describe the PTS decreasing by between 0.3 and 0.4º per year in children [12]. In the elderly, it is universally accepted that the presence of degenerative changes increases radiological PTS [6, 33, 34]. Osteophytes formation can result in difficult interpretation of landmarks.
Medial vs Lateral
A total of sixteen papers directly compared medial and lateral PTS, shown in Table 4. Ten papers with a total of 2,924 subjects, described the medial PTS being greater than the lateral. Five papers with a total of 465 subjects described the opposite with lateral PTS being greater than medial.
Table 4.
Comparison of Medial and Lateral PTS
| Author | Country | Modality | Number of knees | Medial PTS | Lateral PTS | Medial–Lateral |
|---|---|---|---|---|---|---|
| Pangaud et al | France | CT | 756 | 6.2 | 5.2 | 1 |
| Ho et al | Malaysia | CT | 100 | 11.3 | 10.9 | 0.4 |
| Yang Zhang et | China | CT | 160 | 8.4 | 7.6 | 0.8 |
| Yijie Zhang et al | China | CT | 157 | 8 | 5.6 | 2.4 |
| Weinberg et al | USA | CT | 1090 | 6.9 | 4.7 | 2.2 |
| Han et al | South Korea | CT | 133 | 10 | 8.4 | 1.6 |
| Li et al | China | MRI | 40 | 4.6 | 4.2 | 0.4 |
| Yoon et al | South Korea | MRI | 232 | 4.1 | 3.5 | 0.6 |
| Karimi et al | Iran | MRI | 132 | 7.8 | 6.9 | 0.9 |
| Khan et al | South Korea | MRI | Controls 51 | 4.8 | 2.7 | 2.1 |
| ACLs 73 | 5.1 | 4.6 | 0.5 | |||
| Stijak et al | Switzerland | MRI | Controls 33 | 6.6 | 4.4 | 2.2 |
| ACLs 33 | 5.2 | 7.5 | -2.3 | |||
| Jaecker et al | Germany | MRI | ACLR success 69 | 4.1 | 3.4 | 0.7 |
| ACLR failure 57 | 6.7 | 7.3 | -0.6 | |||
| Dare et al | USA | MRI | Controls 76 | 5.1 | 3.4 | 1.7 |
| ACLs 76 | 5.4 | 5.7 | -0.3 | |||
| Utzschneider et al | Germany | CT/MRI/X-ray | 14 | 9.4 | 10 | -0.6 |
| Hudek et al | Switzerland | MRI | 100 | 4.8 | 5 | -0.2 |
| Kiapour et al | USA | MRI | 44 | 4.7 | 6.6 | -1.9 |
| Hashemi et al | USA | MRI | Men 22 | 3.7 | 5.4 | -1.7 |
| Women 33 | 5.9 | 7 | -1.1 | |||
| Grassi et al | Italy | MRI | ACLR success 43 | 4.4 | 4.8 | -0.4 |
| ACLR failure 43 | 9.4 | 11.4 | -2 |
PTS in Patients with Anterior Cruciate Injuries
Khan et al. [14], Stijak et al. [11] and Dare et al. [12] all showed in their MRI studies higher lateral PTS in patients with ACL injuries compared to controls (4.6º vs 2.7º, 7.5º vs 4.4º and 5.7º vs 3.4º, respectively). DePhillipo et al. failed to demonstrate increased lateral PTS between non-contact (9.9º) and contact ACL injuries (9.1º) but both were significantly higher than controls (5.6º) [17]. Simon et al. suggested that increased lateral PTS relative to medial PTS generates an internal rotation of the tibia relative to the femur, resulting in ACL strain [35]. This theory is confirmed by Dare describing an increased ratio of lateral PTS/medial PTS in ACL injuries compared to controls [12]. Wahl described a smaller antero-posterior distance and increased convexity of the lateral plateau in patients with ACL ruptures [36]. Jaecker et al. described similar “at risk” morphological features, but almost universally seen in female patients with ACL injuries [19]. Beynnon et al. in their MRI study of 176 college athletes demonstrated a 21.7% increased risk of non-contact ACL rupture with each degree of increased lateral PTS in females but interestingly not in males [13].
Kiapour et al. demonstrated in their MRI study that patients with high lateral PTS at seven years post ACL reconstruction had increased graft laxity, poorer patient-reported outcome measures (PROMs) and a higher incidence of osteoarthritis [22].
Six papers directly compare controls and ACL rupture patients (Table 4) with a clear trend of increased PTS in patients with ACL rupture. The cumulative mean PTS for controls was 8.1º, compared to 9.9º in the ACL group. Su et al. was the only paper not to demonstrate a significant difference between ACL ruptures and control patients [37]. DePhillipo et al. used MRI with the proximal tibial axis, all other papers used lateral radiographs and the proximal tibial axis, however, there were slight variations in technique between authors.
Two papers compared PTS [2, 18] for successful ACL reconstructions to failed reconstructions (Table 5), and both demonstrated a higher PTS in those with re-injuries. The failed ACL reconstructions had a cumulative mean PTS of 11.8º compared to 9.3º for successful reconstructions. Webb et al. [2] reported in their prospective study over 15 years; that 59% of patients with a PTS greater than 12º had re-injuries, compared to only 23% if under 12º[2]. Christensen et al. [3]. looked at lateral PTS on MRI for successful and failed ACL reconstructions. They found an increasing risk of re-rupture with increased lateral PTS [3]or a PTS 4º higher than the mean there was a five-fold increase of re-rupture increasing to a ten-fold risk for 6º higher than the mean [3].
Table 5.
PTS in patients with cruciate injuries
| Author | Country | Modality | Number of knees | Axis | Mean PTS | PTS range |
|---|---|---|---|---|---|---|
| DePhillipo et al | USA | MRI | Controls 56 | PTA | 5.6 | |
| ACLs 112 | PTA | 9.5 | ||||
| O’Malley et al | USA | X-ray | Controls 32 | PTA | 8.5 | 4.8–12.2 |
| ACLs 32 | PTA | 10.6 | 7.5–13.6 | |||
| Kızılgoz et al | Turkey | X-ray | Controls 101 | PTA | 6.2 | |
| ACLs 92 | PTA | 7.6 | ||||
| Brandon | USA | X-ray | Controls 100 | PTA | 8.5 | |
| ACLs 100 | PTA | 11.2 | ||||
| Zeng et al | China | X-ray | Controls 73 | PTA | 9.4 | |
| ACLs 73 | PTA | 11.5 | ||||
| Su et al | USA | X-ray | Controls 83 | PTA | 10.2 | |
| ACLs 123 | PTA | 9.7 | ||||
| Lee et al | South Korea | X-ray | ACLR success 64 | PTA | 10.9 | 4.9–13.6 |
| ACLR failure 64 | PTA | 13.2 | 8.5–18.2 | |||
| Webb et al | Australia | X-ray | ACLR success 131 | PTA | 8.5 | |
| ACLR failure 50 | PTA | 9.9 |
Discussion
Recently there has been increased interest in the correlation between higher PTS and non-contact ACL injury as well reconstruction failure. However, there is very little consensus in the literature regarding measurement technique, normal values or an important cut-off after which osteotomy should be considered. In a recent article about managing increased PTS, Schillhammer highlighted the controversy, writing “where exactly does one draw the line…? An equally important question is how to draw the line”[38].
Very few authors have defined normal values or ranges; those that have base their figures on small studies with low levels of evidence. Lee [18] and Webb [2] both suggest 12º as the upper limit of normal when using lateral radiographs [2, 18], and Jaecker et al. suggested > 10º was abnormal when using MRIs [19].
Imaging Modalities
Lateral knee radiographs, whilst routinely used, make it difficult to plot a reliable line for the longitudinal tibial axis. They can also cause inaccuracy from femoral rotation as the tibia axially rotates during the “screw home” mechanism of terminal extension [39]. In addition, it is often difficult to accurately distinguish the medial and lateral compartments because of superimposition on X-ray [9, 30, 40]. We suggest a “gold standard” of a long lateral radiograph, including knee and ankle providing visualisation and allowing the true mechanical axis to be utilised.
CT has been shown to be the most accurate modality for PTS calculation [33, 41]. While the reference axes can be defined with high reproducibility and reliability [5, 28] it causes a higher exposure to ionising radiation and is not part of routine practice.
MRI scans have the limitation that very little proximal tibia is included, resulting in inadequate determination of the proximal tibial axis [42]. Hudek et al. reported a smaller PTS on MRI compared to lateral radiograph [30], and we postulate that this is the result of the short proximal tibia segment on knee MRI scans. To reduce this error several authors advocate using a central point of the most distal tibia visible for PTA creation [12].
Due to these challenges to accuracy, our recommendation is to change scanning protocols to include at least 15 cm of the proximal tibia to allow accurate axis calculation or acquire good quality long lateral radiographs.
Tibial Longitudinal Axes
Variation in proximal tibial morphology exists, being influenced by a series of genetic and environmental factors, such as race, sex, age, and lifestyle [5, 28]. Consequently, several different axes have been suggested and compared by authors [4, 5, 27, 28, 31, 33] The proximal tibial axis (PTA) with central reference points at 5 and 15 cm from the tibial joint line appears to correlate closest to the true mechanical axis of the leg.
Tibial Plateau Landmarks
The geometry of the articular cartilage has been shown to be significantly different from the underlying subchondral bone [12]. It is the cartilage that represents the functional part of the tibiofemoral articulation, and arguably should be included in PTS measurement [12]. For this reason, some have advocated using the meniscal-chondral junction to define the plateau angle. Jenny et al. in their cadaveric study demonstrated that the posterior meniscal horn is much thicker than anterior horn, this resulted in “meniscal” slope being 6º less than bony slope [43], effectively reducing the PTS. Feucht et al. in their systematic review suggested using the superior meniscal border measure a ‘functional slope’ [44]. However, measuring the meniscus may be unreliable given it can be highly mobile. The meniscus may also be deficient following injury or resection, particularly in revision ACL patients.
Biomechanics and Anatomy
During weight bearing the posterior inclination of the tibial plateau creates a shear force that results in anterior tibial translation. Shelbourne et al. used a computer model to demonstrate that increasing the PTS results in increased tibial shear force and anterior tibial translation [45]. The clinical paper by Dejour and Bonnin [29] reported that for every 10º increase in PTS there was a 6 mm increase in anterior tibial translation during single leg stance [29]. Consequently, an increased PTS puts higher forces through the ACL resulting in a higher chance of non-contact ACL rupture. This has been confirmed by multiple authors demonstrating a correlation between increased PTS in ACL rupture [2, 10, 15, 42, 46], also translates to an increased risk of graft failure following ACL reconstruction [[2, 3, 18–22, 47].
Patients with ACL ruptures have been shown to have shallower medial tibial plateaus, resulting in less constraint of the femoral condyle and increased tibial translation [14, 22]. During knee flexion, there is larger anterior tibial translation laterally and the tibia internally rotates around the concave medial pivot. This tibial internal rotation further puts strain on the ACL, leading several authors to suggest the PTS of the lateral plateau is of greater importance than the medial [11–14, 22]. The pivot-shift represents subluxation of the lateral plateau and increased PTS has been associated with increased pivot-shift grades [10].
Use of Slope Changing Osteotomy
Small case series exist to support the use of slope-changing osteotomy in revision ACL surgery. Webb et al. [2] suggest osteotomy in patients with a PTS greater than 12º. This concurs with Dejour et al. [18], who report a case series of 9 patients with no re-ruptures at a minimum of 2 years follow-up after reducing mean PTS from 13.3º to 4.4º [23]. Similarly, Sonnery-Cottet et al. [24] reported a series of five ACL revision cases reducing their PTS on average from 13.6º to 9.2º, also reducing mean anterior translation by 2.8 mm [24]. When looking at PCL reconstructions Bernhardson et al. recommended slope-increasing osteotomy as an adjunct to PCL reconstruction if the slope was less than 6º[48]. There is no consensus on the absolute value of PTS to correct to when performing slope-changing osteotomy.
There were several limitations to this systematic review. The included studies were of lower-level evidence, all being apart from one being level 3. Some included studies were only of a fair score using the MINORS quality assessment tool. All studies were retrospective. Duration of follow-up differed greatly with Webb’s series being the sole study with long follow-up at 15 years [45]. There was significant heterogeneity between studies, particularly relating to the methods of PTS measurement and imaging modalities. This variation prevented meta-analysis. However, the search algorithm was robust and followed the PRISMA guidelines. A large amount of data was extracted from 33 studies, allowing for useful conclusions to be made.
Conclusion
To calculate “normal” values for PTS a standardised methodology must exist. Typically short lateral radiographs and MRI scans are the most frequently used imaging modalities for cruciate surgery. Therefore, an ideal method of measuring PTS should consider this and be reliably transferable between the two. The proximal tibial axis has been shown to be the closest surrogate to the true mechanical axis and should, therefore, be adopted for regular use, ideally with two central reference points at 5 and 15 cm from the joint line.
Based on the available literature normal ranges of 6-12º using the proximal tibia axis at 5 and 15 cms below the joint. We cautiously suggest 12º as a value to consider slope-reducing osteotomy for revision ACL reconstruction.
Author Contributions
The roles of authors: All authors: substantial contributions to the conception or design of the work; or the acquisition, analysis, or interpretation of data for the work, drafting the work, or revising it critically for important intellectual content and final approval for the version to be published.
Funding
No funding was received for this study.
Data availability
Not applicable.
Declarations
Conflict of Interest
The authors declare that they have no conflict of interest.
Ethical Standard Statement
This article does not contain any studies with human or animal subjects performed by the any of the authors.
Informed Consent
For this type of study informed consent is not required.
Footnotes
Publisher's Note
Springer Nature remains neutral with regard to jurisdictional claims in published maps and institutional affiliations.
References
- 1.Abram SG, Price AJ, Judge A, Beard DJ. Anterior cruciate ligament (ACL) reconstruction and meniscal repair rates have both increased in the past 20 years in England: Hospital statistics from 1997 to 2017. British Journal of Sports Medicine. 2020;54(5):286–291. doi: 10.1136/bjsports-2018-100195. [DOI] [PubMed] [Google Scholar]
- 2.Webb JM, Salmon LJ, Leclerc E, Pinczewski LA, Roe JP. Posterior tibial slope and further anterior cruciate ligament injuries in the anterior cruciate ligament-reconstructed patient. American Journal of Sports Medicine. 2013;41(12):2800–2804. doi: 10.1177/0363546513503288. [DOI] [PubMed] [Google Scholar]
- 3.Christensen JJ, Krych AJ, Engasser WM, Vanhees MK, Collins MS, Dahm DL. Lateral tibial posterior slope is increased in patients with early graft failure after anterior cruciate ligament reconstruction. American Journal of Sports Medicine. 2015;43(10):2510–2514. doi: 10.1177/0363546515597664. [DOI] [PubMed] [Google Scholar]
- 4.Han HS, Chang CB, Seong SC, Lee S, Lee MC. Evaluation of anatomic references for tibial sagittal alignment in total knee arthroplasty. Knee Surgery, Sports Traumatology, Arthroscopy. 2008;16(4):373–377. doi: 10.1007/s00167-008-0486-1. [DOI] [PubMed] [Google Scholar]
- 5.Zhang Y, Wang J, Xiao J, Zhao L, Yan G, et al. Measurement and comparison of tibial posterior slope angle in different methods based on three-dimensional reconstruction. The Knee. 2014;21(3):694–694. doi: 10.1016/j.knee.2014.01.008. [DOI] [PubMed] [Google Scholar]
- 6.Pangaud C, Laumonerie P, Dagneaux L, LiArno S, Wellings P, Faizan A, et al. Measurement of the posterior tibial slope depends on ethnicity, sex, and lower limb alignment: a computed tomography analysis of 378 healthy participants. Orthopaedic Journal of Sports Medicine. 2020;8(1):2325967119895258. doi: 10.1177/2325967119895258. [DOI] [PMC free article] [PubMed] [Google Scholar]
- 7.Bisicchia S, Scordo GM, Prins J, Tudisco C. Do ethnicity and gender influence posterior tibial slope? Journal of Orthopaedics Traumatology. 2017;18(4):319–324. doi: 10.1007/s10195-017-0443-1. [DOI] [PMC free article] [PubMed] [Google Scholar]
- 8.Weinberg DS, Williamson DFK, Gebhart JJ, Knapik DM, Voos JE. Differences in medial and lateral posterior tibial slope: an osteological review of 1090 tibiae comparing age, sex, and race. American Journal of Sports Medicine. 2017;45(1):106–113. doi: 10.1177/0363546516662449. [DOI] [PubMed] [Google Scholar]
- 9.Hashemi J, Chandrashekar N, Gill B, Beynnon BD, Slauterbeck JR, Schutt RC, Jr, et al. The geometry of the tibial plateau and its influence on the biomechanics of the tibiofemoral joint. Journal of Bone and Joint Surgery. American Volume. 2008;90(12):2724–2734. doi: 10.2106/JBJS.G.01358. [DOI] [PMC free article] [PubMed] [Google Scholar]
- 10.Brandon ML, Haynes PT, Bonamo JR, Flynn MI, Barrett GR, Sherman MF. The Association between posterior-inferior tibial slope and anterior cruciate ligament insufficiency. Arthroscopy: The Journal of Arthroscopic & Related Surgery. 2006;22(8):894–899. doi: 10.1016/j.arthro.2006.04.098. [DOI] [PubMed] [Google Scholar]
- 11.Stijak L, Herzog R, Schai P. Is there an influence of the tibial slope of the lateral condyle on the ACL lesion? A case-control study. Knee Surgery, Sports Traumatology, Arthroscopy. 2008;1(16):112–117. doi: 10.1007/s00167-007-0438-1. [DOI] [PubMed] [Google Scholar]
- 12.Dare DM, Fabricant PD, McCarthy MM, Rebolledo BJ, Green DW, Cordasco FA, et al. Increased lateral tibial slope is a risk factor for pediatric anterior cruciate ligament injury: An MRI-based case-control study of 152 patients. American Journal of Sports Medicine. 2015;43(7):1632–1639. doi: 10.1177/0363546515579182. [DOI] [PubMed] [Google Scholar]
- 13.Beynnon BD, Hall JS, Sturnick DR, Desarno MJ, Gardner-Morse M, Tourville TW, et al. Increased slope of the lateral tibial plateau subchondral bone is associated with greater risk of noncontact ACL injury in females but not in males: a prospective cohort study with a nested, matched case-control analysis. The American Journal of Sports Medicine. 2014;42(5):1039–1048. doi: 10.1177/0363546514523721. [DOI] [PMC free article] [PubMed] [Google Scholar]
- 14.Khan MS, Seon JK, Song EK. Risk factors for anterior cruciate ligament injury: assessment of tibial plateau anatomic variables on conventional MRI using a new combined method. International Orthopaedics. 2011;35(8):1251–1256. doi: 10.1007/s00264-011-1217-7. [DOI] [PMC free article] [PubMed] [Google Scholar]
- 15.Zeng C, Yang T, Wu S, Li H, et al. Is posterior tibial slope associated with noncontact anterior cruciate ligament injury? Knee Surgery Sports Traumatology Arthroscopy. 2016;24(3):830–837. doi: 10.1007/s00167-014-3382-x. [DOI] [PubMed] [Google Scholar]
- 16.Kızılgöz V, Sivrioğlu AK, Ulusoy GR, Yıldız K, Aydın H, Çetin T. Posterior tibial slope measurement on lateral knee radiographs as a risk factor of anterior cruciate ligament injury: a cross-sectional study. Radiography. 2019;25(1):33–38. doi: 10.1016/j.radi.2018.07.007. [DOI] [PubMed] [Google Scholar]
- 17.DePhillipo NN, Zeigler CG, Dekker TJ, Grantham WJ, Aman ZS, Kennedy MI, et al. Lateral posterior tibial slope in male and female athletes sustaining contact versus noncontact anterior cruciate ligament tears: a prospective study. American Journal of Sports Medicine. 2019;47(8):1825–1830. doi: 10.1177/0363546519848424. [DOI] [PubMed] [Google Scholar]
- 18.Lee CC, Youm YS, Cho S, Jung SH, Bae MH, Park SJ, et al. Does posterior tibial slope affect graft rupture following anterior cruciate ligament reconstruction? Arthroscopy. 2018;34(7):2152–2155. doi: 10.1016/j.arthro.2018.01.058. [DOI] [PubMed] [Google Scholar]
- 19.Jaecker V, Drouven S, Naendrup JH, Kanakamedala AC, Pfeiffer T, Shafizadeh S. Increased medial and lateral tibial posterior slopes are independent risk factors for graft failure following ACL reconstruction. Archives of Orthopaedic and Trauma Surgery. 2018;138(10):1423–1431. doi: 10.1007/s00402-018-2968-z. [DOI] [PubMed] [Google Scholar]
- 20.Grassi A, Signorelli C, Urrizola F, Macchiarola L, Raggi F, Mosca M, et al. Patients with failed anterior cruciate ligament reconstruction have an increased posterior lateral tibial plateau slope: a case-controlled study. Arthroscopy. 2019;35(4):1172–1182. doi: 10.1016/j.arthro.2018.11.049. [DOI] [PubMed] [Google Scholar]
- 21.Sauer S, English R, Clatworthy M. The influence of tibial slope on anterior cruciate ligament graft failure risk is dependent on graft positioning. Journal of Orthopaedic Surgery. 2019;27(1):2309499019834674. doi: 10.1177/2309499019834674. [DOI] [PubMed] [Google Scholar]
- 22.Kiapour AM, Yang DS, Badger GJ, Karamchedu NP, Murray MM, Fadale PD, et al. Anatomic features of the tibial plateau predict outcomes of ACL reconstruction within 7 years after surgery. The American Journal of Sports Medicine. 2019;47(2):303–311. doi: 10.1177/0363546518823556. [DOI] [PMC free article] [PubMed] [Google Scholar]
- 23.Dejour D, Saffarini M, Demey G, Baverel L. Tibial slope correction combined with second revision ACL produces good knee stability and prevents graft rupture. Knee Surgery, Sports Traumatology, Arthroscopy. 2015;23(10):2846–2852. doi: 10.1007/s00167-015-3758-6. [DOI] [PubMed] [Google Scholar]
- 24.Sonnery-Cottet B, Mogos S, Thaunat M, Archbold P, Fayard JM, Freychet B, et al. Proximal Tibial Anterior Closing Wedge Osteotomy in Repeat Revision of Anterior Cruciate Ligament Reconstruction. American Journal of Sports Medicine. 2014;42(8):1873–1880. doi: 10.1177/0363546514534938. [DOI] [PubMed] [Google Scholar]
- 25.Moher D, Liberati A, Tetzlaff J, Altman DG. Preferred reporting items for systematic reviews and meta-analyses: The PRISMA statement. BMJ. 2009;21(339):b2535. doi: 10.1136/bmj.b2535. [DOI] [PMC free article] [PubMed] [Google Scholar]
- 26.Slim K, Nini E, Forestier D, Kwiatkowski F, Panis Y, Chipponi J. Methodological index for non-randomized studies (MINORS): Development and validation of a new instrument. ANZ Journal of Surgery. 2003;73(9):712–716. doi: 10.1046/j.1445-2197.2003.02748.x. [DOI] [PubMed] [Google Scholar]
- 27.Yoo JH, Chang CB, Shin KS, Seong SC, Kim TK. Anatomical references to assess the posterior tibial slope in total knee arthroplasty: a comparison of 5 anatomical axes. Journal of Arthroplasty. 2008;23(4):586–592. doi: 10.1016/j.arth.2007.05.006. [DOI] [PubMed] [Google Scholar]
- 28.Zhang Y, Wang J, Xiao J, Zhao L, Li Z han, Yan G, et al. Measurement and comparison of tibial posterior slope angle in different methods based on three-dimensional reconstruction. Knee. 2014;21(3):694–698. [DOI] [PubMed]
- 29.Dejour, H., Bonnin, M. (1994). Tibial translation after anterior cruciate ligament rupture. Two radiological tests compared. The Journal of Bone and Joint Surgery British 76(5):745–749. [PubMed]
- 30.Hudek R, Schmutz S, Regenfelder F, Fuchs B, Koch PP. Novel measurement technique of the tibial slope on conventional MRI. Clinical Orthopaedics Related Research. 2019;467(8):2066–2072. doi: 10.1007/s11999-009-0711-3. [DOI] [PMC free article] [PubMed] [Google Scholar]
- 31.Utzschneider S, Goettinger M, Weber P, Horng A, Glaser C, Jansson V, et al. Development and validation of a new method for the radiologic measurement of the tibial slope. Knee Surgery, Sports Traumatology, Arthroscopy. 2011;19(10):1643–1648. doi: 10.1007/s00167-011-1414-3. [DOI] [PubMed] [Google Scholar]
- 32.Trojian TH, Collins S. The anterior cruciate ligament tear rate varies by race in professional women’s basketball. American Journal of Sports Medicine. 2006;34(6):895–898. doi: 10.1177/0363546505284384. [DOI] [PubMed] [Google Scholar]
- 33.Faschingbauer M, Sgroi M, Juchems M, Reichel H, Kappe T. Can the tibial slope be measured on lateral knee radiographs? Knee Surgery, Sports Traumatology, Arthroscopy. 2014;22(12):3163–3167. doi: 10.1007/s00167-014-2864-1. [DOI] [PubMed] [Google Scholar]
- 34.Ho JPY, Merican AM, Hashim MS, Abbas AA, Chan CK, Mohamad JA. Three-dimensional computed tomography analysis of the posterior tibial slope in 100 knees. Journal of Arthroplasty. 2017;32(10):3176–3183. doi: 10.1016/j.arth.2017.04.060. [DOI] [PubMed] [Google Scholar]
- 35.Simon RA, Everhart JS, Nagaraja HN, Chaudhari AM. A case-control study of anterior cruciate ligament volume, tibial plateau slopes and intercondylar notch dimensions in ACL-injured knees. Journal of Biomechanics. 2010;43(9):1702–1707. doi: 10.1016/j.jbiomech.2010.02.033. [DOI] [PMC free article] [PubMed] [Google Scholar]
- 36.Wahl CJ, Westermann RW, Blaisdell GY, Cizik AM. An association of lateral knee sagittal anatomic factors with non-contact ACL injury: sex or geometry? The Journal of Bone and Joint Surgery-American Volume. 2012;94(3):217–226. doi: 10.2106/JBJS.K.00099. [DOI] [PubMed] [Google Scholar]
- 37.Su AW, Bogunovic L, Smith MV, Gortz S, Brophy RH, Wright RW, et al. Medial tibial slope determined by plain radiography is not associated with primary or recurrent anterior cruciate ligament tears. The Journal of Knee Surgery. 2020;33(01):22–28. doi: 10.1055/s-0038-1676456. [DOI] [PubMed] [Google Scholar]
- 38.Schillhammer C. <em>Editorial Commentary:</em> Managing excessive posterior slope in anterior cruciate ligament reconstruction: where do we draw the line? Arthroscopy. 2018;34(7):2156–2157. doi: 10.1016/j.arthro.2018.04.005. [DOI] [PubMed] [Google Scholar]
- 39.Kim HY, Kim KJ, Yang DS, Jeung SW, Choi HG, Choy WS. Screw-home movement of the tibiofemoral joint during normal gait: three-dimensional analysis. Clinics in Orthopedic Surgery. 2015;7(3):303–309. doi: 10.4055/cios.2015.7.3.303. [DOI] [PMC free article] [PubMed] [Google Scholar]
- 40.Amirtharaj MJ, Hardy BM, Kent RN, Nawabi DH, Wickiewicz TL, Pearle AD, et al. Automated, accurate, and three-dimensional method for calculating sagittal slope of the tibial plateau. Journal of Biomechanics. 2018;79:212–217. doi: 10.1016/j.jbiomech.2018.07.047. [DOI] [PubMed] [Google Scholar]
- 41.Zhang Y, Chen Y, Qiang M, Zhang K, Li H, Jiang Y, et al. Comparison between three-dimensional CT and conventional radiography in proximal tibia morphology. Medicine. 2018;97(30):e11632. doi: 10.1097/MD.0000000000011632. [DOI] [PMC free article] [PubMed] [Google Scholar]
- 42.O’Malley MP, Milewski MD, Solomito MJ, Erwteman AS, Nissen CW. The association of tibial slope and anterior cruciate ligament rupture in skeletally immature patients. Arthroscopy: The Journal of Arthoscopic & Related Surgery. 2015;31(1):77–82. doi: 10.1016/j.arthro.2014.07.019. [DOI] [PubMed] [Google Scholar]
- 43.Jenny J, Rapp E, Kehr P. Proximal tibial meniscal slope: A comparison with the bone slope. Revue de Chirurgie Orthopedique et Reparatrice de l'Appareil Moteur. 1997;84(5):435–438. [PubMed] [Google Scholar]
- 44.Feucht MJ, Mauro CS, Brucker PU, Imhoff AB, Hinterwimmer S. The role of the tibial slope in sustaining and treating anterior cruciate ligament injuries. Knee Surgery, Sports Traumatology, Arthroscopy. 2013;21(1):134–145. doi: 10.1007/s00167-012-1941-6. [DOI] [PubMed] [Google Scholar]
- 45.Shelburne KB, Kim HJ, Sterett WI, Pandy MG. Effect of posterior tibial slope on knee biomechanics during functional activity. Journal of Orthopaedic Research. 2011;29(2):223–231. doi: 10.1002/jor.21242. [DOI] [PubMed] [Google Scholar]
- 46.Wang Y, Yang T, Zeng C, Wei J, Xie D, Yang YH, et al. Association between tibial plateau slopes and anterior cruciate ligament injury: a meta-analysis. Arthroscopy. 2017;33(6):1248–1259.e4. doi: 10.1016/j.arthro.2017.01.015. [DOI] [PubMed] [Google Scholar]
- 47.Yoon KH, Park SY, Park JY, Kim EJ, Kim SJ, Kwon YB, et al. Influence of posterior tibial slope on clinical outcomes and survivorship after anterior cruciate ligament reconstruction using hamstring autografts: a minimum of 10-year follow-up. Arthroscopy. 2020 doi: 10.1016/j.arthro.2020.06.011. [DOI] [PubMed] [Google Scholar]
- 48.Bernhardson AS, DePhillipo NN, Daney BT, Kennedy MI, Aman ZS, LaPrade RF. Posterior tibial slope and risk of posterior cruciate ligament injury. American Journal of Sports Medicine. 2019;47(2):312–317. doi: 10.1177/0363546518819176. [DOI] [PubMed] [Google Scholar]
Associated Data
This section collects any data citations, data availability statements, or supplementary materials included in this article.
Data Availability Statement
Not applicable.