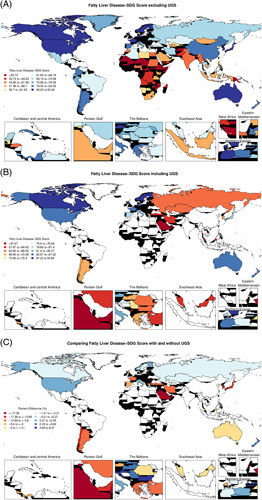
FIGURE 2.

Geographical distribution of the fatty liver disease–SDG score, 2017. (A) Fatty liver disease SDG score in 195 countries and territories developed by using 6 indicators (child wasting, child overweight, NCD mortality, a UHC service coverage index, health worker density, and education attainment). (B) Fatty liver disease–SDG score in 60 countries and territories developed by using the 6 aforementioned indicators plus the UGS indicator. Countries and territories with no color indicate that they do not have UGS data. (C) Percentage change (%) of the fatty liver disease–SDG score with and without the UGS indicator in 60 countries that have UGS data. Percent change was calculated by first subtracting the fatty liver disease–SDG score developed without UGS data from the fatty liver disease–SDG score developed with UGS data and then dividing the difference by the fatty liver disease–SDG score without UGS data. Countries and territories with no color indicate that they do not have UGS data. Abbreviations: NCD, noncommunicable disease; SDG, Sustainable Development Goal; UGS, urban green space; UHC, universal health coverage.
