

Abstract
Background and Aims:
HBV shapes the T-cell immune responses in HBV-related HCC. T cells can be recruited to the nidus, but limited T cells participate specifically in response to the HBV-related tumor microenvironment and HBV antigens. How epigenomic programs regulate T-cell compartments in virus-specific immune processes is unclear.
Approach and Results:
We developed Ti-ATAC-seq. 2 to map the T-cell receptor repertoire, epigenomic, and transcriptomic landscape of αβ T cells at both the bulk-cell and single-cell levels in 54 patients with HCC. We deeply investigated HBV-specific T cells and HBV-related T-cell subsets that specifically responded to HBV antigens and the HBV + tumor microenvironment, respectively, characterizing their T-cell receptor clonality and specificity and performing epigenomic profiling. A shared program comprising NFKB1/2-, Proto-Oncogene, NF-KB Sub unit, NFATC2-, and NR4A1-associated unique T-cell receptor-downstream core epigenomic and transcriptomic regulome commonly regulated the differentiation of HBV-specific regulatory T-cell (Treg) cells and CD8 + exhausted T cells; this program was also selectively enriched in the HBV-related Treg-CTLA4 and CD8-exhausted T cell-thymocyte selection associated high mobility subsets and drove greater clonal expansion in HBV-related Treg-CTLA4 subset. Overall, 54% of the effector and memory HBV-specific T cells are governed by transcription factor motifs of activator protein 1, NFE2, and BACH1/2, which have been reported to be associated with prolonged patient relapse-free survival. Moreover, HBV-related tumor-infiltrating Tregs correlated with both increased viral titer and poor prognosis in patients.
Conclusions:
This study provides insight into the cellular and molecular basis of the epigenomic programs that regulate the differentiation and generation of HBV-related T cells from viral infection and HBV + HCC unique immune exhaustion.

INTRODUCTION
HCC is the fourth most common cause of cancer-related death worldwide.1 HBV infection is one of the most important etiological factors of HCC. In the past 2 decades, the clinical trials of HCC therapies have revealed a more effective response to immune checkpoint inhibitor therapy in patients with HBV-related HCC (HBV+ HCC) than in those with nonviral HCC (HBV− HCC), whereas there are no differences related to etiology in those receiving tyrosine-kinase inhibitor therapy,2 highlighting the need for a deeper understanding of the tumor microenvironment (TME) of HBV+ HCC. Large-scale investigations of HCC using genomic profiling and high-throughput sequencing have revealed that TGFβ signaling is associated with high immune tumor infiltration and adaptive or exhausted immune responses.3,4 Recent studies on HCC have revealed the complex heterogeneity of tumor-infiltrating leukocytes (TILs), indicating that the TME is highly immunosuppressive and enriched with exhausted CD8+ T cells, and regulatory T (Treg) cells,5,6 as well as abundant HBV-specific CD8+ T cells targeting different HBV-derived epitopes.7 However, the alternative T-cell compartments that participate specifically in the response to HBV infection and HBV antigens and the underlying epigenomic regulatory program of formation and differentiation are still unclear.
Epigenomic analysis based on an assay for transposase-accessible chromatin with sequencing (ATAC-seq) has been widely applied to interrogate the development, differentiation, and formation of immune cells.8 Recently, we developed a single-cell method, TCR-index-ATAC sequencing (Ti-ATAC-seq),9 which combined single-cell T-cell receptor (TCR) sequencing (scTCR-seq), index sorting, and single-cell ATAC-seq (scATAC-seq), thus allowing us to analyze chromatin accessibility and TCR clonality in the same individual T-cell. In this study, we improved on this approach and reported an advanced version, termed Ti-ATA-seq. 2 which provides profiles with high throughput and highly uniform-quality profiles.
Here, we applied ATAC-seq, Ti-ATAC-seq. 2, scTCR-seq, single-cell RNA sequencing (scRNA-seq), and spatial transcriptomics to comprehensively analyze chromatin accessibility, gene expression, and TCR clonality and specificity of T cells from 54 patients with HCC, including 43 with HBV+ HCC and 11 with HBV− HCC patients. Data were collected in this study from 32 individuals, and data from an additional 22 patients were obtained from public data sets.5,10,11 We predicted and validated HBV-specific T cells in HCC using GLIPH algorithm12 and luciferase reporter assays, respectively. These results revealed the regulatory programs of the formation and differentiation of 3 HBV-related T-cell subpopulations and HBV-specific T cells that responded to HBV-infected TME and HBV antigens. A common shared epigenomic regulome comprising NFKB-, NFATC2-, and NR4A1-associated TCR signaling regulated the differentiation of HBV-specific T cells as well as HBV-related subsets including Treg-CTLA4 and CD8-exhausted T-cell thymocyte selection associated high mobility group box (TOX); this regulome drove greater clonal expansion in the HBV-related Treg-CTLA4 subset. HBV-specific CD8+ T cells express high levels of Fas ligand (FASLG) ligand, which is linked to both HBV-specific Treg cells and tumor cells through the FASLG, cell-to-cell communication. Together, these large-scale multimodal profiles provide an opportunity to reveal the epigenomic and transcriptomic regulatory programs of the virus-related and virus-specific T-cell immune responses in HBV+ HCC and also provide many therapeutic opportunities for cancer immunotherapy development.
METHODS
Subjects and specimen collection
All the patients and healthy donors (HDs) were enrolled at the Fifth Medical Center of PLA General Hospital and provided written informed consent for sample collection and data analysis. These patients had not been treated with chemotherapy or radiation before tumor resection. The experiments and protocols in this study were approved by the Ethics Committees of the Fifth Medical Center of Chinese PLA General Hospital, Beijing, China. Patients are considered HBV positive with HBV based on a history of chronic infection and HBV serological markers. The features of 58 individuals are listed in Supplemental Table S1 (http://links.lww.com/HEP/F7).
Additional materials and methods are described in the Supplemental Materials and Methods (http://links.lww.com/HEP/F15) (Supplemental Table S8 is cited in the Supplemental Methods, http://links.lww.com/HEP/F14).
RESULTS
HBV+ tumor-infiltrating leukocytes exhibit unique epigenomic profiles consistent with immune activation
First, we investigated the global epigenomic signatures in HCC-infiltrating T cells (Figure 1A). We isolated αβ T lymphocytes from surgically resected tumor tissues, paratumoral tissues (PT), and peripheral blood mononuclear cells (PBMCs) from 13 patients with HBV+ HCC and 5 patients with HBV− HCC, as well as PBMCs from 3 HD (Supplemental Figure S1A, http://links.lww.com/HEP/F15, Supplemental Table S1, http://links.lww.com/HEP/F7). To determine how T cells from different tissues and from patients with different etiological factors differ at the epigenetic level, T cells from all samples were subjected to genome-wide ATAC-seq. The ATAC-seq profiles identified 7 groups within 63 high-resolution regulome and 74,583 peaks of DNA accessibility (Supplemental Figure S1B–D, http://links.lww.com/HEP/F15). The collected samples were clearly separated by tissue of provenance and disease status when visualized using a T-distributed stochastic neighbor embedding projection based on the accessibility of ATAC-seq peaks, separating the T cells from HDs, PBMCs, and paratumoral and tumor tissues of HBV− HCC and HBV+ HCC (Figure 1B), indicating the feasibility of obtaining high-quality epigenomic data.
FIGURE 1.

Epigenomic landscape of T-cell ensembles in HCC. (A) Overview of the study design, including the patient sample processing for bulk-cell ATAC-seq, single-cell Ti-ATAC-seq. 2, and involved data sets used for validation. (B) t-SNE projection of bulk αβ T-cell ATAC-seq profiles from 7 groups, including (1) HD_PBMC (n = 5), (2) HBV (−) HCC_PBMC (n = 8), (3) HBV (−) HCC_PT (n = 7), (4) HBV (−) HCC_TT (n = 5), (5) HBV (+) HCC_PBMC (n = 13), (6) HBV (+) HCC_PT (n = 12), and (7) HBV (+) HCC_TT (n = 13). (C) Heatmap describing clusters for the top 6337 varying ATAC-seq peaks. Colors indicate the log2 FC of reads in each peak compared with the mean across all T-cell groups, including T cells derived from either the PBMCs of HDs or the PBMCs, peritumoral or TTs of patients with HBV + HCC and HBV− HCC. Selected annotated genes from each cluster are shown on the right. (D) Heatmap showing enrichment of GO biological processes in each cluster as determined through GREAT analysis. (E) Genome tracks for representative loci in the indicated 7 indicated T-cell groups. Green shading indicates differential peaks within clusters. (F) qPCR analyses of CCR7 and PRDM1 mRNA expression in the T cells sorted from matched PBMCs, PTs, and TT of patients with HBV + HCC (n = 7) and patients with HBV− HCC (n = 4). Data are shown as the mean ± SEM, assessed using a 2-tailed paired Student t test: *p < 0.05, **p < 0.01, ***p < 0.001, ****p < 0.0001. Abbreviations: ATAC-seq, assay for transposase-accessible chromatin with sequencing; FC, fold change; HD, healthy donor; PBMC, peripheral blood mononuclear cell; PT, paratumoral tissue; t-SNE, T-distributed stochastic neighbor embedding; Ti-ATAC-seq, TCR-index-ATAC sequencing; TT, tumor tissue.
Pairwise comparisons revealed substantial chromatin remodeling in the corresponding groups (Supplemental Figure S2A–E, http://links.lww.com/HEP/F15). Hierarchical clustering of the 6337 elements with the most variable differential DNA accessibility (fold change >2, false discovery rate <0.01, top 1000 peaks of each comparison) across the genome revealed 5 distinct clusters (Figure 1C, Supplemental Table S2, http://links.lww.com/HEP/F8). Peaks represented in cluster 4 were associated with genes involved in lymphocyte activation and exhaustion (Figure 1D), such as RBPJ, CCL4, CXCL13, CD244, BCL6, BATF, FASLG, BAK1, and TOX,13,14 which were highly accessible in paratumoral and TILs (Figure 1C). Interestingly, cluster 5, characterized by high accessibility at the loci of genes associated with immune activation, such as CD86, PRDM1, CTLA4, and NFATC2, was predominant in the TILs of HBV+ HCC (Figure 1C–E). To validate the finding of accessible chromatin at gene loci in HBV+ TILs, we subsequently investigated gene expression by performing RT-qPCR experiments. Consistently, CCR7 showed higher expression in T cells in PBMCs, whereas PRDM1 was elevated in TILs (Figure 1F). These data indicate the distinguished ensemble epigenomic profiles in comparison of T cells from different etiological factors and tissue specificity in HBV+ and HBV− HCC.
Enrichment of NFKB-, NFATC2-, and NR4A1-associated unique TCR-downstream epigenomic landscape in HBV+ tumor-infiltrating leukocytes
The epigenomic changes could be attributed to dynamic changes in the expression and binding of various transcription factors (TFs). Thus, we performed motif analysis to assess TF deviation scores and variation in T cells using chromVAR15 (Figure 2A–C, Supplemental Figure S2F–K, http://links.lww.com/HEP/F15). The data reveal distinct patterns of TF accessibility to DNA in T cells from these 7 groups (Figure 2D). Compared with circulating T cells in PBMCs, which were enriched in uniform TFs such as LEF1, ZBTB7A, ID4, and TCF4, paratumoral and TILs exhibited high activities of TFs involved in T-cell activation and differentiation, including the activator protein 1 factors, FOS and JUN (Figure 2D, E). We identified a core set of TF motifs with high TF activities in HBV+ TILs, including NFKB1, NFKB2, REL proto-oncogene, NF-KB Sub unit (REL), NFATC2, and NR4A1 (Figure 2D, E), which are involved in TCR-mediated immune signal activation and exhaustion.8 In addition, HBV+ TILs displayed higher DNA accessibility at the NR4A1, NFKB1, and REL loci, whereas HBV− TILs exhibited higher accessibility of TBET (Figure 2F). RT-qPCR and reanalysis of a published scRNA-seq data set of T cells from paratumoral and tumor tissues of patients with HBV− HCC (n = 5) and HBV+ HCC (n = 9)10 further confirmed this result, demonstrating higher expression of FOS, NFKB1, REL, NFATC2, and NR4A1 in TILs in patients with HBV+ HCC (Figure 2G, Supplemental Figures S1E and S3A, http://links.lww.com/HEP/F15). These results suggest that the TILs influenced by HBV infection acquired a TCR-activated epigenomic profile, especially enriched in NFKB-, NFATC2- and NR4A1-associated TCR-downstream core transcriptional circuitry and the epigenomic regulome.
FIGURE 2.

Epigenomic landscape of ensemble T cells in patients with HBV+ HCC. (A–C) Volcano plots showing the TF enrichment using the ChromVAR bias-corrected deviation between the HBV(−) HCC_PB and HBV(+) HCC_PB (A), HBV(−) HCC_PT and HBV(+) HCC_PT (B), and HBV(−) HCC_TT and HBV( + ) HCC_TT (C). p values were calculated using unpaired 2-tailed t tests. (D) Heatmap of TF deviation z-scores in the 7 indicated T-cell groups as mentioned in Figure 1B. (E) ChromVAR TF bias-corrected deviations overlaid on t-SNE projection of the indicated T-cell groups. Scale bars indicate the range of z-scores. (F) Genome tracks for representative loci of TFs in the 7 indicated T-cell groups. Green shading indicates differential peaks within clusters. (G) qPCR analyses of NR4A1, NFKB1, REL, and NFATC2 mRNA expression in the T cells sorted from matched PBMCs, PT, and TT of patients with HBV+ HCC (n = 7) and patients with HBV− HCC (n = 4). Data are shown as the mean ± SEM, assessed using a 2-tailed paired Student t test: *p < 0.05, **p < 0.01, ***p < 0.001, ****p < 0.0001. Abbreviations: PB or PBMC, peripheral blood mononuclear cell; PT, paratumoral tissue; TF, transcription factor; t-SNE, T-distributed stochastic neighbor embedding; TT, tumor tissue.
Gene expression analysis highlights FGFBP2-associated immune activation in HBV+ HCC
To further characterize the T-cell compartment involved in the response to HBV infection in HCC at the single-cell transcriptomic level using the scRNA-seq data set,10 we next reclustered 38,301 T and natural killer cells and applied a uniform manifold approximation and projection for dimensional reduction (Figure 3A). Twelve subclusters were identified, including 4 CD8+ and 4 CD4+ T-cell clusters (Figure 3A–D), and transcriptional signatures specific to each cluster were pinpointed (Figure 3E, Supplemental Table S3, http://links.lww.com/HEP/F9). Notably, we found a significantly increased frequency of cluster C3-CD8-FGFBP2 in patients with HBV+ HCC compared with patients with HBV− HCC (Figure 3F, G). We also validated this finding in our patient cohort using RT-qPCR, which revealed that FGFBP2 and FCGR3A showed higher expression on T-cell in HBV+ HCC as compared with HBV− HCC (Figure 3H). To gain insights into the functional states and relationship among the cluster C3-CD8-FGFBP2 with other CD8+ T cells, we applied the Monocle 2 algorithm16 to order T cells in pseudotime to characterize their developmental trajectories (Figure 3I). The trajectory analyses revealed that the cluster C3-CD8-FGFBP2 was uniquely separated from other CD8+ clusters (Figure 3J), with enhanced expression of genes involved in pathways of immune effector process, cell activation, and response to a virus, including FGFBP2, FCGR3A, GNLY, CCL3, and PRF1 (Figure 3J, K). In summary, these results suggest that TILs influenced by HBV infection acquired transcriptomic signatures associated with immune activation and effectors, which contributed to a FGFBP2+ CD8+ T-cell subpopulation in HBV+ HCC.
FIGURE 3.
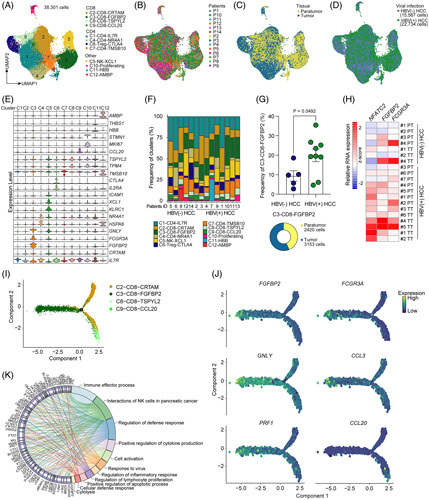
Characterization of gene expression associated with activated and effector FGFBP2+ CD8+ T cells enriched in HBV+ HCC. (A) The scRNA-seq (GEO: GSE156337) UMAP plot of 38,301 T and NK cells from 5 patients with HBV− HCC and 9 patients with HBV+ HCC, showing the formation of 12 clusters including CD4+, CD8+, and other clusters. The dots indicate individual cells, and the cell-type identity is indicated by colors. (B–D) UMAP plot showing the sample origin (B), tissue origin (C), and HBV infection state (D) of the patients. (E) Violin plot showing the expression profiles of those marker genes identified for the 12 clusters. (F) Frequencies of clusters in each patient. (G) Left: differences in the frequency of the cluster C3-CD8-FGFBP2 in the samples of patients with HBV− HCC and patients with HBV + HCC. A 2-sided unpaired Student t test was performed to determine the p values. Right: pie chart of the distribution of cluster C3-CD8-FGFBP2 in peritumoral and TTs. (H) Heatmap showing the relative mRNA expression of NFATC2, FGFBP2, and FCGR3A in the T cells sorted from PT and TT of patients with HBV + HCC (n = 7) and patients with HBV− HCC (n = 4). (I) Trajectory manifold of CD8 + T cells using the Monocle 2 algorithm. Solid and dotted lines represent distinct cell trajectories defined by gene expression levels. (J) Cell trajectory projections of the indicated gene expression changes based on the manifold. (K) Detailed relationships between the top 64 most significantly upregulated genes (on the left side of the graph) of cluster C3-CD8-FGFBP2 and major pathways (-log10 p value > 5, on the right of side) annotated by Metascape analysis are shown in a Circos graph. Abbreviations: NK, natural killer; PT, paratumoral tissue; scRNA-seq, single-cell RNA sequencing; TT, tumor tissue; UMAP, uniform manifold approximation and projection.
Single-cell epigenetic landscape analysis highlights FGFBP2-associated immune activation in HBV+ HCC
The epigenomic and transcriptomic-immune activation of HBV+ TILs described, thus far inspired us to further characterize the T-cell compartment involved in the response to HBV infection and each TCR signaling pathway in HCC at the single-cell epigenetic level. Recently, we established Ti-ATAC-seq,9 which integrates TCR clonality with the single-cell chromatin accessibility profile of the same single T-cell. However, the low throughput of plate-based Ti-ATAC-seq limited its broad usage. Through improvements inspired by the split-pool strategy of library construction of SHARE-seq17 and SPLiT-seq,18 including transposition and TCR-reverse transcription in bulk cells and 3 rounds of barcode ligation, we report here a version of Ti-ATAC-seq. 2 with high throughput and highly uniform quality (Figure 4A and Supplemental Figure S4A–F, http://links.lww.com/HEP/F15). Notably, we designed a novel library structure that is suitable for sequencing on a DNBSEQ-T7 sequencer (MGI Tech) with a paired-end 150 bp length (Supplemental Figure S4A, http://links.lww.com/HEP/F15) to reduce the sequencing cost by 9.7-fold compared with those split-pool strategy methods such as SHARE-seq and SPLiT-seq.
FIGURE 4.

The developmental programs of the HBV-related T-cell clusters. (A) Workflow of Ti-ATAC-seq. 2 to measure scATAC and scTCR from the same individual T cells. (B) UMAP plot showing 12 T-cell clusters of 16,541 scATAC-seq profiles from peritumoral and TTs of 11 HBV + HCC and 1 HBV− HCC patients. The dots indicate individual cells and the cell-type identity is indicated by colors. Pie chart showing the frequency of each cluster (right). (C) The proportions of clusters in each patient. (D) UMAP plot (left) and pie chart (right) showing the tissue origin. (E) The gene scores of the indicated genes overlaid on UMAP embedding. (F) The TF deviation scores of indicated TFs overlaid on UMAP embedding. (G) Aggregated single-cell genome tracks for the indicated clusters at the FGFBP2, PRF1, CTLA4, and TOX loci with peak Co-access. The Co-access is indicated by the inferred peak-to-gene links for distal regulatory elements. Blue shading indicates differential peaks within clusters. (H–J) Volcano plots showing the TF enrichment using the chromVAR bias-corrected deviation between the cluster 13-CD8_Tex-TOX and other T cells (H), cluster 12-Treg-CTLA4 and other T cells (I), and cluster 5-CD8_terminal Teff-FGFBP2 and other T cells (J). The p value was calculated using a 2-sided pairwise Wilcoxon test and the false discovery rate was corrected using the Benjamini-Hochberg procedure. (K) Lineage trajectories of exhausted (trajectory 1) and effector (trajectory 3) CD8 + T-cell states and Treg (trajectory 2) cell states. Lines represent double-spline fitted trajectories across pseudotime. (L–N). Pseudotime heatmap showing the ordered cis-element accessibility (left) and TF motif accessibility (right) in trajectory 1 (L), trajectory 2 (M), and trajectory 3 (N). Abbreviations: ATAC-seq, assay for transposase-accessible chromatin with sequencing; Co-access, co-accessibility; FDR, false discovery rate; scATAC-seq, single-cell ATAC-seq; RT, reverse transcription; scTCR-seq, single-cell TCR sequencing; TCR, T-cell receptor; Teff, effector T cells; Tem, effector and memory T-cell; Tex, exhausted T-cell; TF, transcription factor; Ti-ATAC-seq, TCR-index-ATAC sequencing; Tmem, memory T-cell; Tn, naïve T-cell; Treg, regulatory T-cell; TT, tumor tissue; UMAP, uniform manifold approximation and projection.
Using these approaches, we obtained 16,541 single T cells (Ti-ATAC-seq. 2: 15,897 T cells; Ti-ATAC-seq: 644 T cells) that passed the ATAC-seq quality control threshold from paratumoral and tumor-infiltrating αβ T cells of 12 patients with HCC (11 HBV+ HCC and 1 HBV− HCC) (Supplemental Figure S4G–I, http://links.lww.com/HEP/F15). Thirteen scATAC-seq clusters were identified and visualized with uniform manifold approximation and projection (Figure 4B–D). We annotated these clusters based on the chromatin accessibility of cis-elements (ATAC-seq peaks) (Supplemental Figure S4J, http://links.lww.com/HEP/F15), gene scores of canonical marker genes that demonstrate the aggregate accessibility of several enhancers linked to the indicated genes (Supplemental Figure S4K, S5A, http://links.lww.com/HEP/F15 Supplemental Table S4, http://links.lww.com/HEP/F9), and TF activity (ChromVAR15 bias-corrected TF deviation scores) (Supplemental Figure S4L, S5B, http://links.lww.com/HEP/F15 Supplemental Table S4, http://links.lww.com/HEP/F9). For example, tumor-enriched clusters 12 (Treg-CTLA4) and 13 (CD8_Tex-TOX; Tex) were defined as Treg cells and CD8+ Tex cells, respectively, with high gene scores predominantly for CTLA4, HAVCR2, LAYN, PDCD1, and TOX (Figure 4D–G, Supplemental Figure S4K, http://links.lww.com/HEP/F15, Supplemental Table S4, http://links.lww.com/HEP/F9). Clusters 7 (Intermediate), clusters 8 (CD8_Teff-CX3CR1; effector T cells (Teff)), and clusters 5 (CD8_Terminal Teff−FGFBP2) were characterized by gradually increased gene accessibility of effector genes including FGFBP2, GZMB, IFNG, and PRF1, as well as gradually increased TF activities of TBX21 and EOMES, commonly associated with sequential cytotoxic functional status from intermediate to effector and then to terminal effector states (Figure 4E–G, Supplemental Figure S4J, S4K, http://links.lww.com/HEP/F15). In particular, cluster 5 showed the highest gene scores of FGFBP2, FCGR3A, PRF1, IFNG, KLRF1, CCL3, CCL4, and CCL5 (Supplemental Figure S5C, http://links.lww.com/HEP/F15), associated with immune effector process, cell activation, and response to virus pathways (Supplemental Figure S5D, http://links.lww.com/HEP/F15). These cis-element signatures and functional statuses of cluster 5 were remarkably similar to those of cluster C3-CD8−FGFBP2 from scRNA-seq analyses (Figure 3I–J). These results reflect the FGFBP2+ -associated epigenetic and transcriptional signatures of T cells enriched in HBV+ HCC.
Ti-ATAC-seq. 2 profiles the developmental programs of the HBV-related T-cell clusters
One striking feature of our finding was that a core set of TCR signal-mediated TF motifs, including NFKB1/2, REL, NFATC2, and NR4A1, was enriched in HBV+ TILs from bulk-cell ATAC-seq analyses (Figure 2D). We then asked, which T-cell compartments of scATAC-seq profiles contributed to these epigenomic signatures. We measured TF activities in single cells and aggregated them by cluster. Compared with other T cells, clusters 12 (Treg-CTLA4) and 13 (CD8_Tex-TOX) exhibited the highest activities of NR4A1, NFATC2, NFKB1/2, and REL (Figure 4H–J, Supplemental Figure S5E, http://links.lww.com/HEP/F15) and showed high similarities in the peak matrix, gene score matrix, and TF deviation score matrix (Supplemental Figure S5F, http://links.lww.com/HEP/F15), likely indicating a shared regulatory program for these 2 clusters of cells. Thus, these results indicate that we identified 3 HBV-related T-cell subpopulations, clusters 5, 12, and 13, that specifically participated in the response to the HBV+ TME through cis-elements and gene expression changes and TF motif regulation, respectively.
To understand the developmental dynamics of the three HBV-related T-cell clusters, we used the scATAC-seq profiles to orchestrate 3 cellular developmental trajectories based on the sequential functional status: (1) trajectory 1, from intermediate to CD8 Tex cells; (2) trajectory 2, from naïve CD4 to Treg cells; and (3) trajectory 3, from intermediate to CD8 terminal Teff cells (Figure 4K). In aggregate, the analyses of cis-elements and TF activity demonstrate that Treg-CTLA4 and CD8 Tex cells largely shared the regulatory programs but were distinct from those of CD8 terminal Teff cells (Figure 4L–N). For instance, in the end, stage of trajectories, trajectories 1 and 2 shared the cis-element accessibility in the exhaustion-associated gene loci, including HAVCR1, TOX, CXCL13, CTLA4, and ICOS, and shared accessibility at TCR-downstream TF motifs, including NR4A1, NFKB1, and REL, whereas trajectory 3 was accompanied by increased cis-element accessibility in effector-related gene loci, including CCL3, KLRD1, and PRF1, and increased accessibility at the TBET and EOMES TF motifs (Figure 4L–N). Collectively, these differential chromatin accessibility results reflect the epigenomic regulatory programs of HBV-related T-cell subsets that contribute to the formation of an immunosuppressive, exhausted, and effective status in the HBV+ TME.
Characterization of T-cell receptor clonality and HBV specificity of HBV+ tumor-infiltrating leukocytes
Persistent antigen exposure induces chronic TCR signal-driven dysfunctional T-cell accumulation in cancer.19 In this virus-induced malignancy, HBV+ TILs encounter antigens both from the virus and from carcinogenetic mutations, and new strategies are required to investigate the antigenicity. To determine TCR repertoires in HBV+ TILs, we sequenced 16,442 paired TCRαβ (Ti-ATAC-seq. 2: 10,928 TCRs; Ti-ATAC-seq: 1,884 TCRs; scTCR-seq: 3,630 TCRs) of paratumoral and Ts from 25 patients with HCC (3 HBV− HCC and 22 HBV+ HCC) (Figure 5A, B, Supplemental Figure S6A–D, http://links.lww.com/HEP/F15). Overall, 43 public TCR clonotypes were shared among 25 patients (Figure 5C). Similarly, we identified 9 public TCRs that were shared among our data sets with the published HCC TCR repertoire5 and HBV-specific TCRβ repertoire of patients with chronic HBV infection20 (Supplemental Figure S7A, B, http://links.lww.com/HEP/F15). To test the HBV specificity of the public and expanded T-cell clonotypes, we synthesized HBV peptide libraries of three hundred eight 15 mers peptides overlapping by 10 amino acids and covering the entire sequence of HBV genotype C (Supplemental Table S5, http://links.lww.com/HEP/F11) and performed a luciferase reporter assay as described.21 We identified 6/13 TCR clonotypes that were positive for HBV reactivity (Figure 5D).
FIGURE 5.

Characterization of TCR clonality and HBV specificity of T cells in HBV+ HCC. (A) The number of cells, unique clonotypes, and frequencies of TCR clonotypes by size (size = 1, size >1, size >3, size > 7) in the TCR repertoire analyses of PT and TT of patients with HBV+ HCC (n = 22) and HBV− HCC (n = 3). (B) Sankey plot showing the VJ usage of 16,442 αβ TCRs in HCC patients. (C) Heatmap showing 43 public TCR clones that shared among 25 patients with HCC. The colors indicate the counts of the TCR clonotypes. (D) Luciferase reporter assay of 13 TCR clones. (E) Left: number of CD69+ CD137+ HBV-specific T cells among 1×10⁵ T cells; the labeled percentages indicate the mean fractions of HBV-specific T cells among cells stimulated with HBV peptides or HBV virus. Right: the frequency of HBV-specific CD4+ and CD8+ T cells in HBV-specific T cells. (F) Table showing 3 representative GLIPH-predicted HBV-specific TCR groups with “SQDRGY%”, “ERGI”, and “SE%GNTE” patterns, respectively. (G) Luciferase reporter assays of three TCR clones with “SQDRGY%”, “ERGI”, and “SE%GNTE” patterns, respectively. n.s, p > 0.05, *p < 0.05, **p < 0.01, ***p < 0.001, Student t test. Abbreviations: GLIPH, grouping of lymphocyte interactions by paratope hotspots; PT, paratumoral tissue; TCR, T-cell receptor; TRAJ, TCR alpha joining gene; TRAV, TCR alpha variable gene; TRBJ, TCR beta joining gene; TRBV, TCR beta variable gene; TT, tumor tissue; VJ, TCR V and J gene.
To directly identify the HBV-specific T cells, TILs from 7 patients with HBV+ HCC were stimulated with purified HBV virus (Supplemental Figure S8A, http://links.lww.com/HEP/F15) or HBV peptide libraries. We sorted CD69+ CD137+ T cells as antigen-activated T cells22 and then subjected them to scTCR-seq (Supplemental Figure S8B–D, http://links.lww.com/HEP/F15). For all tested samples, 0.064% and 0.13% of the T cells were reactive to HBV peptide libraries and HBV virus, respectively, with the majority of virus and peptide-reactive T cells being CD8 + cells (Figure 5E). To broadly dissect the antigen specificity of TCR clonotypes, we used a recently described GLIPH algorithm to identify HBV-specific CDR3β motifs.12 As input for the GLIPH analysis, we collected 25,223 αβ TCR clonotypes with unknown HBV antigen specificity in the HCC TIL repertoires (our data set: 16,442 TCRs; published HCC TCR repertoire5: 4032 TCRs) and those with known HBV specificity23 (4749 TCRs). In total, we identified 3366 unique TCR motifs, among which 1020 were specific to HBV, and we predicted 710 HBV-specific TCRs in 5 HBV+ HCC patients carrying the allele of HLA-A*11 allele (Supplemental Table S6, http://links.lww.com/HEP/F12). We also selected three TCRs from three HBV-specific groups for luciferase reporter assays (Figure 5F) and validated their HBV reactivity (Figure 5G). These results indicate that these expanded clones in HBV+ HCC TILs are specific for HBV-derived antigens and that the TCRs shared across patients may be potent targets for HBV+ HCC immunotherapy. Therefore, it is possible to analyze the chromatin accessibility landscape of individual T cells together with the antigen specificity of TCRs.
Epigenomic regulatory programs of HBV-specific T cells revealed by integrated chromatin accessibility and T-cell receptor specificity analysis
Although many expanded clones of HBV+ TILs respond to HBV antigens, these specific T cells do not seem robust for antitumor surveillance as HBV+ HCC is a difficult-to-treat malignancy with drug resistance and vascular metastasis. Given this concern, we used Ti-ATAC-seq. 2 to further explore the intracellular epigenetic signals and status in these HBV-specific T cells based on integrative analyses of chromatin accessibility and TCR clonality and specificity. The comparisons of the cell expansion ability of 6331 T cells that both had paired TCR sequences and ATAC revealed a gradually elevated trend of clonal proliferation from cluster 7 (intermediate) to cluster 8 (CD8_Teff-CX3CR1) to cluster 5 (CD8_Terminal Teff-FGFBP2) and a decrease from cluster 7 to cluster 13 (CD8_Tex-TOX; Figure 6A). In contrast to the decreased clonal proliferation of cluster 13, cluster 12 (Treg-CTLA4) showed significantly upregulated clonal expansion (Figure 6A), which highlights that the shared TCR-downstream epigenomic regulatory program promoted the differentiation of CD8+ T exhaustion and tumor-infiltrating Treg cell effective status.
FIGURE 6.
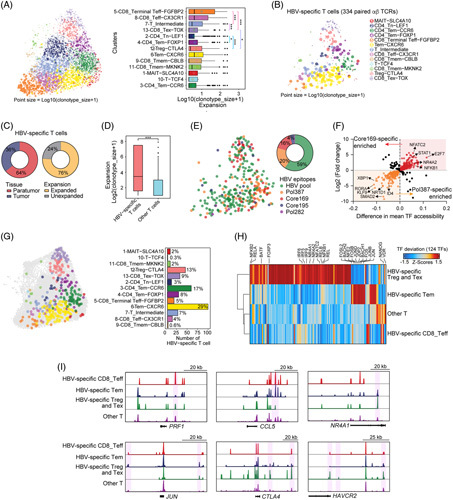
Epigenomic signatures of HBV-specific T cells revealed by integrated chromatin accessibility and TCR specificity. (A) Left: the sizes of T-cell clonotypes overlaid on the UMAP projection. The spatial distribution of cells is defined in Figure 4B. Right: boxplot showing the sizes of the TCR clonotypes from the clusters. (B) The clonotype size of 334 HBV-specific T cells overlaid on the UMAP projection. The HBV antigen specificity of TCRs was predicted by the GLIPH algorithm. (C) Pie plot showing the tissue distribution (left) and clonal expansion (right) of HBV-specific T cells. (D) Boxplots showing the differences in T-cell expansion as measured by log2 (clonotype size + 1) between HBV-specific T cells and other T cells. (E) The UMAP plot (left) and pie plot (right) showing the GLIPH-predicted HBV epitopes of HBV-specific T cells. (F) The TF enrichments of HBV epitope core 169-specific T cells and pol 387-specific T cells as indicated by differences in mean TF accessibility and log2 FC of the chromVAR bias-corrected deviation. (G) Left: the UMAP plot showing the cell states of HBV-specific T cells, which are shown in colors. Right: the cell numbers in cell states of HBV-specific T cells with the proportions are labeled. (H) Heatmap showing the chromVAR bias-corrected deviations in the 124 most variable TFs across HBV-specific Treg and Tex cells, HBV-specific Tem cells, HBV-specific CD8_Teff cells and other T cells (difference in mean TF accessibility ≥0.05). (I) Aggregated single-cell genome tracks for the T cells at the indicated gene loci. The boxplots denote the median with the quartile range (25%–75%), and the length of whiskers represents 1.5 × the IQR. ***p < 0.001, Student t test. Abbreviations: FC, fold change; GLIPH, grouping of lymphocyte interactions by paratope hotspots; IQR, interquartile range; TCR, T-cell receptor; Teff, effector T cells; Tem, effector and memory T cells; Tex, exhausted T-cell; TF, transcription factor; Treg, regulatory T-cell; UMAP, uniform manifold approximation and projection.
Next, we focused on the analyses of 334 GLIPH-predicted HBV-specific T cells that had paired TCR sequences and ATAC (Figure 6B). Notably, 76% of HBV-specific T cells were substantially clonally expanded (Figure 6B, C), and the clonal expansion potential of the HBV-specific T cells, as indicated by the size of the clonotype, was much greater than that of other T cells (Figure 6D), indicating an effective response of HBV-specific T cells to HBV antigens in the TME. Of the 4 HBV epitopes (HBVcore169, HBVcore195, HBVpol387, and HBVpol282), HBVpol387 and HBVcore169 were targeted by 20% and 16% of T cells, respectively (Figure 6E). Furthermore, a comparison of HBVpol387- and HBVcore169-specific T cells showed high TF activities for ID4, RORA, and SMAD2 TFs in HBVcore169-specific T cells and for TCR-downstream epigenomic regulatory TF motifs, including NFATC2, NFKB1, and NR4A2, in HBVcore169-specific T cells (Figure 6F), which suggests that T cells targeting HBVcore169 differentiated preferentially into exhausted or immunosuppressive status.
To assess the phenotypic landscape of HBV-specific T cells, we overlaid the HBV-specific T cells on the uniform manifold approximation and projection of scATAC-seq profiles and enumerated the frequencies of the functional status of HBV-specific T cells (Figure 6G). We observed that 54% (cluster 3: 17%; cluster 4: 8%; cluster 6: 29%) of the HBV-specific T cells belonged to the effector and memory T cells subset, 13% and 9% of cells fell into Treg-CTLA4 and CD8_Tex-TOX status, whereas only a small fraction of cells (9%) were effector status (Figure 6G). We then measured TF deviation scores and cis-element accessibility in HBV-specific T cells and aggregated them by functional status. These results showed that HBV-specific Treg and Tex cells exhibited high activities of the TCR-downstream epigenomic regulatory TF motifs including NFATC2, NFKB1, and NR4A1, and also showed increased accessibility at the CTLA4, HAVCR2, and NR4A1 loci; however, the HBV-specific effector and memory T cells showed high activities of FOS, JUN, and BACH1/2 and were more accessible in CCL5 and JUN loci (Figure 6I). These results suggest the distinct epigenomic regulatory programs of HBV-specific T cells. Interestingly, the TFs identified in HBV-specific Treg and Tex cells were remarkably similar to those in the profiles of HBV+ TILs obtained from bulk-cell ATAC-seq analyses (Supplemental Figure S9A–D http://links.lww.com/HEP/F15). Thus, our in-depth integrative analyses of accessible chromatin and TCR clonality and specificity highlight the critical roles of HBV antigens in T-cell divergent differentiation through global chromatin accessibility remodeling and accurate regulatory programs.
Viral antigens mediate the communication of HBV-specific CD8 and regulatory T-cell
To validate the phenotype of HBV-specific CD8+ and Treg cells characterized in our epigenomic analysis, we further investigated the differential gene expression and TCR specificity of T cells based on scRNA-seq data of HBV+ HCC5 (Figure 7A). Similarly, we explored TCR specificity and identified HBV-specific T cells using the GLIPH algorithm (Figure 7B, Supplemental Table S6, http://links.lww.com/HEP/F12). The upregulated genes included IFNG, GZMB, PDCD1, and HAVCR2, suggesting that the pathways of lymphocyte activation, cytotoxicity, T-cell apoptotic process, and regulation of TCR signaling pathways were enriched in HBV-specific CD8+ T cells (Figure 7C, D, Supplemental Table S7, http://links.lww.com/HEP/F13). Compared with other Treg cells, HBV-specific Treg cells expressed higher levels of IL2RA, PDCD1, HAVCR2, and ICOS, indicating an enhanced immunosuppressive function of HBV-specific Treg cells in the TME (Supplemental Figure S10A, http://links.lww.com/HEP/F15). These results highlight the regulatory program of HBV-specific CD8 and Treg cells that we observed in the HBV-specific Treg and Tex cells on Ti-ATAC-seq. 2.
FIGURE 7.

The transcriptomic regulatory programs of HBV-specific Treg cells and CD8 + T cells. (A) The scRNA-seq (GEO: GSE98638) UMAP projection of the Treg cells (n = 841) and CD8+ T cells (n = 1189) from patients with HBV+ HCC. (B) The scRNA-seq UMAP projection of HBV-specific Treg cells (n = 24) and CD8+ T cells (n = 48) shown in a different color from patients with HBV+ HCC. (C) Pathway enrichment of marker genes enriched in HBV-specific CD8+ T cells (top) and HBV-specific Treg cells (bottom) using Metascape analysis. (D) Violin plot showing the expression profile of those genes from aggregated HBV-specific CD8+ and other CD8+ T cells. The expression is measured as the log2 (TPM + 1). (E) Heatmap showing the outgoing communication patterns of secreting cells (left) and incoming communication patterns of target cells (right), as well as signaling pathways. (F) The expression patterns of signaling genes involved in the inferred IL2 (left) and FASLG (right) signaling networks. (G) Disease-free survival curve, comparing patients in the TCGA HCC cohort with high and low expression of FASLG, analyzed by GEPIA2. (H) Shown is the probability of relapse for patients grouped by serum HBV DNA titer (high HBV DNA titer, n = 8; low HBV DNA titer, n = 11). (I) Correlation of Treg/CD8 + T-cell ratios and tumor size. The p value was calculated using an unpaired 2-tailed t test. (J) Schematic of regulatory programs controlling the antitumor or antiviral responses in HBV-related T-cell subsets (left) and HBV-specific T cells (right). Abbreviations: CCL, chemokine (C-C motif) ligand; CXCL, chemokine (C-X-C motif) ligand; FASLG, Fas ligand; MHC, major histocompatibility complex; PD-L1, programmed cell death-ligand 1; scRNA-seq, single-cell RNA sequencing; TCGA, The Cancer Genome Atlas; TME, tumor microenvironment; TPM, transcript per million; Treg, regulatory T-cell; UMAP, uniform manifold approximation and projection.
To further analyze the intercellular communication networks among HBV-specific CD8+ and Treg cells, we applied the recently described algorithm CellChat24 to predict the major signaling inputs and outputs for cells and signaling pathways. This analysis uncovered 7 outgoing and incoming signal patterns for HBV-specific or other CD8 and Treg cell groups (Figure 7E). Interestingly, we observed abundant FASLG signaling interactions between HBV-specific CD8+ and Treg cells, in which the FASLG ligands and receptors were predominantly expressed in HBV-specific CD8+ and Treg cells, respectively (Figure 7E, F). FASLG exerts dual functions, receiving signals facilitating the antigen-specific proliferation of CD8+ T cells and delivering a death signal through its receptor FAS.25 Therefore, high FASLG expression in HBV-specific CD8+ T cells could underlie their capacity for antigen-driving proliferation, as observed in Figure 6D, to target FAS+ tumor and Treg cells. To test this hypothesis, we determined the spatial transcriptome architecture11 of CD8, FOXP3, FASLG, and FAS expression in nontumor, leading-edge, and tumor sections of 3 patients with HBV+ HCC and HBV− HCC (Supplemental Figure S10B, http://links.lww.com/HEP/F15). Spots expressing CD8A and FOXP3 were enriched in leading-edge and tumor sections of HBV+ HCC relative to those of HBV− HCC. Moreover, more double-positive spots expressing CD8A and FOXP3, CD8A and FASLG, and FOXP3 were congregated with spots expressing FAS in the HBV+ HCC sections, supporting the existence of FASLG signaling interactions between HBV-specific CD8 + and Treg cells (Supplemental Figure S10B, http://links.lww.com/HEP/F15). In addition, greater FASLG expression in HCC was associated with prolonged disease-free survival (Figure 7G).
We also assessed the relationship of HBV infection and the presence of tumor-resident Treg cells (Figure S10C, http://links.lww.com/HEP/F15) with tumor progression. The data suggest a higher probability of relapse in the high HBV DNA titer cohort, and the tumor progression strongly and positively correlated with the Treg/CD8+ ratio (Figure 7H, I). Taken together, these data suggest that HBV antigens drive a preferential expansion of tumor resident Treg cells that are associated with poor prognosis in patients with HCC.
DISCUSSION
In this study, we comprehensively investigated the HBV-related and HBV-specific epigenomic and transcriptomic regulatory programs with TCR clonality and TIL specificity in HDs and patients with HBV+ HCC and HBV− HCC at the bulk-cell and single-cell resolution (Figure 7J). Using the GLIPH algorithm and luciferase reporter assays, we predicted and validated the existence of HBV-specific T cells. One striking feature of our findings was that NFKB, NFATC2, and NR4A1 were associated with unique TCR-downstream core transcriptional circuitry and epigenomic regulome that were particularly enriched in HBV+ TILs. Inspired by this finding, we applied an advanced single-cell approach, Ti-ATAC-seq. 2, to further analyze single-cell TCR clonality and specificity by detecting the single-cell chromatin accessibility landscape at a large scale. With this strategy, we identified 3 HBV-related T-cell compartments involved in the response to the HBV+ TME, including paratumor-enriched FGFBP2+ CD8+ T cells, tumor-infiltrating exhausted TOX+ CD8+ T cells, and highly-accessible-CTLA4 Treg cells, which repopulated the FGFBP2+ -associated transcriptional signatures and TCR-downstream core set of TF motifs, respectively. We also constructed the developmental trajectories to reveal the epigenomic regulatory programs of these HBV-related T-cell subsets that contributed to the development of immunosuppressive, exhausted, or effective status in the HBV+ microenvironment.
CD8+ T cells are widely considered to play a pivotal role in controlling HBV infection.26 Several studies have characterized the features of HBV-specific CD8+ T cells that are not terminally exhausted but have long-term memory and polyfunctionality in chronically HBV-infected and HBV+ HCC patients and are even associated with the disease progression.7,13,20,27 Consistent with these findings, our results showed that 54% of the HBV-specific T cells had effector and memory status and showed elevated accessibility at the CCL5, CD28, and CXCR4 loci, which are controlled by a core set of TF motifs including JUN, FOS, BACH1/2, and NFE2. In addition, we detected the HBV-specific Treg (13%) and Tex (9%) cells, which were regulated by a shared program of the NFKB1/2-, REL-, NFATC2-, and NR4A1-associated unique TCR signal-associated epigenomic regulome.
In our study, we validated and assessed the phenotypic landscape of HBV-related T-cell subsets and HBV-specific T cells with single-cell scRNA-seq data sets and spatial transcriptomes. We identified an HBV-related FGFBP2+ CD8+ T subset that expressed high levels of FGFBP2, FCGR3A, GNLY, CCL3, and PRF1, which corresponded to a TBET- and EOMES-regulated terminal Teff CD8+ T-cell cluster in the scATAC-seq profiles. We also identified HBV-specific T cells and characterized their viral antigens-mediated communication patterns. Surprisingly, HBV-specific CD8+ T cells expressed high levels of FASLG ligand, which is linked to both HBV-specific Treg cells and tumor cells through the FASLG-FAS cell-cell communication. Interestingly, we identified HBV-specific Treg cells featured with tumor-resident memory and persistent antigen specificity, indicating a direct role in promoting immune suppression. Similar to that of the tumor-infiltrating Treg cells from the Ti-ATAC-seq. 2 profiles, the HBV-specific Treg cells exhibited high TF activities of NFKB1/2, REL, NR4A1/2, and NFATC2. Given that REL has been validated to be critical in activated Treg cell generation and maintenance,28 we hypothesized that HBV-specific Treg cells have enhanced immunosuppression compared with other Treg cells. Consistent with this hypothesis, we observed higher expression of IL2RA, PDCD1, HAVCR2, and ICOS, as well as of the TFs JUN and REL, in HBV-specific Treg cells than in other Treg clones. Importantly, our data suggest that the Treg/CD8+ ratio was strongly and positively correlated with tumor progression.
Notably, prior studies found that almost 25% of HCC cases express markers of an inflammatory response, and feature adaptive or exhausted immune responses,3,4 and single-cell transcriptomes also reveal the T-cell heterogeneity in HCC with several functional clusters.5,10 Here, we identified three HBV-related T-cell subsets corresponding to Teff-FGFBP2, Treg-CTLA4, and Tex-TOX, with the highest and lowest clonal expansion in Teff-FGFBP2 and Tex-TOX, respectively. A common and shared TCR signal epigenomic regulome regulated the differentiation of HBV-related Treg-CTLA4 and CD8-Tex-TOX cells but drove greater clonal expansion in HBV-related Treg-CTLA4 subset. We also investigated HBV-specific T cells and their clonal expansion, as well as their functional status. Interestingly, HBV-specific T cells showed significantly greater clonal expansion than other T cells, highlighting a persistent response of HBV-specific T cells to HBV antigens in the TME. This persistent stimulation of TCR signaling could also drive T-cell exhaustion and the loss of effector cells. Therefore, only a small fraction (9%) of HBV-specific Teff was detected. Considering the different T-cell status distributions and abundances of the HBV-related T-cell subsets and HBV-specific T cells, the formation and differentiation of these HBV-related T-cell subsets could be somehow attributed to the tumor antigens and special inflammatory TME of HBV + HCC. Furthermore, chronic hepatitis B contributes to a HBV-related and HBV-specific suppressive immune microenvironment, including HBV-related Treg subsets and HBV-specific Treg cells, respectively, which leads to overwhelming T-cell dysfunction in the TME. This phenomenon may explain why immune checkpoint inhibitor therapy is more effective in patients with HBV+ HCC than in those with HBV- HCC. Such persistent HBV antigen exposure also results in a subset of HBV-specific T cells exhibiting effector and memory properties. Therefore, patient prognosis depends on the strength of these HBV-specific effectors and memory T cells in the TME. Accordingly, a recent study reported that nonterminally exhausted memory HBV-specific T cells showed effective antitumor responses and were correlated with relapse-free survival in HCC.7
In summary, our multimodal profiles revealed the precise epigenomic and transcriptomic regulatory programs of HBV-related T-cell subsets and HBV-specific T cells (Figure 7J) and also provide many therapeutic opportunities for cancer immunotherapy, suggesting that HBV infection is a major factor that divergently reshapes the adaptive immune responses in HBV + HCC. Thus, inhibiting the virus activity may be an important first step in developing effective antitumor therapies.
AUTHOR CONTRIBUTIONS
Liang Chen, Pengyuan Yang, and Maojun You: conceived and designed the study. Maojun You and Yanan Gao: performed most experiments. Runze Xie and Junliang Liu: assisted with experiments. Liang Chen and Maojun You: conducted most bioinformatics analyses. Runze Xie: assisted with conducting bioinformatics analyses. Fu-Sheng Wang, Junliang Fu, Zhenyu Zhu, Lingzhan Meng, Shunda Du, and Zhixian Hong: collected patient samples and clinical data. Liang Chen, Maojun You, and Yanan Gao: wrote the manuscript.
ACKNOWLEDGMENTS
The authors thank all the healthy donors and HCC patients involved in this project. Also, J. Jia and S. Meng (core facility of Institute of Biophysics, Chinese Academy of Sciences) for technical assistance in the FACS analysis, Dr. Zhimin Wang for assistance in bioinformatics analysis; T. N. from the HPC-Service Station in Center for Biological Imaging (CBI), Institution of Biophysics, Chinese Academy of Science; Dr. Yi Zhang, and Dr. Yuzhang Wu for critical suggestions and reading of the manuscript.
FUNDING INFORMATION
Liang Chen was supported by National Natural Science Foundation Outstanding Youth Science Fund Project. Maojun You was supported by Special Research Assistant Project of Chinese Academy of Sciences and fellowship of China Postdoctoral Science Foundation (2021M703419). Yanan Gao was supported by Beijing Municipal Science and Technology Commission, Administrative Commission of Zhongguancun Science Park (Z221100007922030). The remaining authors have no conflicts to report.
CONFLICTS OF INTEREST
The authors have no conflicts to report.
Supplementary Material
Footnotes
Funding information: This work was supported by a grant from Chongqing International Institute for Immunology (No. 2020YJC02 to P.Y.), Strategic Priority Research Program of CAS (XDB37030206 to P.Y.), National Natural Science Foundation of China (82225037 to P.Y.).
Abbreviations: ATAC-seq, assay for transposase-accessible chromatin with sequencing; CCL, chemokine (C-C motif) ligand; Co-access, co-accessibility; CXCL, Chemokine (C-X-C motif) ligand; FASLG, Fas ligand; FC, fold change; FDR, false discovery rate; GLIPH, grouping of lymphocyte interactions by paratope hotspots; HDs, healthy donors; IQR, interquartile range; MHC, major histocompatibility complex; NK, natural killer; PBMC, peripheral blood mononuclear cells; PD-L1, programmed cell death-ligand 1; PT, paratumoral tissues; REL, Proto-Oncogene, NF-KB Sub unit; RT, reverse transcription; scATAC-seq, single-cell ATAC seq; scRNA-seq, single-cell RNA sequencing; scTCR-seq, single-cell TCR sequencing; TCGA, The Cancer Genome Atlas; TCR, T-cell receptor; Teff, effector T cells; Tem, effector and memory T cells; Tex, exhausted T; Ti-ATAC-seq, TCR-index-ATAC sequencing; TFs, transcription factors; TILs, tumor-infiltrating Leukocytes; TME, tumor microenvironment; Tmem, memory T-cell; Tn, naïve T cells; TOX, thymocyte selection associated high mobility group box; TPM, transcript per million; TRAJ, TCR alpha joining gene; TRAV, TCR alpha variable gene; TRBJ, TCR beta joining gene; TRBV, TCR beta variable gene; Treg, regulatory T-cell; t-SNE, T-distributed stochastic neighbor embedding; TT, tumor tissues; UMAP, uniform manifold approximation and projection.
Maojun You and Yanan Gao contributed equally to this work.
Supplemental Digital Content is available for this article. Direct URL citations are provided in the HTML and PDF versions of this article on the journal's website, www.hepjournal.com.
Contributor Information
Maojun You, Email: m18844191897@163.com.
Yanan Gao, Email: gyn9876@sina.com.
Runze Xie, Email: xierunze17@mails.ucas.ac.cn.
Zhenyu Zhu, Email: zhuzy@163.com.
Zhixian Hong, Email: zqyhzx@sina.com.
Lingzhan Meng, Email: mlzno1@163.com.
Shunda Du, Email: dushd@pumch.cn.
Junliang Liu, Email: liujunl1618@yeah.net.
Fu-Sheng Wang, Email: fswang@163.com.
Pengyuan Yang, Email: pyyang@ibp.ac.cn.
Liang Chen, Email: lchen1@shu.edu.cn.
REFERENCES
- 1.Yang JD, Hainaut P, Gores GJ, Amadou A, Plymoth A, Roberts LR. A global view of hepatocellular carcinoma: trends, risk, prevention and management. Nat Rev Gastroenterol Hepatol. 2019;16:589–604. [DOI] [PMC free article] [PubMed] [Google Scholar]
- 2.Haber PK, Puigvehi M, Castet F, Lourdusamy V, Montal R, Tabrizian P, et al. Evidence-based management of hepatocellular carcinoma: systematic review and meta-analysis of randomized controlled trials (2002-2020). Gastroenterology. 2021;161:879–98. [DOI] [PMC free article] [PubMed] [Google Scholar]
- 3.Sia D, Jiao Y, Martinez-Quetglas I, Kuchuk O, Villacorta-Martin C, Castro de Moura M, et al. Identification of an immune-specific class of hepatocellular carcinoma, based on molecular features. Gastroenterology. 2017;153:812–26. [DOI] [PMC free article] [PubMed] [Google Scholar]
- 4.Montironi C, Castet F, Haber PK, Pinyol R, Torres-Martin M, Torrens L, et al. Inflamed and non-inflamed classes of HCC: a revised immunogenomic classification. Gut. 2022;72:129–40. [DOI] [PMC free article] [PubMed] [Google Scholar]
- 5.Zheng C, Zheng L, Yoo JK, Guo H, Zhang Y, Guo X, et al. Landscape of infiltrating T cells in liver cancer revealed by single-cell sequencing. Cell. 2017;169:1342–56. e1316. [DOI] [PubMed] [Google Scholar]
- 6.Gao Y, You M, Fu J, Tian M, Zhong X, Du C, et al. Intratumoral stem-like CCR4 + regulatory T cells orchestrate the immunosuppressive microenvironment in HCC associated with hepatitis B. J Hepatol. 2021;76:148–59. [DOI] [PubMed] [Google Scholar]
- 7.Cheng Y, Gunasegaran B, Singh HD, Dutertre CA, Loh CY, Lim JQ, et al. Non-terminally exhausted tumor-resident memory HBV-specific T-cell responses correlate with relapse-free survival in hepatocellular carcinoma. Immunity. 2021;54:1825–40.e1827. [DOI] [PubMed] [Google Scholar]
- 8.Satpathy AT, Granja JM, Yost KE, Qi Y, Meschi F, McDermott GP, et al. Massively parallel single-cell chromatin landscapes of human immune cell development and intratumoral T-cell exhaustion. Nat Biotechnol. 2019;37:925–36. [DOI] [PMC free article] [PubMed] [Google Scholar]
- 9.You M, Chen L, Zhang D, Zhao P, Chen Z, Qin E-Q, et al. Single-cell epigenomic landscape of peripheral immune cells reveals establishment of trained immunity in individuals convalescing from COVID-19. Nat Cell Biol. 2021;23:620–30. [DOI] [PMC free article] [PubMed] [Google Scholar]
- 10.Sharma A, Seow JJW, Dutertre CA, Pai R, Bleriot C, Mishra A, et al. Onco-fetal reprogramming of endothelial cells drives immunosuppressive macrophages in hepatocellular carcinoma. Cell. 2020;183:377–94. e321. [DOI] [PubMed] [Google Scholar]
- 11.Wu R, Guo W, Qiu X, Wang S, Sui C, Lian Q, et al. Comprehensive analysis of spatial architecture in primary liver cancer. Sci Adv. 2021;7:eabg3750. [DOI] [PMC free article] [PubMed] [Google Scholar]
- 12.Huang H, Wang C, Rubelt F, Scriba TJ, Davis MM. Analyzing the mycobacterium tuberculosis immune response by T-cell receptor clustering with GLIPH2 and genome-wide antigen screening. Nat Biotechnol. 2020;38:1194–202. [DOI] [PMC free article] [PubMed] [Google Scholar]
- 13.Heim K, Binder B, Sagar, Wieland D, Hensel N, Llewellyn-Lacey S, et al. TOX defines the degree of CD8 + T-cell dysfunction in distinct phases of chronic HBV infection. Gut. 2020;70:1550–60. [DOI] [PMC free article] [PubMed] [Google Scholar]
- 14.Li H, van der Leun AM, Yofe I, Lubling Y, Gelbard-Solodkin D, van Akkooi ACJ, et al. Dysfunctional CD8 T cells form a proliferative, dynamically regulated compartment within human melanoma. Cell. 2019;176:775–89. e718. [DOI] [PMC free article] [PubMed] [Google Scholar]
- 15.Schep AN, Wu B, Buenrostro JD, Greenleaf WJ. chromVAR: inferring transcription-factor-associated accessibility from single-cell epigenomic data. Nat Methods. 2017;14:975–8. [DOI] [PMC free article] [PubMed] [Google Scholar]
- 16.Trapnell C, Cacchiarelli D, Grimsby J, Pokharel P, Li S, Morse M, et al. The dynamics and regulators of cell fate decisions are revealed by pseudotemporal ordering of single cells. Nat Biotechnol. 2014;32:381–6. [DOI] [PMC free article] [PubMed] [Google Scholar]
- 17.Ma S, Zhang B, LaFave LM, Earl AS, Chiang Z, Hu Y, et al. Chromatin potential identified by shared single-cell profiling of RNA and chromatin. Cell. 2020;183:1103–16. e1120. [DOI] [PMC free article] [PubMed] [Google Scholar]
- 18.Rosenberg AB, Roco CM, Muscat RA, Kuchina A, Sample P, Yao Z, et al. Single-cell profiling of the developing mouse brain and spinal cord with split-pool barcoding. Science. 2018;360:176–82. [DOI] [PMC free article] [PubMed] [Google Scholar]
- 19.Thommen DS, Schumacher TN. T-cell dysfunction in cancer. cancer cell 2018;33:547–62. [DOI] [PMC free article] [PubMed] [Google Scholar]
- 20.Cheng Y, Zhu YO, Becht E, Aw P, Chen J, Poidinger M, et al. Multifactorial heterogeneity of virus-specific T cells and association with the progression of human chronic hepatitis B infection. Sci Immunol. 2019;4:eaau6905. [DOI] [PubMed] [Google Scholar]
- 21.Glanville J, Huang H, Nau A, Hatton O, Wagar LE, Rubelt F, et al. Identifying specificity groups in the T-cell receptor repertoire. Nature. 2017;547:94–8. [DOI] [PMC free article] [PubMed] [Google Scholar]
- 22.Khodadoust MS, Olsson N, Wagar LE, Haabeth OA, Chen B, Swaminathan K, et al. Antigen presentation profiling reveals recognition of lymphoma immunoglobulin neoantigens. Nature. 2017;543:723–727. [DOI] [PMC free article] [PubMed] [Google Scholar]
- 23.Rivino L, Le Bert N, Gill US, Kunasegaran K, Cheng Y, Tan DZ, et al. Hepatitis B virus-specific T cells associate with viral control upon nucleos(t)ide-analogue therapy discontinuation. J Clin Invest. 2018;128:668–81. [DOI] [PMC free article] [PubMed] [Google Scholar]
- 24.Jin S, Guerrero-Juarez CF, Zhang L, Chang I, Ramos R, Kuan CH, et al. Inference and analysis of cell-cell communication using CellChat. Nat Commun. 2021;12:1088. [DOI] [PMC free article] [PubMed] [Google Scholar]
- 25.Fink ISaPJ. The dual functions of Fas ligand in the regulation of peripheral CD8 ? and CD4 ? T cells. Proc Natl Acad Sci U S A. 2000;97:1707–12. [DOI] [PMC free article] [PubMed] [Google Scholar]
- 26.Bertoletti A, Ferrari C. Adaptive immunity in HBV infection. J Hepatol. 2016;64:S71–83. [DOI] [PubMed] [Google Scholar]
- 27.Schuch A, Salimi Alizei E, Heim K, Wieland D, Kiraithe MM, Kemming J, et al. Phenotypic and functional differences of HBV core-specific versus HBV polymerase-specific CD8 + T cells in chronically HBV-infected patients with low viral load. Gut. 2019;68:905–15. [DOI] [PubMed] [Google Scholar]
- 28.Grinberg-Bleyer Y, Oh H, Desrichard A, Bhatt DM, Caron R, Chan TA, et al. NF-kappaB c-Rel is crucial for the regulatory T-cell immune checkpoint in cancer. Cell. 2017;170:1096–108. e1013. [DOI] [PMC free article] [PubMed] [Google Scholar]