Abstract
We present two open-source datasets that provide time-dependent density-functional tight-binding (TD-DFTB) electronic excitation spectra of organic molecules. These datasets represent predictions of UV-vis absorption spectra performed on optimized geometries of the molecules in their electronic ground state. The GDB-9-Ex dataset contains a subset of 96,766 organic molecules from the original open-source GDB-9 dataset. The ORNL_AISD-Ex dataset consists of 10,502,904 organic molecules that contain between 5 and 71 non-hydrogen atoms. The data reveals the close correlation between the magnitude of the gaps between the highest occupied molecular orbital (HOMO) and the lowest unoccupied molecular orbital (LUMO), and the excitation energy of the lowest singlet excited state energies quantitatively. The chemical variability of the large number of molecules was examined with a topological fingerprint estimation based on extended-connectivity fingerprints (ECFPs) followed by uniform manifold approximation and projection (UMAP) for dimension reduction. Both datasets were generated using the DFTB+ software on the “Andes” cluster of the Oak Ridge Leadership Computing Facility (OLCF).
Subject terms: Structure elucidation, Computational chemistry
Background & Summary
The ultraviolet-visible (UV-vis) absorption spectrum of an organic molecule interacting with light is a particularly important excited-state property that reveals many of its electronic and optical properties, photochemical reactivity, and chemical reactivity. Applications of photoactive molecules span a wide range of diverse applications, from photovoltaics for solar energy1 to electrochromic dyes2 for energy-efficient window application, and optical imaging in biological research such as deep-tissue imaging3. The discovery of molecules with tailored optoelectronic and photoreactivity properties represents a major challenge for technological advances in these areas. Trial and error-based molecular design is still commonplace but arduous and costly, and it is therefore advantageous to develop computational inverse design capabilities to infer the unknown chemical composition of a molecule matching desirable electronic excitation spectra4. Solving this inverse problem within a reasonable time requires an effective exploration of a high-dimensional molecular space characterized by molecules of different sizes and chemical compositions. Quantum chemical electronic structure methods such as multi-reference configuration interaction (MR-CI), complete active space second-order perturbation theory (CASPT2), or time-dependent density-functional theory (TD-DFT), allow to supplant experimental measurements of UV-vis spectra in the gas phase with in silico calculations, but the computational time needed to perform these calculations still hampers a rapid exploration of the molecular space5,6.
Recent works have shown that deep learning (DL) models can be used as effective surrogates for fast and still accurate estimations of the UV-vis spectra5–7. However, a large amount of training data is needed to ensure accuracy, generalizability, and transferability of the trained DL model. In order to collect large volumes of data that can be used to train accurate DL models, high-performance computing (HPC) and permanent data storage facilities need to be leveraged to run quantum chemistry calculations and store large volumes of data8.
In response to the need for leveraging large-scale HPC resources for generating large amounts of quantum chemical electronic excitation spectral data, we present two new open-source quantum chemistry datasets called GDB-9-Ex9 and ORNL_AISD-Ex10 that provide simulated UV-vis absorption spectra for organic molecules. The two datasets differ in the number of molecules considered, as well as in the size of molecules and their chemical composition. These are the largest datasets containing excited states properties of molecules to date. We created them with the goal of providing significant coverage of the chemical and molecular structure space in terms of structural variability, number of atoms contained in the dataset (from 5 to 71 non-hydrogen atoms), and to report statistical analysis for excited state properties in relation to molecular orbital (MO) descriptions. Through the use of the “Atomic Simulation Environment” (ASE)11 package, our developed workflow software is agnostic of the quantum chemistry code and thus provides a general capability for generating optical spectra of molecules using higher level electronic structure theories.
Methods
The simulations for these large datasets of UV-vis absorption spectra were based on the computationally inexpensive density-functional tight-binding (DFTB) method12–14 for geometry optimizations of molecules in their electronic ground states, and its excited states extension, the time-dependent DFTB (TD-DFTB) method15 for electronic excitation energies and associated oscillator strengths. These semiempirical methods were selected due to the enormous computational cost associated with TD-DFT calculations of such large numbers of compounds. The particular strength of our datasets is the large number of molecular systems they contain, as similar datasets generated with higher level theories contain significantly smaller numbers of molecules16,17.
The DFTB method13,18–20 is an approximation to density functional theory (DFT), utilizing a minimal basis set in conjunction with a two-center approximation to the electronic Hamiltonian and overlap matrix elements. In short, the DFTB total energy is the sum of an electronic and a repulsive energy contributions, and their calculation requires optimized electronic parameters and diatomic repulsive potential energy functions. When charge transfer or polarization between atoms are explicitly considered, the total DFTB electronic energy E is expressed as a Taylor expansion of the terms of density fluctuations δρ around atomic reference densities ρ0 as21 In the DFTB formulation, truncation of this series at various orders is termed as different DFTB “flavors” (DFTB1, DFTB2, etc.) which correspond to various accuracies in the interatomic Coulombic interaction12–14. We note that DFTB ground state geometries are typically in excellent agreement with higher level methods such as DFT13,22, while absolute transition energies from TD-DFTB calculations are often negatively affected by the minimum basis set methodology15. A more accurate variant of TD-DFTB has recently emerged, namely the long-range corrected version of TD-DFTB23, but unfortunately the available parameters only span the C, H, N, and O chemical elements24, which makes calculations for molecules with S, P, and F chemical elements impossible and would have severely limited the scope of our work. Since the goal of our study is to provide large datasets and the associated workflow software for detailed, statistically meaningful studies of the relationship between molecular structure and optical spectra, we resorted to using the long-established, more traditional TD-DFTB method, as our workflow software is agnostic to the type of electronic structure method employed in the generation of the data. A detailed discussion of the performance of TD-DFTB for excited states energies and spectra was recently reported by Ruger et al.25.
The simulations of UV-vis spectra in this work were performed as follows. First, the Simplified Molecular-Input Line-Entry system (SMILES) strings of the molecules from the GDB-9 database26,27 were converted to a 3D atomic structure and stored in a PDB file after preliminary geometry optimization using the Merck Molecular Force Field (MMFF94) in RDKit21,28. The primary information stored in the PDB file archive consists of Cartesian coordinates for each atom in their 3D location in space, along with summary information about the structure, sequence, and experiment. We then performed molecular geometry optimization on the electronic ground state potential energy surface, using the third-order DFTB3 method20 in conjunction with the matching 3ob set of electronic parameters and repulsive potentials29,30. The empirical γ-damping for hydrogen bond correction, and the D3 empirical dispersion correction with Becke-Johnson damping (D3(BJ))31 was included to improve the description of noncovalent intramolecular interactions. The DFTB3-D3(BJ)/3ob geometry optimizations where then followed by single-point excited states TD-DFTB calculations based on the DFTB2 method19 and the matching mio19,29,32 and halorg33 parameter sets. For simplicity we only considered singlet excitations. In order to ensure a wide enough coverage of excitation energies even for large molecules, we opted to request the simultaneous calculation of 50 excited singlet states, based on linear response theory using the Casida equation and the ARPACK diagonalizer34. The computed singlet excitation energies and associated oscillator strengths can be converted to predict UV-vis absorption spectra35, where excitation energies correspond to absorption peak positions, and oscillator strengths provide a good measure of the probability of absorption of visible or UV light in transitions between electronic ground and excited states. All DFTB calculations were performed using the DFTB+ code36 (version 21.2) and the wrapper for DFTB+ in the Atomic Simulation Environment (ASE)11, which performed an internal conversion of Cartesian coordinates from PDB to the .gen file format.
Workflow for data generation
The workflow for generating the two datasets is written as a Python program that processes molecules in parallel on a High Performance Computing (HPC) cluster. The gap between the highest occupied molecular orbital (HOMO) and the lowest unoccupied molecular orbital (LUMO), also termed the “HOMO-LUMO” gap, and the excitation spectrum for a molecule is generated from the SMILES string. First, a PDB file is created for the molecule from its SMILES string. The sequence of RDKit operations performed to convert a SMILES representation of the molecule into a PDB file is represented in the following pseudocode.
mol = AllChem.MolFromSmiles(smiles)
mol = AllChem.AddHs(mol)
AllChem.EmbedMolecule(mol)
AllChem.MMFFOptimizeMolecule(mol)
pdb_block = AllChem.MolToPDBBlock(mol)
DFTB calculations for ground state geometry optimizations followed by calculations of the excited state properties are then run using the PDB data as input. The HOMO-LUMO gap is generated from the output of the DFTB calculations, followed by the calculation of the excitation spectrum.
The workflow is run on Andes, a commodity Linux cluster at the Oak Ridge Leadership Computing Facility (OLCF). Molecules are processed in parallel using the Message Passing Interface (MPI), a commonly-used framework for parallelizing scientific applications. As shown in Fig. 1, the workflow uses a master-worker framework in which a co-ordinator process dynamically assigns groups of molecules to worker processes. As the time to process different molecules varies, dynamic task distribution ensures that we obtain efficient load balancing between all worker processes. Each molecule is processed on one CPU core, and the full workflow was run on up to 1,000 cores. When a worker process finishes processing a set of molecules, it requests the co-ordinator for the next set of molecules for processing.
Fig. 1.
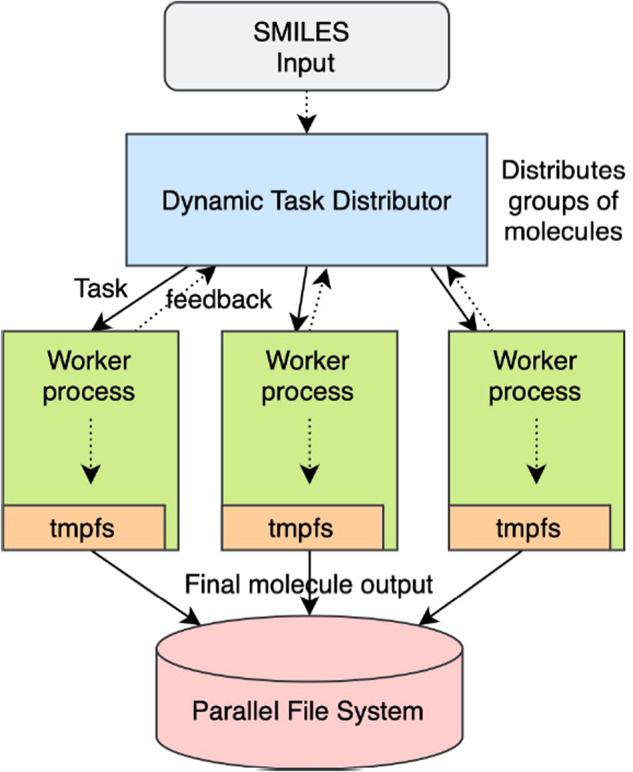
The computational workflow that processes molecules in parallel on a large Linux cluster using a master-worker pattern. The dynamic task distributor helps obtain dynamic load balancing, whereas the file system overhead is mitigated using the hierarchical storage consisting of an in-memory file system and a high-speed parallel file system.
We use an in-memory file system in conjunction with a high-speed parallel file system to efficiently manage over ninety million files generated during the workflow. All output files that include intermediate files created by the workflow for a molecule are first written to the in-memory file system on the compute node. The final set of five files for each molecule is then copied to the parallel file system for persistent storage. Every molecule is assigned a separate directory in which its output files are stored.
Calculating the UV spectrum of a molecule requires performing three main operations:
Converting the SMILES string representation of a molecule into a geometric structure where each atom is assigned XYZ coordinates. The geometric structure is written to the file smiles.pdb.
Using the file smiles.pdb to compute the relaxed geometry of the molecule, which corresponds with the position of the atoms in equilibrium at the ground state. This generates the files band.out, detailed information about the DFTB run in detailed.out, and the optimized geometry information in the file geo_end.gen.
Using the file geo_end.gen to calculate the UV spectrum of the molecule which is written into the file EXC.DAT. Every molecule in the dataset has its own directory.
Note that the default configuration in the read function in ASE for reading PDB and optimized geometry data is to have the master MPI process read and broadcast its data to all other processes. To ensure all processes read their own molecule information, this parallel I/O feature was disabled by setting the function argument ‘parallel’ to ‘False’.
After all molecules have been processed, validation codes perform several sanity checks over the entire dataset. Due to the large number of molecules, the validation codes are also developed as parallel programs that run on the analysis cluster at OLCF. For each molecule, they first check for the presence of the five files – (1) the SMILES data in pdb format, (2) the geometry information in the file geo_end.gen, (3) detailed information about the DFTB run in the file detailed.out, (4) band gap information in the file band.out, and (5) the excitation spectrum in the file EXC.DAT. They then perform a correctness check to verify the overall structure of EXC.DAT that contains the UV spectrum. Finally, another parallel workflow generates compressed tar files from the raw data for public release. The list of SMILES strings describing the molecules are obtained from the AISD HOMO-LUMO dataset37.
Software specification on OLCF andes
The software packages used in this work are installed in a conda environment using the popular Conda package management system used in the Python programming ecosystem. In particular, the ASE11, DFTB+36, and RDKit28 packages are installed from the conda-forge channel. Table 1 shows the main software components and their versions used for this work.
Table 1.
Software Specification for the Workflow Components.
Description of the datasets
Both GDB-9-Ex and ORNL_AISD-Ex datasets contain multiple directories, one for each molecule. The files contained in each molecule directory are as follows: 1. smiles.pdb, 2. geo_end.gen, 3. detailed.out, 4. band.out, 5. EXC.DAT.
To facilitate the consultation of the datasets, we have collected the information of SMILES string, 50 lowest excitation energies and corresponding oscillator strengths in CSV file format. This version of the GDB-9-Ex dataset with compressed information has been released open-source as a stand-alone dataset38. We have generated the same compressed version of the data for ORNL_AISD-Ex, which resulted in the generation of 1,000 CSV files. Also this version of the dataset has been released open-source as a stand-alone dataset39.
Correlation between the HOMO-LUMO gap and the minimum absorption energy
The HOMO-LUMO gap is a quantity that arised from the quasi-particle approximation of the Kohn-Sham formalism40. In the exact density functional framework, the energy gap represents the energy required to excite an electron from the ground to its lowest excited state41. In many cases, the nature of the first excited state corresponds to a transition of an electron from the HOMO to the LUMO. A previous study on 15 molecules demonstrated a strong correlation between the HOMO-LUMO gap and the minimum excitation energy42, and this correlation can be successfully employed in the design of molecular dye molecules43. In general, a smaller HOMO-LUMO gap corresponds to a lower minimum absorption energy, indicating that the molecule is more likely to absorb light at longer wavelengths (lower energies). Conversely, a larger HOMO-LUMO gap corresponds to a higher minimum absorption energy, indicating that the molecule is more likely to absorb light at shorter wavelengths (higher energies). However, it is important to note that the correlation between the HOMO-LUMO gap and the minimum absorption energy is not always perfect, as we do not know the exact density functional, and other factors such as different orbital relaxations for HOMO and LUMO orbitals in the excited state can introduce quantitative deviations between the magnitude of the HOMO-LUMO gap and the minimum excitation required to transfer the molecule from ground to first excited state. Factors influencing the overall UV-vis absorption spectrum of a molecule include the π-bond conjugation length and aromaticity, steric and ring strain, and clearly the presence of functional groups4. It should further be noted that in exact DFT, the HOMO energy is an approximation to the ionization potential (IP) whereas the LUMO energy is an approximation to the electron affinity (EA), as derived from Janak’s theorem44. Therefore, the HOMO-LUMO energy gap should be viewed as a proxy for the electrical gap (IP-EA) rather than the optical gap, which differs from the former by the exciton binding energy45.
GDB-9-Ex
The SMILES strings of the molecules were obtained from the GDB-9 database26. The conversion of SMILES strings to 3D Cartesian coordinates of fully DFTB-optimized molecules was successful for 96,766 molecules, for which both geometry optimizations and excited states calculations were successful.
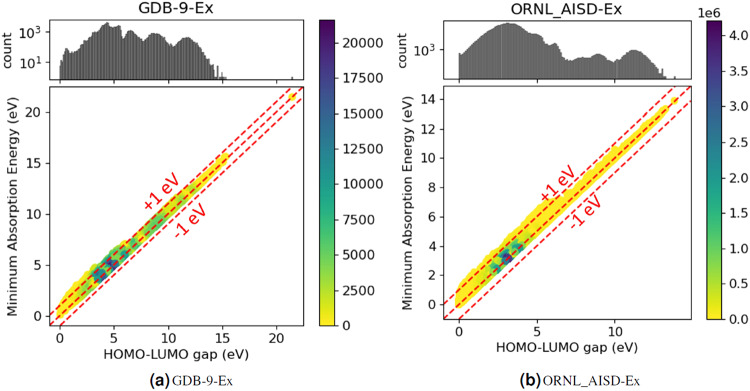
Figure 2 describes the correlation between the HOMO-LUMO gap and the minimum absorption energy for the organic molecules of GDB-9-Ex, confirming the strong correlation between the two quantities. While it is common knowledge that this correlation exists42, it has never before been demonstrated to hold on such a large selection of organic molecules. We note that most excitation energies are slightly larger than the HOMO-LUMO gap, indicating that the orbital relaxations in the excited state affect the magnitude of the excitation energies quite systematically. We surmise that this observation could potentially be exploited for data-informed, physics-based predictions of minimum excitation energies from HOMO-LUMO gaps. Interestingly, the illustration shows a single molecule clearly separated from the rest of the molecular dataset, with an HOMO-LUMO gap and minimum absorption energy estimated by DFTB over 20 eV. This molecules is tetrafluoromethane, CF4, and the correct estimate of its HOMO-LUMO gap is 15.5 eV according to46. Since DFTB and TD-DFTB are minimum basis set methods, they clearly fail to describe accurately the only possible excited state this molecule can attain, the so-called Rydberg excited state47, which can be thought of as the transition of an electron from its valence HOMO to the large, diffuse LUMO which is composed of empty unoccupied atomic orbitals, in this case the 3 s and 3p orbitals of C and F, respectively.
Fig. 2.
Top: Semi-logarithmic histogram of the HOMO-LUMO gap value across the dataset. Bottom: Parity plot of HOMO-LUMO gap versus minimum absorption energy.
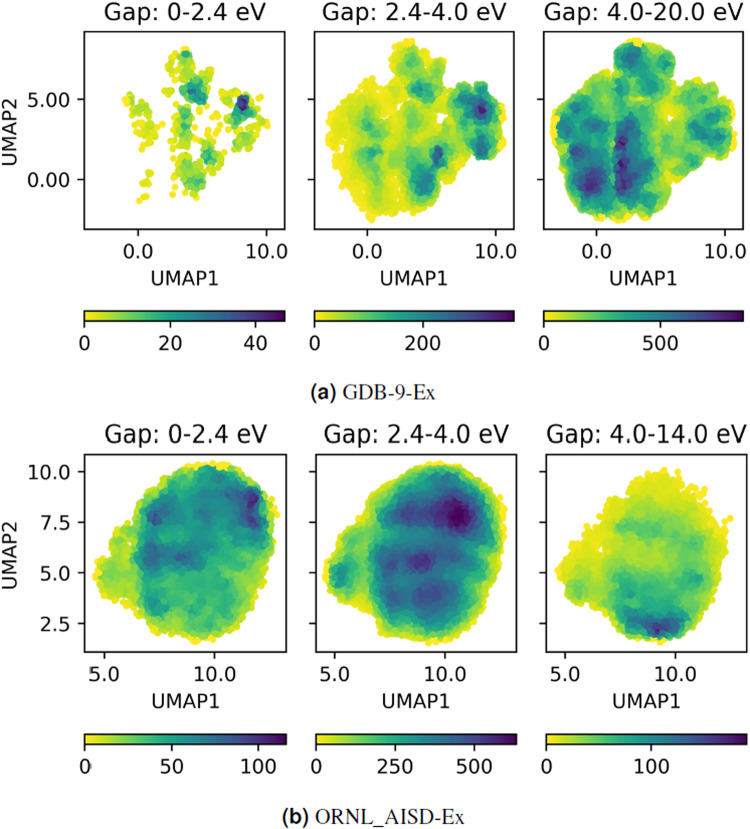
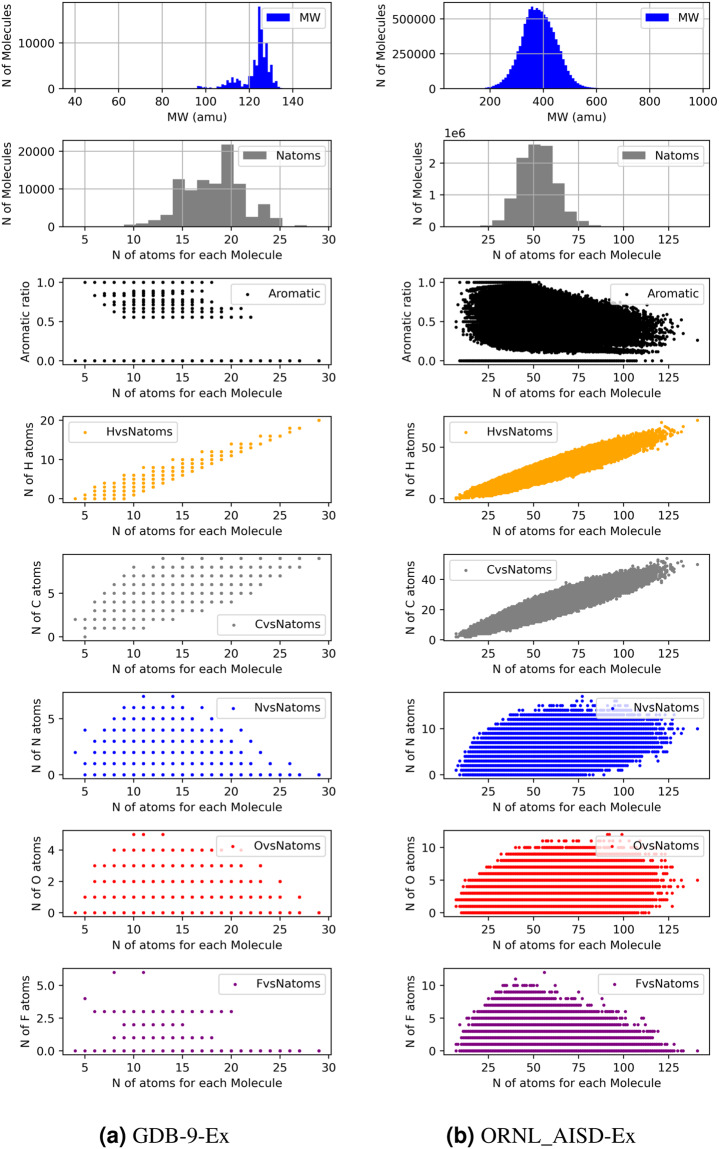
Chemical variability of the large number of molecules was examined with a topological fingerprint estimation based on extended-connectivity fingerprints (ECFPs)48 followed by uniform manifold approximation and projection (UMAP)49 for dimension reduction. Figure 3a shows the distribution of molecules based on the ECFPs and UMAP in three ranges of the HOMO-LUMO gap: the gap of 958 molecules is low, between 0–2.4 eV, the gap of 15,665 molecules is medium with 2.4–4.0 eV, and the gap of 79,112 molecules is high with 4.0–20.0 eV, respectively. These three ranges correspond roughly to the classifications of conductor, semiconductor, and insulator in materials sciences. UMAP dimension reduction was conducted at once for all molecules to consistently compare their relevant position in the chemical space. We note similar features in the UMAPs of low and medium-gap molecules, with very different variability for the high-gap molecules. In addition to the UMAP analysis, we examine the molecular properties such as the number of atoms per molecule, the molecular weight (MW) distribution, the aromaticity (ratio of aromatic atoms to the total number of atoms for each molecule) and the amount of individual element (H,C,N,O,F) of each molecule in Fig. 4 to provide chemical properties of the datasets. Further analysis will be carried out in the future on the molecular structure factors influencing the HOMO-LUMO gap.
Fig. 3.
Two dimensional chemical space plot using ECFPs and UMAP dimension reduction for the set of molecules in three ranges (0–2.4 eV (left panel), 2.4–4.0 eV (middle panel) and 4.0–20 eV (right panel)) of the HOMO-LUMO gap. (a) the molecule distribution in structural space with all molecules in GDB-9 and (b) with 1% of molecules in ORNL-AISD. The color indicates the number of molecules populated in each region of the space.
Fig. 4.
Molecular property analysis for (a) GDB-9-Ex and (b) ORNL_AISD-Ex. Molecules in both dataset were analyzed with the following properties: distribution of molecular weight (MW), the number of atoms for molecules, the aromaticity ratio and the number of individual elements (H,C,N,O,F) versus the number of atoms per molecule.
Examples of absorption spectra for organic molecules with HOMO-LUMO gap within the range 0–2.4, 2.4–4.0 eV, and 4.0–20.0 eV are shown in Fig. 5. These plots were generated with the Python script dftb-uv_2d.py as explained below.
Fig. 5.
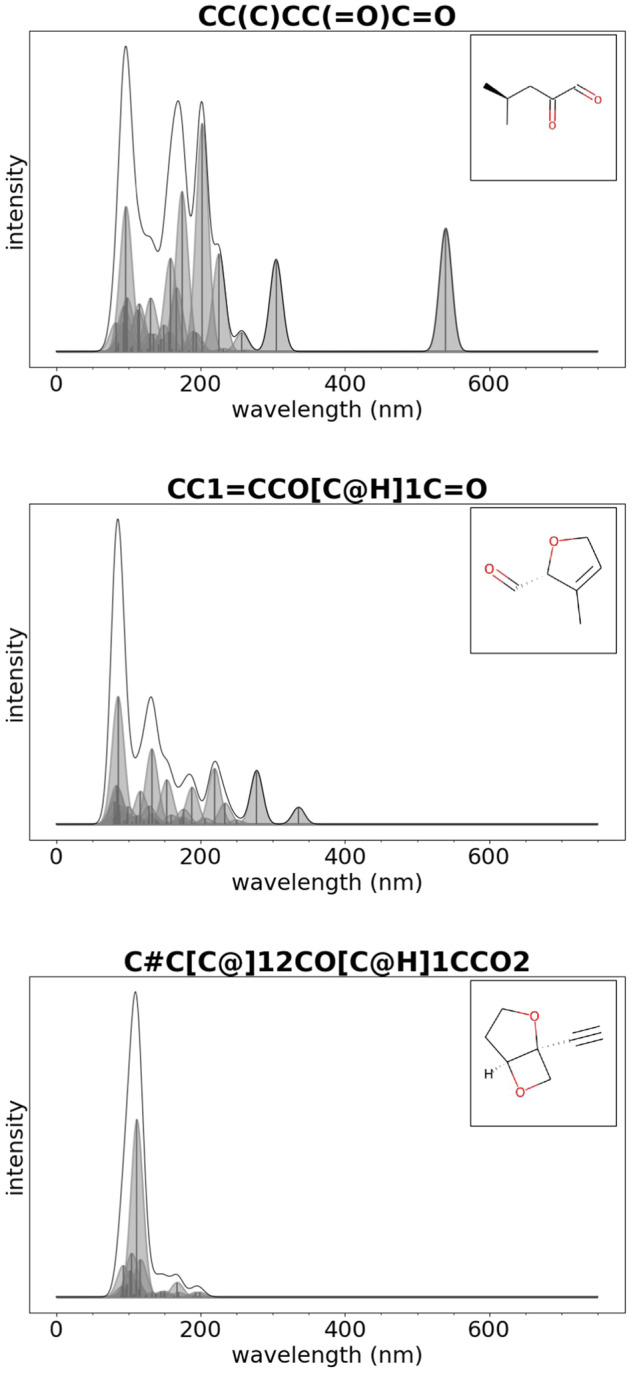
GDB-9-Ex: examples of absorption spectra for organic molecules with HOMO-LUMO gap within the range 0–2.4 eV (top), 2.4–4.0 eV (center), 4.0–20.0 eV (bottom). The title of each figure provides the SMILES representation of the molecule.
ORNL_AISD-Ex
The molecular structures that we used for ORNL_AISD-Ex were already published in a previous open-source dataset called AISD HOMO-LIMO37. These molecules are a subset of a larger dataset generated for previous work50, which augmented the Enamine REAL database https://enamine.net/. We refer the reviewer to these publications to obtain more details about how these molecular structures were generated. After preliminary geometry optimization, the SMILES strings of the molecules from the AISD HOMO-LUMO database were converted to a 3D atomistic structure and stored in a PDB file. We note that, since RDKit employs a random choice for the generation of molecular conformers, the molecular geometries obtained in this dataset could be different from the ones obtained when the AISD HOMO-LUMO dataset was generated. The conversion of SMILES strings to 3D Cartesian coordinates of fully DFTB-optimized molecules was successful for 10,502,904 out of 10,502,917 molecules. For these molecules, both geometry optimizations and excited states calculations were successful. The molecules are diverse for chemical compositions (which span five non-hydrogen chemical elements: oxygen, carbon, nitrogen, fluorine, and sulfur) and molecular size (the smallest molecule contains five non-hydrogen atoms, and the largest molecule contains 71 non-hydrogen atoms). The DFTB calculations did not complete for thirteen molecules of the original AISD HOMO-LUMO dataset. We still provide information about the geometry of these molecules. The molecular structures of the thirteen exceptions are stored in a separate tar file named “ornl_aisd_ex_unprocessed.tar.gz” to allow the users to extract information about only these molecules, without necessarily manipulating the whole dataset.
Figure 2b describes the correlation between the HOMO-LUMO gap and the minimum absorption energy for the organic molecules of ORNL_AISD-Ex, confirming the strong correlation between the two quantities. Figure 3b demonstrates the chemical space distribution of molecules in ORNL_AISD-Ex with the ECFPs and UMAP in three range of the HOMO-LUMO gap. The molecules in Fig. 3b were randomly selected by 1% of entire data due to high computation cost. The numbers are corresponding to 11,774 (from 1,177,422) molecules in 0–2.4 eV, 83,488 (from 8,348,848) molecules in 2.4–4.0 eV and 9,752 (from 975,254) molecules in 4.0–14.0 eV, respectively. Both GDB-9 and ORNL_AISD-Ex data sets show similar HOMO-LUMO gap/minimium excitation energies correlations and bear resemblance also in their UMAP dimension reductions, indicating their common molecular origin, albeit with much larger molecular structures present in the latter dataset.
Also for this dataset, we provide examples of absorption spectra for organic molecules with HOMO-LUMO gap within the range 0–2.4, 2.4–4.0 eV, and 4.0–20.0 eV that are shown in Fig. 6. These plots were generated with the Python script dftb-uv_2d.py as explained below.
Fig. 6.
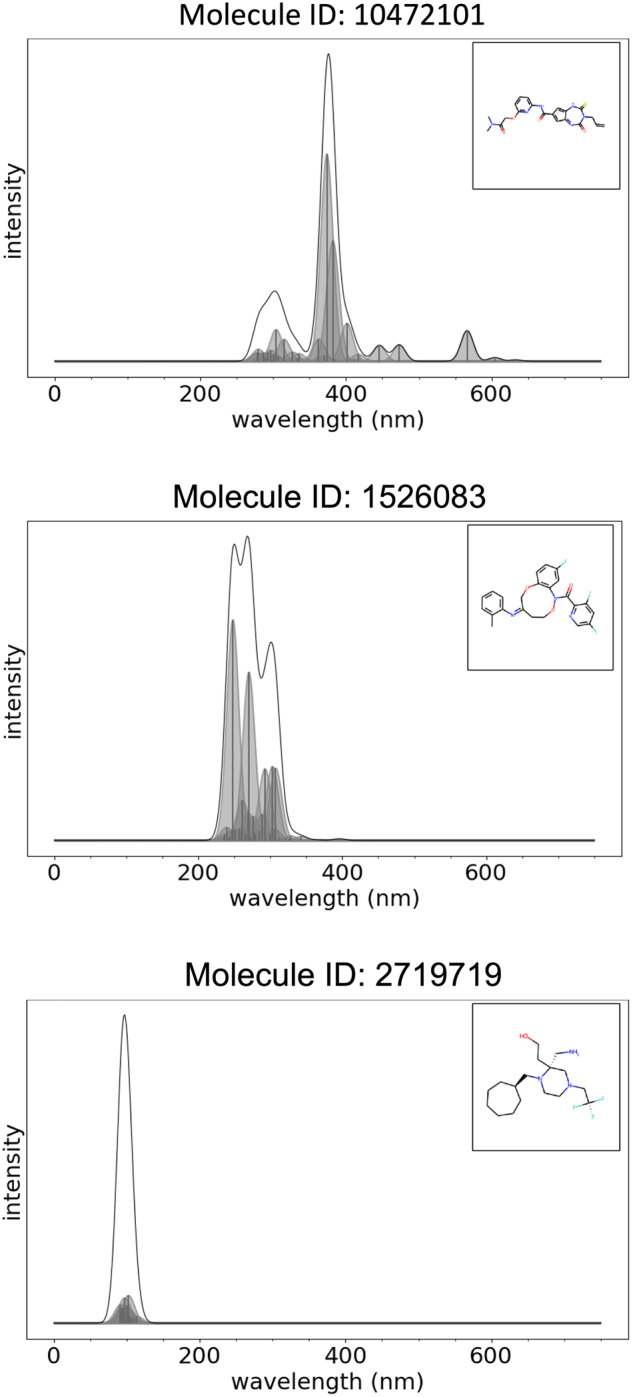
ORNL_AISD-Ex: examples of absorption spectra for organic molecules with HOMO-LUMO gap within the range 0–2.4 eV (top), 2.4–4.0 eV (center), 4.0–20.0 eV (bottom). The title of each figure provide the molecule ID corresponding to the numbering of the molecule in the dataset.
Artefact description
The GDB-9-Ex dataset contains 96,766 directories - one for each molecule in the dataset. However, owing to the large number of molecules in the ORNL_AISD-Ex dataset, its molecule directories are grouped into compressed tar files as explained below.
The ORNL_AISD-Ex dataset consists of 1001 compressed tar files containing a total of 10,502,917 molecules. The tar.gz files are named “ornl_aisd_ex_n.tar.gz” where n is a numeric value ranging from 1 to 1000. An additional file “ornl_aisd_ex_unprocessed.tar.gz” contains the molecules for which the DFTB calculations could not be completed.
Each tar file contains 10,500 molecules, except for the tar files numbered 34, 121, 128, 352, 360, 429, 495, 509, 518, 627, 676, 668, and 862 that contain 10,499 molecules each. The 13 molecules missing from these tar files could not be processed successfully and are instead recorded in “ornl_aisd_ex_unprocessed.tar.gz”. The last tar file numbered 1,000 contains the remaining 13,417 molecules. The total size of the compressed tar dataset is approximately 75 Gigabytes whereas that of the uncompressed dataset is over 283 Gigabytes.
The molecules in the tar files are ordered according to their position in the CSV file containing the SMILES strings37. That is, molecules numbered 0 thru 10,502,917 in the dataset correspond to rows 1 through 10,502,918 in the CSV file. We note that due to array index notation, the molecules in the dataset are numbered starting from 0 instead of 1. The tar file numbering also follows a similar ordering: the first tar file contains the first 10,500 molecules; the second tar file includes the following 10,500 molecules, and so on. This ordering can be helpful for retrieving information about a desired molecule directly. For example, molecule number 1346075 can be found in tar file numbered ┌1346075/10500┐ = 129. The molecule directories for the GDB-9-Ex dataset following a similar numbering notation.
Data Records
The open-source datasets GDB-9-Ex9 and ORNL_AISD-Ex10 are stored by the OLCF Data Constellation Facility. The datasets can be downloaded using the Globus data transfer service, as indicated by the instructions provided at the following website https://docs.olcf.ornl.gov/data/index.html#data-transferring-data.
Technical Validation
The accuracy of the semi-empirical TD-DFTB method for the prediction of UV-Vis absoroption spectra of organic molecules has been evaluated previously on a number of occassions, e.g. against theoretical and experimental best estimates of typical, small molecules51, or more recently in a comparison against TD-DFT methods for larger molecules such as rhodopsins and light-havesting complexes52. It is clear that the minimum basis set approach in TD-DFTB does not allow the accurate description of energetically high-lying Rydberg states, since unoccupied atomic orbitals such as the 2 s orbital for hydrogen are absent24. The minimum basis set also affects negatively the prediction of the oscillator strength and absorption intensities52. Nevertheless, agreement of TD-DFTB excitation energies and qualitative features of calculated UV-vis spectra was found satisfactory for organic molecules in many cases51,52. At the same time, since TD-DFTB is an approximation to TD-DFT methods, the strengths and weaknesses of the latter matter are inherently present as well, with underestimation of charge-transfer (CT) excited states being one of the most prominent deficiencies53. Hybrid functionals such as the PBE0 exchange correlation potential54 are able to address this problem in an empirical manner54. The most accurate singlet excitation energies for closed-shell organic molecules can be obtained by using ab initio correlated electronic structure methods, such as equation-of-motion coupled cluster with single and double excitations (EOM-CCSD), which are completely free from underestimation of CT excitations, but are an order of magnitude more costly than even the TD-DFT methods. For a more extensive discussion on the computational validation of the accuracy attained by TD-DFTB methods in comparison with more accurate (but also more expensive) TD-DFT and EOM-CCSD methods to predict UV-vis spectra, we refer the reader to refs. 51,52.
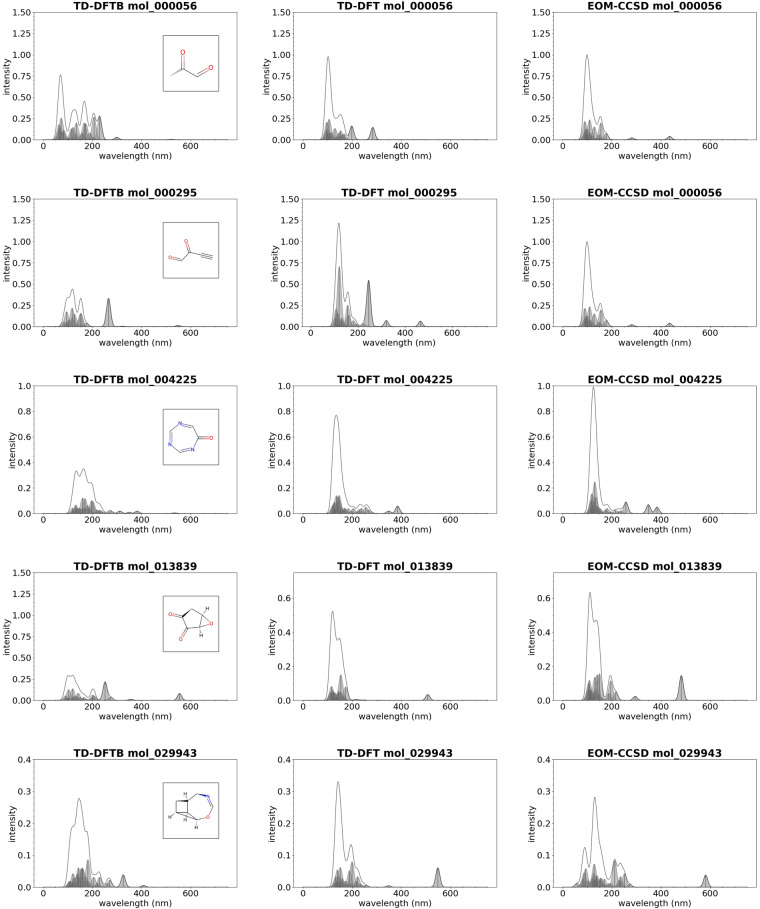
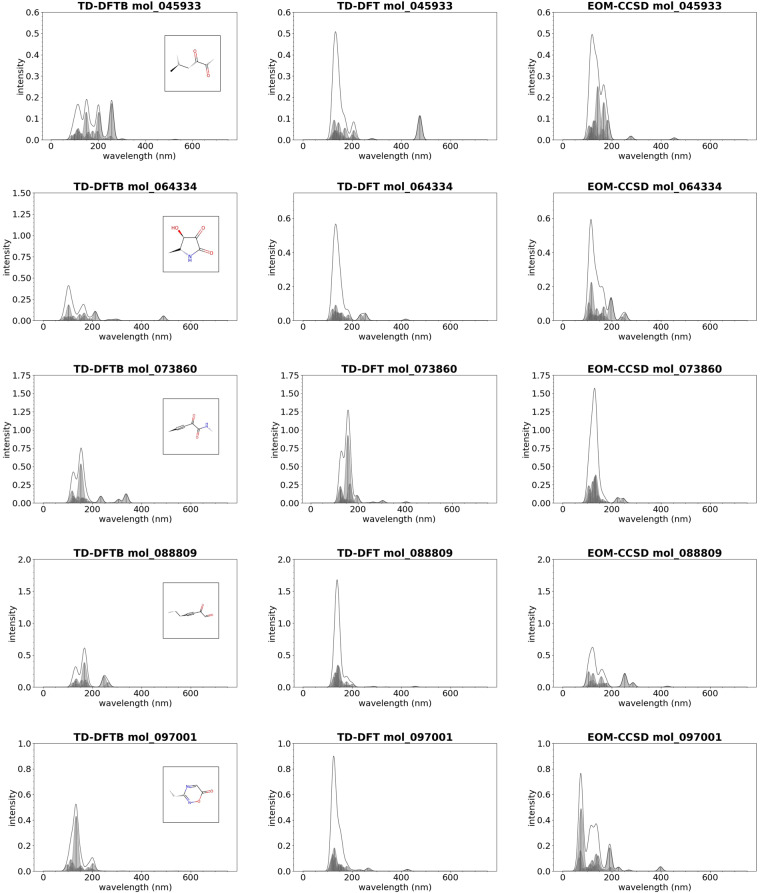
Due to the aforementioned, method-specific shortcomings in the prediction of UV-vis spectra of organic molecules, we resorted in this study to employ two representative methods for validation of TD-DFTB spectra, namely TD-DFT and EOM-CCSD. These calculations have been performed using the ORCA quantum chemistry program package55 on a subset of several thousand molecules. We here visually compared 10 molecules that represent a reasonable selection of molecular structure in terms of molecular size, composition, bond structure, “exoticity” (in terms of molecular structure), and different agreements between the three approximation theories. All the molecules selected have intensities between 350 and 750 nm, and the plots of the UV-vis spectrum for these molecules are provided in Figs. 7, 8. We find qualitative agreement between TD-DFTB and both TD-DFT as well as EOM-CCSD methods, while in other cases TD-DFT and EOM-CCSD methods deviate from each other to a similar extent as TD-DFTB from TD-DFT. A systematic comparison of the method capabilities for the prediction of UV-vis spectra for organic molecules is out of the scope of this study, which is focused on the computational workflow to generate UV-vis spectra with arbitrary electronic structure methods and computational codes. We refer the reader to a recent review article related to these topics which covers a broader range of topics related to the selection of the best electronic structure method for the prediction of UV-vis spectra for a specific application5.
Fig. 7.
Examples of molecules from the GDB-9-Ex dataset whose UV-vis spectrum has been computed with TD-DFTB (left), TD-DFT with PBE0 as exchange correlation potential (center), and EOM-CCSD (right).
Fig. 8.
Examples of molecules from the GDB-9-Ex dataset whose UV-vis spectrum has been computed with TD-DFTB (left), TD-DFT with PBE0 as exchange correlation potential (center), and EOM-CCSD (right).
Usage Notes
The code for calculating the electronic excitation energies and statistical analysis of the dataset is open-source and available at the ORNL-GitHub repository https://github.com/ORNL/Analysis-of-Large-Scale-Molecular-Datasets-with-Python.
The code contains the following Python scripts:
xyz2mol.py. Provides a Python implementation of the universal structure conversion method for organic molecules, which creates the three-dimensional geometry from the atomic connectivity as described in56.
mol_remaining.py. Iterates over the dataset, identifies molecules for which the DFTB calculations did not succeed, and writes the ID of these molecules on a text file named mol_remaining.txt.
smiles_dftb_excited_state.py. The entry point for the main workflow. It implements the master-worker pattern which runs a static DFTB+ calculation to compute the optimized geometry and the HOMO-LUMO gap followed by a time-dependent DFTB+ calculation to compute the UV-vis spectrum for each SMILES string representation of a molecule contained in the.CSV file of the AISD HOMO-LUMO dataset.
select_molecules.py. Selects molecules based on given criterion and copies them in a new directory.
dftb-uv_2d.py. Script to collect and plot UV-Vis spectra on both nm and eV scales. Iterates over all the directories associated with each molecule and computes the smoothed spectrum for each molecule, on both nm and eV scales, saving it into the file named EXC-smooth.DAT. The full-width at half-maximum (FWHM) can be arbitrarily tuned by the user with defaults set to 10 nm and 0.5 eV. Total spectral envelopes as well smoothened individual peak contributions and line spectra indicating the calculated excitation energies with associated oscillator strengths as measure for intensity are plotted as well. The Python script supports MPI directives to allow multiple processes to concurrently compute the smoothed spectrum on different molecules. This script is an adaptation of the python script provided at the GitHub repository https://github.com/radi0sus/orca_uv/.
plot_homo-lumo_vs_minimum_absorption_energy.py. Generates two plots. The first plot shows the correlation between the HOMO-LUMO gap and the minimum absorption energy, which is saved in an image file named HOMO-LUMO_versus_minimum_absorption_energy.jpg. The second plot shows the peaks of the UV-vis spectrum computed with TD-DFTB+ along with the smoothed spectrum, which is saved in an image file named absorption_spectrum.jpg.
utils.py. Provides basic utilities used by the other Python scripts.
Acknowledgements
The authors thank Dr. Vladimir Protopopescu for his valuable feedback in the preparation of this manuscript. This work was supported in part by the Office of Science of the Department of Energy, the Laboratory Directed Research and Development (LDRD) Program of Oak Ridge National Laboratory, Office of Advanced Scientific Computing Research, and the Scientific Discovery through Advanced Computing (SciDAC) program. This research is sponsored by the Artificial Intelligence Initiative as part of the Laboratory Directed Research and Development (LDRD) Program of Oak Ridge National Laboratory, managed by UT-Battelle, LLC, for the US Department of Energy under contract DE-AC05-00OR22725. An award of computer time was provided by the OLCF Director’s Discretion Project program using the OLCF award MAT250. This work used resources of the Oak Ridge Leadership Computing Facility and of the Edge Computing program at the Oak Ridge National Laboratory, which is supported by the Office of Science of the U.S. Department of Energy under Contract No. DE-AC05-00OR22725. This manuscript has been authored in part by UT-Battelle, LLC, under contract DE-AC05-00OR22725 with the US Department of Energy (DOE). The US government retains and the publisher, by accepting the article for publication, acknowledges that the US government retains a nonexclusive, paid-up, irrevocable, worldwide license to publish or reproduce the published form of this manuscript, or allow others to do so, for US government purposes. DOE will provide public access to these results of federally sponsored research in accordance with the DOE Public Access Plan (http://energy.gov/downloads/doepublic-access-plan).
Author contributions
M.L.P. wrote the first draft of the narrative of this work. M.L.P. and K.M. ran the calculations on the OLCF-Andes cluster and curated the datasets for their public release. K.M. installed the DFTB+ code on the OLCF-Andes cluster and developed efficient data-screening capabilities for the large datasets. P.Y. checked that the DFTB+ code was running correctly, contributed to the narrative of this work and contributed to the generation of illustrations included in this manuscript. S.I. supervised the work and edited the narrative of the manuscript.
Code availability
The code for calculating the electronic excitation energies and statistical analysis of the dataset is open-source and available at the ORNL-GitHub repository https://github.com/ORNL/Analysis-of-Large-Scale-Molecular-Datasets-with-Python.
Competing interests
The authors declare no competing interests.
Footnotes
Publisher’s note Springer Nature remains neutral with regard to jurisdictional claims in published maps and institutional affiliations.
These authors contributed equally: Massimiliano Lupo Pasini, Kshitij Mehta.
Contributor Information
Massimiliano Lupo Pasini, Email: lupopasinim@ornl.gov.
Stephan Irle, Email: irles@ornl.gov.
References
- 1.Hagfeldt A, Boschloo G, Sun L, Kloo L, Pettersson H. Dye-sensitized solar cells. Chemical reviews. 2010;110:6595–6663. doi: 10.1021/cr900356p. [DOI] [PubMed] [Google Scholar]
- 2.Beaujuge PM, Reynolds JR. Color control in π-conjugated organic polymers for use in electrochromic devices. Chemical reviews. 2010;110:268–320. doi: 10.1021/cr900129a. [DOI] [PubMed] [Google Scholar]
- 3.Bremer C, Tung C-H, Weissleder R. In vivo molecular target assessment of matrix metalloproteinase inhibition. Nature medicine. 2001;7:743–748. doi: 10.1038/89126. [DOI] [PubMed] [Google Scholar]
- 4.Green JD, Fuemmeler EG, Hele TJ. Inverse molecular design from first principles: Tailoring organic chromophore spectra for optoelectronic applications. The Journal of Chemical Physics. 2022;156:180901. doi: 10.1063/5.0082311. [DOI] [PubMed] [Google Scholar]
- 5.Dral PO, Barbatti M. Molecular excited states through a machine learning lens. Nature Reviews Chemistry. 2021;5:388–405. doi: 10.1038/s41570-021-00278-1. [DOI] [PubMed] [Google Scholar]
- 6.Westermayr J, Marquetand P. Machine learning for electronically excited states of molecules. Chemical Reviews. 2020;121:9873–9926. doi: 10.1021/acs.chemrev.0c00749. [DOI] [PMC free article] [PubMed] [Google Scholar]
- 7.Singh K, et al. Graph neural networks for learning molecular excitation spectra. Journal of Chemical Theory and Computation. 2022;18:4408–4417. doi: 10.1021/acs.jctc.2c00255. [DOI] [PubMed] [Google Scholar]
- 8.Beard, E., Sivaraman, G., Vázquez-Mayagoitia, A., Vishwanath, V. & Cole, J. M. Comparative dataset of experimental and computational attributes of UV/vis absorption spectra. Scientific Data6, 10.1038/s41597-019-0306-0 (2019). [DOI] [PMC free article] [PubMed]
- 9.Lupo Pasini M, Yoo P, Mehta K, Irle S. 2022. GDB-9-Ex: Quantum chemical prediction of UV/Vis absorption spectra for GDB-9 molecules. ORNL. [DOI]
- 10.Lupo Pasini M, Mehta K, Yoo P, Irle S. 2023. ORNL_AISD-Ex: Quantum chemical prediction of UV/Vis absorption spectra for over 10 million organic molecules. DOE Oak Ridge National Laboratory (ORNL) Repository. [DOI]
- 11.Larsen, A. H. et al. The atomic simulation environment - a python library for working with atoms. Journal of Physics: Condensed Matter29, 10.1088/1361-648X/aa680e (2017). [DOI] [PubMed]
- 12.Elstner M, Seifert G. Density functional tight binding. Philosophical Transactions of the Royal Society A: Mathematical, Physical and Engineering Sciences. 2014;372:20120483. doi: 10.1098/rsta.2012.0483. [DOI] [PubMed] [Google Scholar]
- 13.Cui Q, Elstner M. Density functional tight binding: values of semi-empirical methods in an ab initio era. Phys. Chem. Chem. Phys. 2014;16:14368–14377. doi: 10.1039/c4cp00908h. [DOI] [PMC free article] [PubMed] [Google Scholar]
- 14.Spiegelman F, et al. Density-functional tight-binding: basic concepts and applications to molecules and clusters. Advances in physics: X. 2020;5:1710252. doi: 10.1080/23746149.2019.1710252. [DOI] [PMC free article] [PubMed] [Google Scholar]
- 15.Niehaus TA, Elstner M, Frauenheim T, Suhai S. Application of an approximate density-functional method to sulfur containing compounds. Journal of Molecular Structure: THEOCHEM. 2001;541:185–194. doi: 10.1016/S0166-1280(00)00762-4. [DOI] [Google Scholar]
- 16.Veril M, et al. QUESTDB: A database of highly accurate excitation energies for the electronic structure community. Wiley Interdisciplinary Reviews: Computational Molecular Science. 2021;11:e1517. doi: 10.1002/wcms.1517. [DOI] [Google Scholar]
- 17.Ju C-W, Bai H, Li B, Liu R. Machine learning enables highly accurate predictions of photophysical properties of organic fluorescent materials: Emission wavelengths and quantum yields. Journal of Chemical Information and Modeling. 2021;61:1053–1065. doi: 10.1021/acs.jcim.0c01203. [DOI] [PubMed] [Google Scholar]
- 18.Porezag D, Frauenheim T, Kohler T, Seifert G, Kaschner Construction of tight-binding-like potentials on the basis of density-functional theory: Application to carbon. R. Phys. Rev. B. 1995;51:12947–12957. doi: 10.1103/PhysRevB.51.12947. [DOI] [PubMed] [Google Scholar]
- 19.Elstner M, et al. Self-consistent-charge density-functional tight-binding method for simulations of complex materials properties. Phys. Rev. B. 1998;58:7260–7268. doi: 10.1103/PhysRevB.58.7260. [DOI] [Google Scholar]
- 20.Gaus M, Cui Q, Elstner M. DFTB3: Extension of the self-consistent-charge density-functional tight-binding method (SCC-DFTB) J. Chem. Theory Comput. 2011;7:931–948. doi: 10.1021/ct100684s. [DOI] [PMC free article] [PubMed] [Google Scholar]
- 21.Tosco, P., Stiefl, N. & Landrum, G. Bringing the MMFF force field to the RDKit: implementation and validation. J Cheminform. 1–4, 10.1186/s13321-014-0037-3 (2014).
- 22.Elstner M. The SCC-DFTB method and its application to biological systems. Theoretical Chemistry Accounts. 2006;116:316–325. doi: 10.1007/s00214-005-0066-0. [DOI] [Google Scholar]
- 23.Kranz JJ, et al. Time-dependent extension of the long-range corrected density functional based tight-binding method. Journal of Chemical Theory and Computation. 2017;13:1737–1747. doi: 10.1021/acs.jctc.6b01243. [DOI] [PubMed] [Google Scholar]
- 24.Vuong VQ, et al. Parametrization and benchmark of long-range corrected DFTB2 for organic molecules. Journal of Chemical Theory and Computation. 2018;14:115–125. doi: 10.1021/acs.jctc.7b00947. [DOI] [PubMed] [Google Scholar]
- 25.Ruger R, et al. Efficient calculation of electronic absorption spectra by means of intensity-selected time-dependent density functional tight binding. Journal of chemical theory and computation. 2015;11:157–167. doi: 10.1021/ct500838h. [DOI] [PubMed] [Google Scholar]
- 26.Ramakrishnan, R., Dral, P. O., Rupp, M. & von Lilienfeld, O. A. Quantum chemistry structures and properties of 134 kilo molecules. Sci. Data1, 10.1038/sdata.2014.22 (2014). [DOI] [PMC free article] [PubMed]
- 27.Ruddigkeit L, van Deursen R, Blum LC, Reymond J-L. Enumeration of 166 billion organic small molecules in the chemical universe database GDB-17. J. Chem. Inf. Model. 2012;52:2864–2875. doi: 10.1021/ci300415d. [DOI] [PubMed] [Google Scholar]
- 28.RDKit: Cheminformatics and machine learning software. http://www.rdkit.org (2013).
- 29.Gaus M, Goez A, Elstner M. Parametrization and benchmark of DFTB3 for organic molecules. Journal of Chemical Theory and Computation. 2013;9:338–354. doi: 10.1021/ct300849w. [DOI] [PubMed] [Google Scholar]
- 30.Kubillus M, Kubar T, Gaus M, Rezac J, Elstner M. Parameterization of the DFTB3 method for Br, Ca, Cl, F, I, K, and Na in organic and biological systems. J. Chem. Theory Comput. 2015;11:332–342. doi: 10.1021/ct5009137. [DOI] [PubMed] [Google Scholar]
- 31.Brandenburg JG, Grimme S. Accurate modeling of organic molecular crystals by dispersion-corrected density functional tight binding (dftb) J. Phys. Chem. Lett. 2014;5:1785–1789. doi: 10.1021/jz500755u. [DOI] [PubMed] [Google Scholar]
- 32.Elstner M, Hobza P, Frauenheim T, Suhai S, Kaxiras E. Hydrogen bonding and stacking interactions of nucleic acid base pairs: A density-functional-theory based treatment. J. Chem. Phys. 2001;114:5149–5155. doi: 10.1063/1.1329889. [DOI] [Google Scholar]
- 33.Kubar T, et al. Parametrization of the SCC-DFTB method for halogens. J. Chem. Theory Comput. 2013;9:2939–49. doi: 10.1021/ct4001922. [DOI] [PubMed] [Google Scholar]
- 34.Lehoucq, R. B., Sorensen, D. C. & Yang, C. ARPACK: Solution of Large Scale Eigenvalue Problems by Implicitly Restarted Arnoldi Methods. Available from netlib@ornl.gov (1997).
- 35.Brémond ÉA, Kieffer J, Adamo C. A reliable method for fitting td-dft transitions to experimental uv–visible spectra. Journal of Molecular Structure: THEOCHEM. 2010;954:52–56. doi: 10.1016/j.theochem.2010.04.038. [DOI] [Google Scholar]
- 36.Hourahine, B. et al. DFTB+, a software package for efficient approximate density functional theory based atomistic simulations. Journal of Chemical Physics152, 10.1063/1.5143190 (2020). [DOI] [PubMed]
- 37.Blanchard A, Gounley J, Bhowmik D, Yoo P, Irle S. AISD HOMO-LUMO. 2022 doi: 10.13139/ORNLNCCS/1869409. [DOI] [Google Scholar]
- 38.Yoo P, Lupo Pasini M, Mehta K, Irle S. 2023. Supplementary material for GDB-9-Ex. OSTI.gov. [DOI]
- 39.Yoo P, Lupo Pasini M, Mehta K, Irle S. 2023. Supplementary material for ORNL_AISD-Ex. OSTI.gov. [DOI]
- 40.Bickelhaupt, F. M. & Baerends, E. J. Kohn-sham density functional theory: predicting and understanding chemistry. Reviews in computational chemistry 1–86, h10.1002/9780470125922.ch1 (2000).
- 41.Geerlings P, De Proft F, Langenaeker W. Conceptual density functional theory. Chemical reviews. 2003;103:1793–1874. doi: 10.1021/cr990029p. [DOI] [PubMed] [Google Scholar]
- 42.Zhan C-G, Nichols JA, Dixon DA. Ionization potential, electron affinity, electronegativity, hardness, and electron excitation energy: molecular properties from density functional theory orbital energies. The Journal of Physical Chemistry A. 2003;107:4184–4195. doi: 10.1021/jp0225774. [DOI] [Google Scholar]
- 43.Narsaria AK, et al. Rational design of near-infrared absorbing organic dyes:controlling the homo–lumo gap using quantitative molecular orbital theory. Journal of Computational Chemistry. 2018;39:2690–2696. doi: 10.1002/jcc.25731. [DOI] [PMC free article] [PubMed] [Google Scholar]
- 44.Levy M, Perdew JP, Sahni V. Exact differential equation for the density and ionization energy of a many-particle system. Phys. Rev. A. 1984;30:2745–2748. doi: 10.1103/PhysRevA.30.2745. [DOI] [Google Scholar]
- 45.Bredas J-L. Mind the gap! Mater. Horiz. 2014;1:17–19. doi: 10.1039/C3MH00098B. [DOI] [Google Scholar]
- 46.Dincer, S., Tezcan, S. S., Duzkaya, H. & Dincer, M. S. Insulation and molecular properties of alternative gases to sf6. In 2018 2nd International Symposium on Multidisciplinary Studies and Innovative Technologies (ISMSIT), 1–4, 10.1109/ISMSIT.2018.8566680 (2018).
- 47.Jochim, B. et al. The importance of rydberg orbitals in dissociative ionization of small hydrocarbon molecules in intense laser fields. Scientific Reports7, 10.1038/s41598-017-04638-0 (2017). [DOI] [PMC free article] [PubMed]
- 48.Rogers D, Hahn M. Extended-connectivity fingerprints. Journal of chemical information and modeling. 2010;50:742–54. doi: 10.1021/ci100050t. [DOI] [PubMed] [Google Scholar]
- 49.McInnes, L., Healy, J. & Melville, J. UMAP: Uniform Manifold Approximation and Projection for Dimension Reduction. arXiv10.48550/arxiv.1802.03426 (2018).
- 50.Blanchard AE, et al. Language models for the prediction of sars-cov-2 inhibitors. The International Journal of High Performance Computing Applications. 2022;36:587–602. doi: 10.1177/10943420221121804. [DOI] [PMC free article] [PubMed] [Google Scholar]
- 51.Trani F, et al. Time-dependent density functional tight binding: new formulation and benchmark of excited states. Journal of Chemical Theory and Computation. 2011;7:3304–3313. doi: 10.1021/ct200461y. [DOI] [PubMed] [Google Scholar]
- 52.Bold BM, et al. Benchmark and performance of long-range corrected time-dependent density functional tight binding (lc-td-dftb) on rhodopsins and light-harvesting complexes. Physical Chemistry Chemical Physics. 2020;22:10500–10518. doi: 10.1039/C9CP05753F. [DOI] [PubMed] [Google Scholar]
- 53.Sokolov M, et al. Analytical time-dependent long-range corrected density functional tight binding (td-lc-dftb) gradients in dftb+: implementation and benchmark for excited-state geometries and transition energies. Journal of Chemical Theory and Computation. 2021;17:2266–2282. doi: 10.1021/acs.jctc.1c00095. [DOI] [PubMed] [Google Scholar]
- 54.Adamo C, Barone V. Toward reliable density functional methods without adjustable parameters: The PBE0 model. The Journal of Chemical Physics. 1999;110:6158–6170. doi: 10.1063/1.478522. [DOI] [Google Scholar]
- 55.Neese, F., Wennmohs, F., Becker, U. & Riplinger, C. The ORCA quantum chemistry program package. The Journal of Chemical Physics152, 224108, 10.1063/5.0004608 (2020). [DOI] [PubMed]
- 56.Kim Y, Kim WY. Universal structure conversion method for organic molecules: From atomic connectivity to three-dimensional geometry. Bulletin of the Korean Chemical Society. 2015;36:1769–1777. doi: 10.1002/bkcs.10334. [DOI] [Google Scholar]
- 57.Gabriel, E. et al. Open MPI: Goals, concept, and design of a next generation MPI implementation. In Proceedings, 11th European PVM/MPI Users’ Group Meeting, 97–104 (Budapest, Hungary, 2004).
Associated Data
This section collects any data citations, data availability statements, or supplementary materials included in this article.
Data Citations
- Lupo Pasini M, Yoo P, Mehta K, Irle S. 2022. GDB-9-Ex: Quantum chemical prediction of UV/Vis absorption spectra for GDB-9 molecules. ORNL. [DOI]
- Lupo Pasini M, Mehta K, Yoo P, Irle S. 2023. ORNL_AISD-Ex: Quantum chemical prediction of UV/Vis absorption spectra for over 10 million organic molecules. DOE Oak Ridge National Laboratory (ORNL) Repository. [DOI]
- Yoo P, Lupo Pasini M, Mehta K, Irle S. 2023. Supplementary material for GDB-9-Ex. OSTI.gov. [DOI]
- Yoo P, Lupo Pasini M, Mehta K, Irle S. 2023. Supplementary material for ORNL_AISD-Ex. OSTI.gov. [DOI]
Data Availability Statement
The code for calculating the electronic excitation energies and statistical analysis of the dataset is open-source and available at the ORNL-GitHub repository https://github.com/ORNL/Analysis-of-Large-Scale-Molecular-Datasets-with-Python.


