Abstract
One of the major mechanisms by which measles virus (MV) infection causes disease and death is suppression of the immune response. The nonresponsiveness of MV-infected human lymphocytes to mitogens and a partial block in the G0/G1 phase of the cell cycle observed in vitro is thought to reflect in vivo immunosuppression. In order to molecularly dissect MV-induced immunosuppression, we analyzed expression of surface activation markers and cell cycle-regulatory proteins in MV-infected human T lymphocytes. MV Edmonston (MV-Ed) could induce and maintain a high level of the early activation marker CD69 in the absence of proliferation. Expression of cyclins D3 and E, which positively control entry into S phase, was also significantly decreased. Analysis of inhibitors of progression into S phase showed that a high level of p27 was maintained in the G0/G1-blocked subpopulation of MV-Ed-infected cells compared to the proliferating MV-infected cells. Furthermore, cell cycle-related upregulation of retinoblastoma (Rb) protein synthesis did not occur in the MV-Ed-infected lymphocytes. Acridine orange staining, which distinguishes cells in G0 from cells in G1, showed that RNA levels were not upregulated following activation, which is consistent with cells remaining in a G0 state. Although expression of surface activation markers indicated entry into the cycle, intracellular Rb and RNA levels suggested a quiescent state. These results indicate that MV can uncouple activation of T lymphocytes from transition of G0 to G1.
Measles virus (MV) remains one of the main causes of infant mortality in developing countries, where it is responsible for one to two million deaths per year. The morbidity associated with measles is due in large part to suppression of the host’s immune defenses that accompanies MV infection, thereby increasing sensitivity to secondary infections (15, 20). Abnormal cellular immune responses have been reported to last up to 6 months after disappearance of the rash (14, 35). Further, despite the use of an effective live attenuated vaccine, outbreaks regularly occur in industrialized countries.
In vivo, one of the distinguishing features of the MV-induced immunosuppression has been a nonresponsiveness to recall antigens, such as tuberculin or vaccinia virus (5, 12, 33). Remission of an autoimmune disease, lipoid nephrosis, has been observed during measles (3, 18). In vitro infection of lymphocytes also leads to depressed lymphoproliferative responses to mitogen and antigen (17, 32).
Following stimulation of T cells, activation and proliferation are tightly regulated by the cell cycle machinery. Transition of cells from a G0 resting phase to G1 phase, followed by progression through the G1 phase, is characterized by a cascade of activation events that lead up to S phase. rRNA is upregulated upon entry into G1, in order to allow translation of gene products involved in proliferation. Cyclins and cyclin-dependent kinases (Cdk) as well as their inhibitors dictate G1-S-G2-M transitions via their respective syntheses and degradations (30). During G1, the D-type cyclins as well as cyclin E form complexes with Cdk to phosphorylate retinoblastoma (Rb) protein and allow initiation of S-phase events (1, 10, 21, 24, 36). Endogenous inhibitors regulate cyclin-Cdk activity at different points of the cycle. p27 and p21, universal Cdk inhibitors, prevent transition to S phase (31). p27 is constitutively expressed in quiescent cells and decreases upon activation, thus relieving the inhibition it exerts on Cdk complexes (5, 7). p21 is not constitutively expressed and can be induced by a variety of pathways, including p53 expression or activation (31).
Previous work in this laboratory has indicated that in vitro, MV induces G1 arrest in the cell cycle, thus explaining the lack of lymphoproliferative responses (25, 26, 37). In the present work, we extended these findings by precisely defining when the block occurs and by characterizing the cell cycle-regulatory proteins affected. We have observed that only a subpopulation of the MV Edmonston (MV-Ed)-infected cells are completely arrested. These cells do not upregulate RNA synthesis, and they show an overall decrease in expression of Rb and an elevated level of the Cdk inhibitor p27.
MATERIALS AND METHODS
T-lymphocyte preparations, culture conditions, and MV infection.
Peripheral blood mononuclear cells (PBMC) were isolated by Ficoll-Hypaque centrifugation from normal healthy donors. Adherent cells were eliminated by 2 h of adherence to tissue culture-treated plastic. Anti-CD19-conjugated magnetic beads (Dynal) were used to deplete B cells. The remaining enriched T cells were >90% pure as measured by surface staining for CD3. Lymphocytes were cultured in RPMI medium supplemented with 10% heat-inactivated fetal bovine serum, 50 U of penicillin per ml, and 50 μg of streptomycin per ml. Lymphocytes were cultured at a concentration of 106 cells/ml.
MV-Ed (American Type Culture Collection, Rockville, Md.), passaged and plaqued on Vero cells, was used to infect cells at a multiplicity of infection of 0.8 to 1 PFU/cell. T lymphocytes were incubated with the virus stock for 3 h at 37°C. The cells were pelleted and resuspended in culture medium containing 2 μg of phytohemagglutinin (PHA; U.S. Biochemicals) per ml and 50 U of IL-2 (National Cancer Institute Biologicals, Bethesda, Md.) per ml.
Infectious-center assays were performed by incubating dilutions of MV-Ed-infected T cells with Vero cell monolayers for 1 h at 37°C and overlaying them with agarose. After 6 days, cells were fixed and stained with crystal violet and plaques were counted as described previously (11).
Antibodies and cell surface labeling for flow cytometry.
Antibodies to surface markers (CD69, CD71, and CD25) were purchased from Pharmingen, San Diego, Calif. Antibodies to cell cycle-regulatory proteins came from various sources: antibodies to cyclins D3 and E were from Santa Cruz, Santa Cruz, Calif.; antibodies to cyclin A, Rb, and p21 were from Pharmingen; and antibody to p27 was from Transduction Laboratories, Lexington, Ky.). Antibody I41 to MV hemagglutinin was kindly provided by Ewa Bjorling at the Karolinska Institute, Stockholm, Sweden.
In order to label T lymphocytes for flow cytometry, cells were incubated for 30 min with primary antibody in phosphate-buffered saline containing 1% fetal bovine serum and 0.05% sodium azide. Cells were washed twice and incubated with a secondary antibody conjugated to phycoerythrin. After 30 min of incubation, cells were washed and fixed in 1% formaldehyde. Flow cytometry was performed on a FACScan (Becton Dickinson), and intact cells were gated by using forward-scatter and side-scatter parameters to eliminate debris and to count only cells that were alive prior to fixation.
Cell proliferation assays and cell sorting.
To measure bromodeoxyuridine (BrdU) incorporation, 72-h cultures of T lymphocytes were pulsed for 24 h with a 13 μM solution of BrdU (Sigma, St. Louis, Mo.). Cells were then fixed in ethanol, and DNA was denatured by incubation in 2 N HCl–0.5% Triton X-100 buffer. After the cells were washed, staining was done with an anti-BrdU antibody conjugated to fluorescein isothiocyanate (Pharmingen). Acquisition and analysis of the cells were done on a FACScan (Becton Dickinson).
To measure cell proliferation by fluorescence decrease of carboxyfluorescein succidimyl ester (CFSE; Molecular Probes, Eugene, Oreg.), T cells were labeled with CFSE prior to infection. Labeling was carried out for 10 min at 37°C at a concentration of 2 × 10⁶ cells/ml in culture medium containing 50 μM CFSE. Cells were washed three times to remove unincorporated dye and cultured with PHA and interleukin-2 (IL-2). After 4 days in culture, cells were either analyzed by flow cytometry or sorted on a FACStar into high-fluorescence (nonproliferating) and low-fluorescence (proliferating) cell populations. Cells were also lysed in sample buffer for sodium dodecyl sulfate-polyacrylamide gel electrophoresis (SDS-PAGE) and Western blotting.
Acridine orange staining.
To measure the DNA and RNA content of cells, 4-day cultures of MV-Ed-infected or noninfected lymphocytes were permeabilized with 80 mM HCl–0.1% Triton X-100–150 mM NaCl for 20 s, followed by addition of a staining buffer (37 mM citric acid, 126 mM Na2HPO4, 150 mM NaCl, 1 mM EDTA) containing 6 μg of acridine orange (Molecular Probes) per ml as described previously (8). Flow cytometric analysis of the cells was immediately carried out on a FACScan by using FL1 to measure DNA and FL3 to measure RNA.
Western blot analysis of cell cycle-regulatory proteins.
MV-Ed-infected or noninfected lymphocytes were lysed after PHA stimulation and 4 days of culture. Cells were lysed at 2 × 10⁷ to 4 × 10⁷ live cells/ml of lysis buffer (100 mM Tris-HCl, 4% SDS, 30% glycerol, 250 mM dithiothreitol). Equal quantities of protein were subjected to SDS-PAGE, and proteins were transferred onto polyvinylidene difluoride (PVDF) membranes (Millipore). The membranes were blocked in 1% blocking reagent (Boehringer Mannheim, Mannheim, Germany). Membranes were probed with various antibodies, and incubation was done in Tris-buffered saline (TBS)–0.5% blocking buffer for 2 h or overnight. Membranes were washed in TBS–0.1% Tween 20, and for murine primary antibodies, membranes were incubated first with a rabbit anti-mouse secondary antibody followed by protein A-125I (Amersham, Arlington Heights, Ill.). For rabbit primary antibodies, membranes were incubated directly with protein A-125I. Membranes were extensively washed in TBS–0.1% Tween 20, sealed in plastic pouches, and exposed to Kodak Biomax film at −70°C.
RESULTS
MV-Ed infection partially inhibits mitogen-induced T-cell proliferation.
In order to assess the percentage of cells entering S phase after PHA stimulation, we used the thymidine analogue BrdU to label proliferating T cells. Lymphocytes from the blood of healthy donors were isolated by Ficoll-Hypaque centrifugation. T-cell enrichment to >90% purity was done by eliminating adherent cells and depleting B cells with magnetic beads conjugated to an anti-CD19 antibody. The T cells were mock infected or infected with MV-Ed at a multiplicity of infection of 0.8 and cultured with PHA and IL-2. At 72 h postinfection (p.i.), mock- and MV-Ed-infected T cells were pulsed with BrdU for 24 h and an anti-BrdU-fluorescein isothiocyanate antibody was used to detect the BrdU-positive cells. A 50% inhibition of entry into S phase was observed for MV-Ed-infected T cells compared to mock-infected T cells. Fifty percent of the mock-infected cells entered S phase, compared with 21% of the MV-Ed-infected cells over the 24-h BrdU pulse.
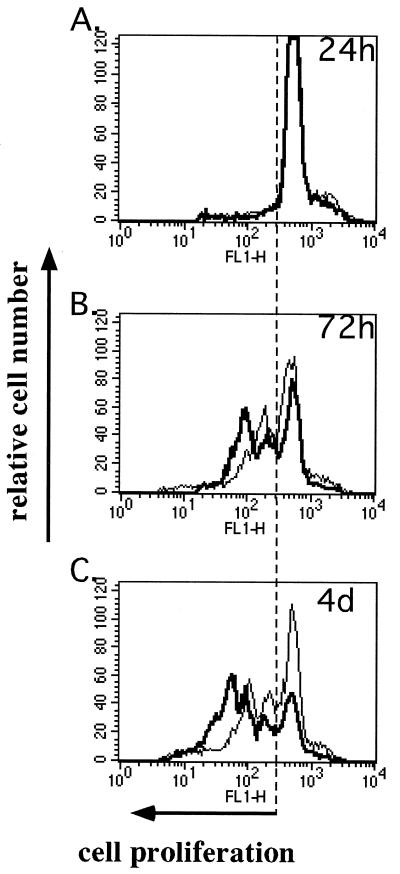
Since primary mitogen-stimulated T cells are not synchronized, we set up an assay to precisely detect the number of cell divisions occurring over a 4-day period in live cells. T cells were labeled with CFSE. This dye is colorless outside of the cell, and upon activation by cellular esterases inside the cell, CFSE binds to NH2 groups in the cytoplasm and becomes fluorescent. After labeling and stimulation of the cells, each cell division can be visualized by flow cytometry as a twofold decrease in fluorescence resulting from the CFSE being distributed to the daughter cells. Moreover, the CFSE assay allows separation of the MV-Ed-infected proliferating population from the MV-Ed-infected nonproliferating population.
Monitoring the percentage of growth-arrested cells by this technique gave a more refined image of the proliferation kinetics of MV-Ed-infected T cells (Fig. 1). However, this assay did not allow us to determine whether the growth-arrested cells were in G0 or G1 of the cell cycle. A 50% inhibition of proliferation was observed at 4 days p.i., thus corroborating the results obtained with BrdU incorporation. Forty percent of MV-Ed-infected T cells proliferated, compared to 80% of mock-infected T cells. Furthermore, the subpopulation of MV-infected cells that did proliferate did so more slowly than did their mock-infected counterparts (Fig. 1C). The percentage of MV-infected proliferating cells varied between 30 and 55%, depending on the blood donor, but results were reproducible when the assay was repeated with numerous donors. In these experiments, >95% of the T cells were infected; the entire proliferating population was infected and only the nonproliferating fraction contained noninfected cells as determined by surface MV hemagglutinin expression (data not shown). Furthermore, both populations of MV-infected cells contained equal numbers of MV-producing cells (one to two plaques/10 cells) as determined by cocultivation of T cells with Vero cells in an infectious-center assay. The infectious-center assay was performed after separating the growth-arrested high-fluorescence CFSE-labeled cells from the low-fluorescence proliferating cells by sorting on a FACStar.
FIG. 1.
Profile of proliferation of mock- and MV-Ed-infected T cells assayed with CFSE. T cells were labeled with CFSE, which fluorescently labels cells at 5 μM, mock (bold curve) or MV-Ed (fine curve) infected, and cultured with PHA (2 μg/ml) and IL-2 (50 U/ml). Cells were analyzed by flow cytometry for their decrease in fluorescence at 24 h, 72 h, and 4 days p.i.
These results suggest that although the cells are productively infected, only a subpopulation of T cells is susceptible to a complete proliferative block induced by MV-Ed. The phenotype of this subpopulation of cells did not correlate with the expression of CD4, CD8, CD45RA (naive T-cell), or CD45RO (memory T-cell) markers or with intracellular gamma interferon production (data not shown).
MV-Ed-infected T cells express normal levels of G1-phase activation antigens and maintain a high level of CD69 expression compared to mock-infected T cells.
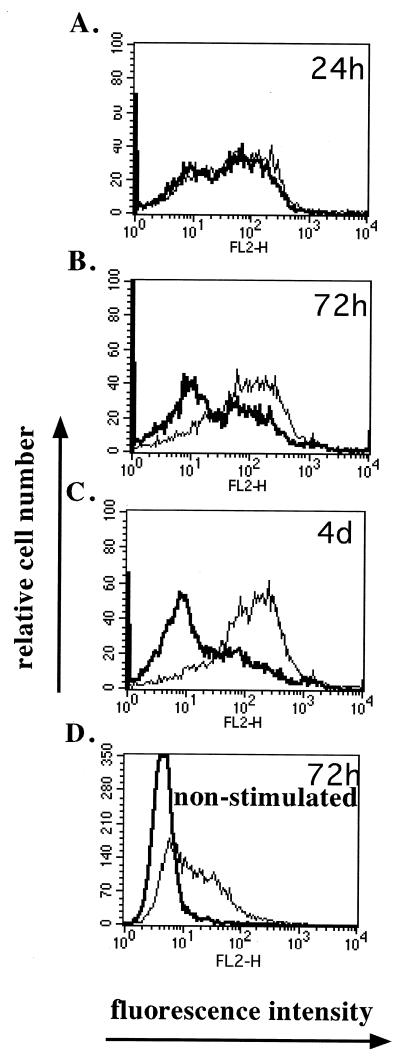
To determine whether the PHA-IL-2-stimulated T cells underwent proper activation and expression of G1 activation markers, the cells were surface stained for these markers. The expression of the earliest activation marker, CD69, and later markers of G1 progression, CD25 (IL-2 receptor α [IL-2Rα]) and CD71(transferrin receptor), was measured at various times p.i. by flow cytometry with specific antibodies. Upon activation of T cells, CD69 is expressed rapidly within 5 to 24 h poststimulation and then the expression level decreases. At 24 h p.i., mock- and MV-Ed-infected cells expressed similar levels of CD69 (Fig. 2A). At 72 h, however, mock-infected cells began downregulating CD69 expression whereas MV-Ed-infected cells did not (Fig. 2B). At 4 days p.i., most mock-infected cells no longer expressed CD69, whereas the majority of MV-Ed-infected cells still expressed a high level of CD69 (Fig. 2C). MV-Ed infection of nonstimulated T cells led to 40% of the cells expressing CD69 in the absence of proliferation (Fig. 2D). These observations were consistent over repeated experiments.
FIG. 2.
MV-Ed-infected T cells upregulate but do not downregulate CD69 after stimulation compared to mock-infected T cells. T cells were labeled with CFSE, mock (bold curve) or MV-Ed (fine curve) infected, and left unstimulated (D) or cultured with PHA (2 μg/ml) and IL-2 (50 U/ml) (A to C). Cells were surface labeled with antibodies specific to CD69 followed by a secondary phycoerythrin-conjugated immunoglobulin and then analyzed by flow cytometry at 24 h, 72 h, and 4 days p.i. Panel D shows CD69 expression on nonstimulated T cells at 72 h p.i.
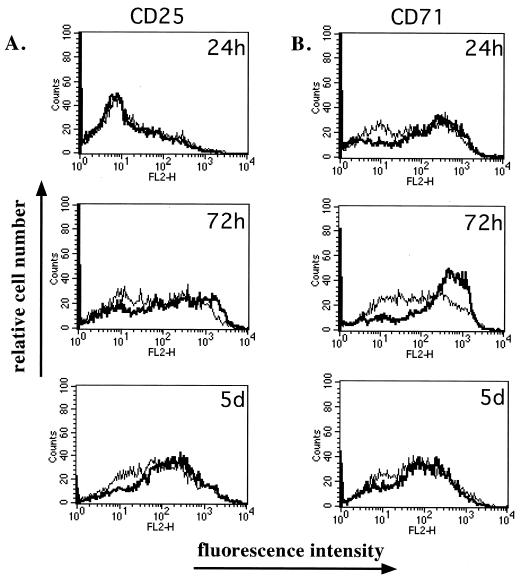
CD25 and CD71 expression levels were also monitored (Fig. 3). At all time points tested, CD71 molecules were expressed at similar levels on both mock- and MV-Ed-infected cells as shown previously (26) (Fig. 3A). However, CD25 expression was upregulated more slowly on MV-infected cells than on mock-infected cells (Fig. 3B). CD69, CD71, and CD25 were not expressed on unstimulated T cells (data not shown).
FIG. 3.
Activation markers CD25 and CD71 are expressed on MV-Ed-infected cells following stimulation. Mock-infected (bold curve) or MV-Ed-infected (fine curve) T cells were cultured with PHA and IL-2. At various times, cells were surface labeled with antibodies specific to CD25 or to CD71 followed by a secondary phycoerythrin-conjugated immunoglobulin. Analysis was done by flow cytometry.
MV-Ed infection leads to decreased expression of late G1/S-phase cyclins D3, E, and A.
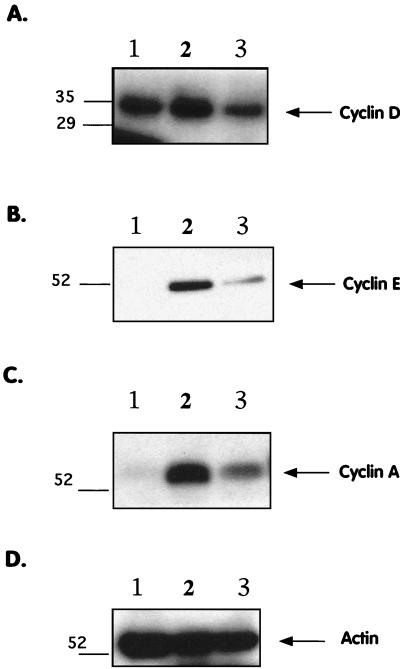
In order to determine whether the cell cycle block induced by MV-Ed was related to the dysregulation of one or more cell cycle regulatory proteins, the protein levels of certain key regulators in the G1-to-S transition were analyzed. Protein expression of the positive regulators of entry into S phase, such as cyclin D and cyclin E, as well as that of inhibitors, such as p27 and p21, was assessed by Western blotting. Mock- or MV-Ed-infected T cells were lysed in SDS-PAGE sample buffer 4 days p.i., and cellular proteins were probed with antibodies specific to the cell cycle regulators of G1-to-S phase transition. Figure 4A and B show that MV-Ed infection led to decreased expression of cyclin D3 and cyclin E, which play a role in phosphorylation of the Rb protein leading to entry into S phase. Densitometry analysis showed that MV-Ed infection led to an approximately threefold decrease in cyclin D3, while cyclin E was decreased sevenfold. Expression of cyclin A, an S-phase cyclin, was also reduced in MV-Ed-infected cells, likely due to inefficient passage of the cells into S phase (Fig. 4C). As a control, blots probed with antibodies specific to actin showed equal levels in MV-Ed-infected cells and mock-infected cells (Fig. 4D). The Western blots are representative examples of 5 to 10 experiments carried out on cells from different donors.
FIG. 4.
MV-Ed-infected T cells exhibit decreased expression of cyclins E and A. T cells were mock or MV-Ed infected, cultured with PHA and IL-2, and lysed at equal numbers in SDS-PAGE sample buffer at 4 days p.i. Lysates were subjected to SDS-PAGE, proteins were transferred onto PVDF filters, and blots were probed with antibodies specific to cyclin D3, cyclin E, cyclin A, and actin and then incubated with 125I and autoradiographed. Lanes 1 to 3 show nonstimulated cells, stimulated mock-infected cells, and stimulated MV-Ed-infected cells, respectively.
Activated nondividing MV-Ed-infected T cells do not downregulate expression of the universal Cdk inhibitor p27.
Expression of inhibitors of Cdk activity also regulates entry into S phase. p27kip1, which inhibits all Cdk, is constitutively expressed in quiescent cells, thus inhibiting passage to S phase. In normal lymphocytes, p27kip1 expression decreases upon stimulation to relieve the block in Cdk activity. Expression of other Cdk inhibitors, such as p21cip1, can be induced in response to DNA damage via the p53 protein.
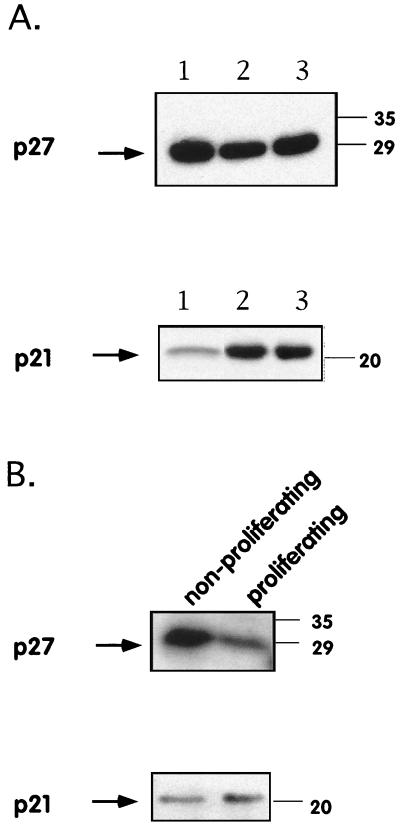
Expression of these inhibitors was first analyzed by performing Western blotting with specific antibodies on lysates from unsorted mock-infected and MV-Ed-infected T cells. We did not observe a difference in p27 expression and observed no significant induction of p21 in lysates from unsorted cells (Fig. 5A). The total population of MV-Ed-infected T cells was then sorted on a FACStar in order to separate the growth-arrested cells remaining highly fluorescent after CFSE labeling from the low-fluorescence proliferating cells having diluted their CFSE content. These sorted populations were then lysed and probed by Western blotting. The level of p27 expression was higher in growth-arrested MV-Ed-infected cells than in proliferating MV-Ed-infected cells. The p27 block was thus maintained in MV-Ed-infected arrested cells but not in MV-Ed-infected proliferating cells (Fig. 5B). p21, however, was expressed at similar levels in both populations of sorted cells (Fig. 5B). These results suggest that MV-Ed, in addition to leading to a decrease in cyclin expression, also prevents the p27 block from being lifted.
FIG. 5.
MV-Ed-infected T cells do not downregulate protein expression of the Cdk inhibitor p27kip following stimulation. T cells were labeled with CFSE, mock or MV-Ed infected, and cultured with PHA and IL-2. At 4 days p.i. unsorted cells were either lysed (A) or sorted on a Becton Dickinson FACStar cell sorter according to their fluorescence intensity (high fluorescence [nonproliferating cells] and low fluorescence [proliferating cells]) and then lysed (B). Cell lysis, SDS-PAGE, and protein blotting were carried out as described in Materials and Methods. Blots were then probed with antibodies to p27kip and p21cip. Lanes 1 to 3 show nonstimulated cells, stimulated mock-infected cells, and stimulated MV-Ed-infected cells, respectively. Numbers on the right are molecular masses, in kilodaltons.
MV infection suppresses Rb synthesis and upregulation of rRNA.
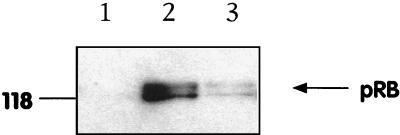
The observed decrease in G1 cyclin levels suggested that Rb hyperphosphorylation was occurring less efficiently in MV-Ed-infected cells. Rb protein expression is upregulated during the G1 phase and appears as a hypophosphorylated 110-kDa species. Rb becomes progressively hyperphosphorylated by cyclin-Cdk complexes, resulting in a 114-kDa form at the G1/S phase boundary. The Rb phosphorylation state was therefore analyzed by Western blotting. Mock- or MV-Ed-infected T cells were lysed at 4 days p.i., and the cellular proteins were probed with an antibody to Rb that recognizes both the hypo- and hyperphosphorylated forms (clone G3-245; Pharmingen). Rb protein was undetectable in unstimulated cells (Fig. 6, lane 1). Analysis of the level of expression of Rb revealed an approximately sevenfold decrease in the total Rb protein level in MV-Ed-infected cells. Both the hypophosphorylated G1-phase form and the hyperphosphorylated S-phase form of Rb were underexpressed compared to the levels in noninfected cells (Fig. 6). If the nonproliferating MV-Ed-infected fraction had been blocked in a classical G1 phase, we would expect the same overall quantity of Rb to be present in MV-Ed-infected and noninfected cells, with an increased relative proportion of the hypophosphorylated form of Rb in MV-Ed-infected cells. This would be observed even in a mixed population of growth-arrested and proliferating cells. However, no difference was observed in the relative proportions of the hypophosphorylated Rb species present in MV-Ed-infected T cells. Since PHA-stimulated lymphocytes are not synchronized, it is likely that both the hypo- and the hyperphosphorylated Rb proteins in these samples represent the cycling subpopulation. Thus, the low level of Rb expression in MV-Ed-infected cells suggested an inability to enter G1 phase from G0.
FIG. 6.
Upregulation of Rb protein is impaired in MV-infected stimulated T cells. T cells were mock or MV-Ed infected, cultured with PHA and IL-2, and lysed at equal numbers in SDS-PAGE sample buffer at 4 days p.i. Lysates were subjected to SDS-PAGE, proteins were transferred onto PVDF filters, and blots were probed with anti-Rb clone G3-245 (Pharmingen). Lanes 1 to 3 show nonstimulated cells, stimulated mock-infected cells, and stimulated MV-Ed-infected cells, respectively. The number at the left is a molecular mass, in kilodaltons.
Since the pattern of Rb expression was inconsistent with the expression of G1 cell surface activation markers, we used the technique of acridine orange staining of RNA as an alternative method to determine whether the growth-arrested cells were in G1 or in G0. Progression through the cell cycle is associated with an increase in cellular RNA content. As approximately 80% of total cellular RNA is rRNA, and resting G0 cells have 5- to 10-fold fewer ribosomes than do cycling cells, acridine orange staining discriminates between G0 cells with few ribosomes and G1, S, and G2 cells with a much higher level of ribosomes (9).
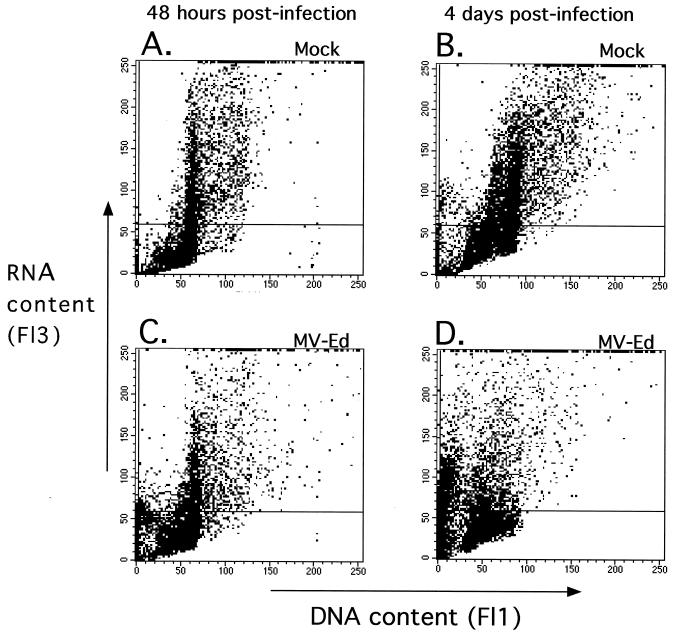
Acridine orange is a metachromatic dye that is absorbed and emitted at very different wavelengths when bound to double-stranded versus single-stranded nucleic acids. When intercalated into double-stranded DNA it fluoresces green, and when bound to single-stranded RNA it fluoresces red (8). Permeabilization of cells in the presence of EDTA ensures denaturation of the RNA into single-stranded molecules. MV-Ed-infected and mock-infected T lymphocytes were stimulated as in previous experiments, permeabilized, and stained with acridine orange at various times poststimulation. RNA and DNA levels were assessed by flow cytometry. At 48 h after stimulation and infection, higher RNA levels could be seen in mock-infected cells than in MV-Ed-infected cells (Fig. 7A and C). At 4 days p.i., an increase in DNA content was seen (Fig. 7B), indicating progression through S phase. The DNA content of most of the cells in the MV-Ed-infected population did not increase by 4 days p.i. (Fig. 7D), as would be expected in growth-arrested cells. Nevertheless, the RNA content was also decreased by approximately 50% in MV-Ed-infected cells (Fig. 7C and D) compared to that in uninfected cells. If the MV-Ed-infected cells were arrested in G1, it would be predicted that RNA levels would increase even if DNA levels did not. These results suggest, however, that the MV-Ed-infected arrested lymphocytes were blocked not in G1 phase but rather in a G0-like state.
FIG. 7.
Upregulation of cellular RNA is severely impaired in MV-infected T cells stimulated with PHA. Cultures of mock- or MV-infected stimulated T cells were permeabilized and stained with acridine orange at 48 h or 4 days after infection and stimulation. The cells were analyzed on a FACScan. The horizontal marker has been set on nonstimulated PBMC.
DISCUSSION
This work demonstrates that two populations of MV-Ed-infected cells can respond differently to mitogenic stimulation. The majority of the MV-Ed-infected cells undergo activation but do not upregulate rRNA synthesis necessary for cell cycle progression. G1 cyclins and Rb are expressed at lower levels and a high level of the Cdk inhibitor p27 is maintained. Despite the expression of G1-phase activation markers, such as CD69, the lymphocytes are in a quiescence-like G0 state in terms of rRNA production and DNA synthesis.
We have extended previous studies documenting normal activation marker expression in MV-infected T lymphocytes (25, 37). There are conflicting reports in the literature concerning IL-2Rα/CD25 surface expression on MV-Ed-infected stimulated T cells. Previous work in our laboratory has shown no difference in IL-2Rα expression between stimulated mock- and MV-Ed-infected T cells (25), whereas a study by Bell et al. (2) has shown a downregulation of IL-2Rα surface expression in MV-Ed-infected antigen-stimulated T-cell clones and mitogen-stimulated bulk PBMC. We found that mitogen-induced upregulation of IL-2Rα expression on MV-Ed-infected cells is slower than on mock-infected T cells up to 72 h p.i., reaching equal levels of expression by 4 to 5 days p.i. Thus, a likely explanation for these discrepancies is that Bell et al. (2) analyzed upregulation of IL-2Rα at 48 h p.i. and not later time points. McChesney et al. (25, 26) analyzed the cells at 24 and 48 h p.i. after stimulation with tetradecanoyl phorbol acetate-ionophore. This combination is a stronger T-cell activator than either PHA or antigen stimulation, and so any defect in IL-2Rα upregulation was likely masked.
Mitogen-stimulated T lymphocytes asynchronously leave G0, progress through G1, and initiate DNA replication. As cells enter G1, rRNA synthesis levels increase, allowing the cell to translate the mRNAs necessary for DNA replication and cell division. It has been observed that a 50% reduction in translation is sufficient to cause proliferating cells to withdraw from the cycle (4). Our results show a 50% inhibition of RNA synthesis, which is likely sufficient to prevent cells from entering the cycle. The rate of progression of the cells through S phase has been shown to be inversely correlated to the number of ribosomes in a cell. Thus, the duration of S phase varies from cell to cell, with the shortest S phase lasting 5 h and the longest lasting up to 30 h (9). Our results in Fig. 1 show that MV-Ed-infected proliferating cells progress through the cell cycle more slowly than do mock-infected cells. We can hypothesize that the growth-arrested subpopulation of MV-infected T cells does not upregulate RNA and thus cannot leave G0, while the proliferating subpopulation of MV-infected T cells upregulates rRNA less efficiently than do mock-infected T cells and so progresses through S phase more slowly due to a decreased number of ribosomes.
Our and others’ results clearly show that MV-infected T cells express G1 activation markers which, under normal conditions, are not expressed during G0 phase. This suggests that the signaling required to induce CD69, CD71, and CD25 mRNA transcription is likely unaffected by MV-Ed. Furthermore, as resting cells are not devoid of ribosomes and have a basal level of translation, these mRNAs could be translated. MV-Ed infection, therefore, appears to have uncoupled activation of signal transduction from cell cycle progression. This hypothesis is supported by the high levels of CD69 expression observed in MV-infected growth-arrested T cells. As there are few, if any, cases of CD69 expression in the absence of proliferation, many investigators have used CD69 expression not only as a marker of activation but also as a marker of proliferation (6, 23). The extent of upregulation of CD69 has been considered to be a correlate of the proliferative capacity of mitogen-stimulated PBMC from human immunodeficiency virus-infected patients (22). MV-Ed infection therefore uncouples CD69 upregulation from G0-to-G1 transition and from mitogen-induced proliferation.
We have not yet elucidated the mechanism by which MV induces sustained CD69 expression while maintaining the cell in a G0-like state. The signals necessary for cell cycle-induced upregulation of Rb synthesis and rRNA production have not yet been clearly defined. Furthermore, the role of p27 in these events is unknown. However, dysregulation of proteins involved in rRNA transcription and processing, such as RNA polymerase I and nucleolin, could be potential targets for the observed MV-induced suppression. The observation that MV may affect resting T cells at a much earlier state than previously suspected provides a starting point from which to study upstream events leading to the perturbation of the cell cycle machinery (i.e., signal transduction and cytokine production) as well as a basis for studying downstream effects of this block (i.e., nonresponsiveness and apoptosis). MV-Ed infection may have a direct effect on rRNA processing proteins or an indirect effect via induction of a growth-inhibitory cytokine or transduction of a growth-inhibitory signal. Unlike MV, viruses such as simian virus 40 and polyomavirus have been shown to lead to an early increase of rRNA in infected cells. This occurs via a direct virus effect potentiating a cellular increase in polymerase I transcription (27).
We have studied a population of cells that were infected at a level of >90%, strongly suggesting that our observation is most likely due to direct interaction of MV with the T lymphocyte. However, we cannot exclude the involvement of a soluble factor, as reported earlier by Sanchez-Lanier et al. (28). Studies by others also suggest that MV-induced immunosuppression could be due to cytokine imbalances, including a decrease in IL-12 production (16, 19, 34). Schlender and colleagues, however, did not observe a soluble-factor-mediated growth suppression but obtained evidence suggesting transmission of a growth-inhibitory signal from an infected cell to an uninfected cell (29). Regardless of the upstream cause, the downstream effect on the cell cycle is likely to be similar.
The question as to whether direct perturbation of the cell cycle has physiological relevance to immunosuppression remains. In terms of numbers of infected cells, at day 3 of the rash, it has been observed that approximately 1 in 18 to 1 in 300 PBMC is infected (13). We can assume that the numbers of infected cells are more elevated at the peak of virus replication, which occurs before the rash, and that limitations in detection sensitivity are likely to lead to an underestimation of the number of infected cells. Furthermore, the infection level in lymph nodes, where the majority of the lymphoid cells reside, has not been determined for humans and is likely to be significantly higher than the observed numbers of infected circulating PBMC. This conclusion is strongly suggested by recent observations in the rhesus macaque model of MV infection, for which infectious-center assays show 5 × 10⁵ 50% tissue culture infective doses of MV present per 106 lymph node cells at day 6 p.i. (38).
Immunosuppression as defined by T-cell nonresponsiveness is prolonged well after clearance of detectable virus (14). Direct infection may, then, be relevant in the lymph nodes at early times of infection, while the long-lasting immunosuppression could be due to downstream events associated with MV infection. Our studies suggest that MV has different effects on different subpopulations within the general population of CD4+ and CD8+ T cells. The suppression of rRNA and Rb protein upregulation in a subpopulation of T cells may well lead to apoptosis of these T cells and/or to a long-lasting imbalance in T-cell function, including cytokine secretion. Studies to resolve the molecular and biologic differences between the two subpopulations of cells (G0-blocked and proliferating MV-infected T cells) are currently under way, as are investigations of whether the corresponding cell cycle dysfunctions also occur in vivo during acute natural MV infection of humans or experimental MV infection of macaques.
ACKNOWLEDGMENTS
This work was supported by NIH grant AI39466, NIH training grant AG00080, and WHO grant V21/181/119 to Denise Naniche.
We thank John Patterson and Marianne Manchester for helpful discussions.
REFERENCES
- 1.Beijersbergen R L, Bernards R. Cell cycle regulation by the retinoblastoma family of growth inhibitory proteins. Biochim Biophys Acta. 1996;1287:103–120. doi: 10.1016/0304-419x(96)00002-9. [DOI] [PubMed] [Google Scholar]
- 2.Bell A F, Burns J B, Fujinami R S. Measles virus infection of human T cells modulates cytokine generation and IL-2 receptor alpha chain expression. Virology. 1997;232:241–247. doi: 10.1006/viro.1997.8577. [DOI] [PubMed] [Google Scholar]
- 3.Blumberg B M, Giorgi C, Kolakofsky C. N protein of vesicular stomatitis virus selectively encapsidates leader RNA in vitro. Cell. 1983;32:559–567. doi: 10.1016/0092-8674(83)90475-0. [DOI] [PubMed] [Google Scholar]
- 4.Brooks R F. Continuous protein synthesis is required to maintain the probability of entry into S phase. Cell. 1977;12:311–317. doi: 10.1016/0092-8674(77)90209-4. [DOI] [PubMed] [Google Scholar]
- 5.Burnet F M. Measles as an index of immunological function. Lancet. 1968;ii:610–613. doi: 10.1016/s0140-6736(68)90701-0. [DOI] [PubMed] [Google Scholar]
- 6.Caruso A, Licenziati S, Corulli M, Canaris A D, DeFrancesco M A, Fiorentini S, Peroni L, Fallacara F, Dima F, Balsari A, Turano A. Flow cytometric analysis of activation markers on stimulated T cells and their correlation with cell proliferation. Cytometry. 1997;27:71–76. doi: 10.1002/(sici)1097-0320(19970101)27:1<71::aid-cyto9>3.0.co;2-o. [DOI] [PubMed] [Google Scholar]
- 7.Coats S, Flanagan W M, Nourse J, Roberts J M. Requirement of P27kip1 for restriction point control of the fibroblast cell cycle. Science. 1996;272:877–880. doi: 10.1126/science.272.5263.877. [DOI] [PubMed] [Google Scholar]
- 8.Darzynkiewicz Z, Traganos F, Sharpless T, Melamed M R. Lymphocyte stimulation: a rapid multiparameter analysis. Proc Natl Acad Sci USA. 1976;73:2881–2884. doi: 10.1073/pnas.73.8.2881. [DOI] [PMC free article] [PubMed] [Google Scholar]
- 9.Darzynkiewicz Z, Evenson D, Staiano-Coico L, Sharpless T, Melamed M R. Relationship between RNA content and progression of lymphocytes through S phase of cell cycle. Proc Natl Acad Sci USA. 1979;76:358–362. doi: 10.1073/pnas.76.1.358. [DOI] [PMC free article] [PubMed] [Google Scholar]
- 10.Dulic V, Lees E, Reed S I. Association of human cyclin E with a periodic G1-S phase protein kinase. Science. 1992;257:1958–1961. doi: 10.1126/science.1329201. [DOI] [PubMed] [Google Scholar]
- 11.Dutko F J, Oldstone M B A. Genomic and biological variation among commonly used lymphocytic choriomeningitis virus strains. J Gen Virol. 1983;64:1689–1698. doi: 10.1099/0022-1317-64-8-1689. [DOI] [PubMed] [Google Scholar]
- 12.Fireman P, Friday G, Kumate G. Effects of measles vaccine on immunological responsiveness. Pediatrics. 1969;43:264. [PubMed] [Google Scholar]
- 13.Forthal D N, Aarnaes S, Blanding J, Maza L, Tilles J. Degree and length of viremia in adults with measles. J Infect Dis. 1992;166:421–424. doi: 10.1093/infdis/166.2.421. [DOI] [PubMed] [Google Scholar]
- 14.Griffin D E. Immune responses during measles virus infection. Curr Top Microbiol Immunol. 1995;191:117–134. doi: 10.1007/978-3-642-78621-1_8. [DOI] [PubMed] [Google Scholar]
- 15.Griffin D E, Bellini W J. Measles virus. In: Fields B N, Knipe D M, Howley P M, editors. Fields virology. Philadelphia, Pa: Lippincott-Raven; 1996. pp. 1267–1312. [Google Scholar]
- 16.Griffin D E, Ward B J. Differential CD4 T cell activation in measles. J Infect Dis. 1993;168:275–281. doi: 10.1093/infdis/168.2.275. [DOI] [PubMed] [Google Scholar]
- 17.Hirsch R L, Griffin D E, Johnson R T, Cooper S J, Lindo de Soriano I, Roedenbeck S, Vaisberg A. Cellular immune responses during complicated and uncomplicated measles virus infections of man. Clin Immunol Immunopathol. 1984;31:1–12. doi: 10.1016/0090-1229(84)90184-3. [DOI] [PubMed] [Google Scholar]
- 18.Hutchins G, Janeway C. Observation on the relationship of measles and remissions in the nephrotic syndrome. Am J Dis Child. 1947;73:242. [PubMed] [Google Scholar]
- 19.Karp C L, Wysocka M, Wahl L M, Ahearn J M, Cuomo P J, Sherry B, Trinchieri G, Griffin D E. Mechanism of suppression of cell-mediated immunity by measles virus. Science. 1996;273:228–231. doi: 10.1126/science.273.5272.228. [DOI] [PubMed] [Google Scholar]
- 20.Katz S L, Enders J F, Kibrick S. Immunization of children with live attenuated measles vaccine. Am J Dis Child. 1959;98:605–607. [Google Scholar]
- 21.Koff A, Giordano A, Desai D, Yamashita K, Harper J W, Elledge S, Nishimoto T, Morgan D O, Franza B R, Roberts J M. Formation and activation of a cyclin E-Cdk2 complex during the G1 phase of the human cell cycle. Science. 1992;257:1689–1694. doi: 10.1126/science.1388288. [DOI] [PubMed] [Google Scholar]
- 22.Krowka J F, Cuevas B, Maron D C, Steimer K S, Ascher M S, Sheppard H W. Expression of CD69 after in vitro stimulation: a rapid method for quantitating impaired lymphocyte responses in HIV-infected individuals. J Acquired Immune Defic Syndr Hum Retrovirol. 1996;11:95–104. doi: 10.1097/00042560-199601010-00013. [DOI] [PubMed] [Google Scholar]
- 23.Mardiney M, Brown M R, Fleisher T A. Measurement of T cell CD69 expression: a rapid and efficient means to assess mitogen- or antigen-induced proliferative capacity in normals. Cytometry. 1996;26:305–310. doi: 10.1002/(SICI)1097-0320(19961215)26:4<305::AID-CYTO11>3.0.CO;2-V. [DOI] [PubMed] [Google Scholar]
- 24.Matsushime H, Quelle D E, Shurtleff S A, Shibuya C J. D-type cyclin-dependent kinase activity in mammalian cells. Mol Cell Biol. 1994;14:2066–2076. doi: 10.1128/mcb.14.3.2066. [DOI] [PMC free article] [PubMed] [Google Scholar]
- 25.McChesney M B, Altman A, Oldstone M B A. Suppression of T lymphocyte function by measles virus is due to cell cycle arrest in G1. J Immunol. 1988;140:1269–1273. [PubMed] [Google Scholar]
- 26.McChesney M B, Kehrl J H, Valsamakis A, Fauci A S, Oldstone M B A. Measles virus infection of B lymphocytes permits cellular activation but blocks progression through the cell cycle. J Virol. 1987;61:3441–3447. doi: 10.1128/jvi.61.11.3441-3447.1987. [DOI] [PMC free article] [PubMed] [Google Scholar]
- 27.Petralia S, Soprano K, Pochron S, Darzynkiewicz Z, Traganos F, Baserga R. Increase in cellular RNA in cells infected with DNA oncogenic viruses. Cancer Res. 1980;40:3177–3180. [PubMed] [Google Scholar]
- 28.Sanchez-Lanier M, Guerin P, McLaren L C, Bankhurst A D. Measles virus-induced immunosuppression of lymphocyte proliferation. Cell Immunol. 1988;116:367–381. doi: 10.1016/0008-8749(88)90238-9. [DOI] [PubMed] [Google Scholar]
- 29.Schlender J, Schnorr J J, Spielhofer P, Cathomen T, Cattaneo R, Billeter M A, Ter Meulen V, Schneider-Schaulies S. Interaction of measles virus glycoproteins with the surface of uninfected peripheral blood lymphocytes induces immunosuppression in vitro. Proc Natl Acad Sci USA. 1996;93:13194–13199. doi: 10.1073/pnas.93.23.13194. [DOI] [PMC free article] [PubMed] [Google Scholar]
- 30.Sherr C J. G1 phase progression cycling on cue. Cell. 1994;79:551–555. doi: 10.1016/0092-8674(94)90540-1. [DOI] [PubMed] [Google Scholar]
- 31.Sherr C J, Roberts J M. Inhibitors of mammalian G1 cyclin-dependent kinases. Genes Dev. 1995;9:1149–1163. doi: 10.1101/gad.9.10.1149. [DOI] [PubMed] [Google Scholar]
- 32.Tamashiro V G, Perez H H, Griffin D E. Prospective study of the magnitude and duration of changes in tuberculin reactivity during uncomplicated and complicated measles. Pediatr Infect Dis J. 1987;6:451–454. doi: 10.1097/00006454-198705000-00007. [DOI] [PubMed] [Google Scholar]
- 33.Von Pirquet C. Das Verhalten der kutanen Tuberculinreaktion während der Masern. Dtsch Med Wochenschr. 1908;34:1297. [Google Scholar]
- 34.Ward B J, Johnson R T, Vaisberg A, Jauregui E, Griffin D E. Cytokine production in vitro and the lymphoproliferative defect of natural measles virus infection. Clin Immunol Immunopathol. 1991;61:236–248. doi: 10.1016/s0090-1229(05)80027-3. [DOI] [PubMed] [Google Scholar]
- 35.Whittle H C, Dossetor J, Oduloju A, Bryceson A D, Greenwood B M. Cell-mediated immunity during natural measles infection. J Clin Investig. 1978;62:678–684. doi: 10.1172/JCI109175. [DOI] [PMC free article] [PubMed] [Google Scholar]
- 36.Xiong Y, Zhang H, Beach D. D type cyclins associate with multiple protein kinases and the DNA replication and repair factor PCNA. Cell. 1992;71:505–514. doi: 10.1016/0092-8674(92)90518-h. [DOI] [PubMed] [Google Scholar]
- 37.Yanagi Y, Cubitt B A, Oldstone M B A. Measles virus inhibits mitogen-induced T cell proliferation but does not directly perturb the T cell activation process inside the cell. Virology. 1992;187:280–289. doi: 10.1016/0042-6822(92)90316-h. [DOI] [PubMed] [Google Scholar]
- 38.Zhu Y D, Heath J, Collins J, Greene T, Antipa L, Rota P, Bellini W, McChesney M. Experimental measles. II. Infection and immunity in the rhesus macaque. Virology. 1997;233:85–92. doi: 10.1006/viro.1997.8575. [DOI] [PubMed] [Google Scholar]


