

Abstract
In this work, we present the results of the ortho-positronium (o-Ps) annihilation lifetimes and nitrogen adsorption measurements for different porous materials and an approach for describing the annihilation of o-Ps in a pore, which results in a surface-volume formula (SVF) for calculating the pore-related o-Ps lifetime. This proposed formula gives the relationship between the o-Ps annihilation rate and the effective pore radius, bulk composition, and pore structure, including pore geometry and topology. The pore-related o-Ps lifetimes of different materials calculated by the SVF are consistent with experimental results for both micro- and mesopores (and macropores) with different geometries and topologies. The SVF is convenient for calculations of pore dimensions for many cases of metal organic frameworks and zeolites. This approach enables us to fully explain the temperature dependence of the o-Ps annihilation lifetime over a wide temperature range, 20–700 K.
Subject terms: Chemistry, Materials science, Physics
Introduction
Nanoporous materials have been intensively researched for synthesis and applications because of their potential applications in adsorption, hydrogen storage, catalysis, bioseparation, gas separation, and energy storage1–4. These characteristics are influenced by the pore morphology, topology, geometrical size, surface area, and surface-to-volume ratio S/V5–8 (S and V are the pore surface area and volume, respectively), which are directly related to the reaction rate of catalysts, diffusion of small molecules, heat conduction, thermoregulation of objects, and selective absorption of molecules1–8. Conventionally, gas adsorption measurements9 have been used for the determination of pore surface area and volume; however, this approach presents challenges when working with microporous materials9, closed pores and thin films10. In addition to the diffraction method and density functional calculations11, positron annihilation lifetime spectroscopy (PALS) is a powerful method used for characterizing the pore structures of nanoporous materials10,12,13. Positronium is a metastable bound state of a positron and an electron, formed in bulk-sized insulators or at the pore surface, which can be used to elucidate pore structure in such materials. Positronium can be formed as a singlet state, 1S0, with antiparallel spins (S = 0), known as para-positronium (p-Ps), or it can be formed as a triplet state, 3S1, with parallel spins (S = 1), known as ortho-positronium. The p-Ps state has a short lifetime of 125 ps, while o-Ps has a longer lifetime of 142 ns in vacuum. In the medium of materials, the lifetime of o-Ps is shortened due to the pick-off annihilation with surrounding electrons. In porous media, the o-Ps lifetimes are reported to be closely correlated with the pore radius12,13.
There are several models related to o-Ps annihilation in pores12–21. Tao12 modelled small pores by a finite potential well with a finite thickness of the electron cloud, ΔR, in the bulk surrounding the pore, in which o-Ps undergoes pick-off annihilation with a constant rate of 2 ns−1. The probability of o-Ps penetrating in this layer is reported to be proportional to the pore size12. For convenience of calculation, Eldrup et al.13 later calculated the pore-related o-Ps lifetime using the normalized wavefunction of the o-Ps in an infinite potential well and proposed the widely used formula named the Tao-Eldrup (TE) model12,13, which has been successfully applied for subnanometre-sized spherical micropores. However, this model failed to predict the experimental results for pores with radii exceeding 1 nm14. Consolati et al.16 extended the TE model for larger pores with different geometrical considerations. Another way to extend the TE model can be found in the works of Goworek et al.17 and Ciesielski et al.18, who were the first to propose integrating all the populations of possible excited states of a particle in a spherical (or cylindrical) infinite potential well. However, due to mathematical difficulties, Goworek et al.17 and Ciesielski et al.18 were unable to provide a quantitative formula for the relationship between pore size and mean o-Ps annihilation rate. Gidley et al.19 and Dull et al.20 developed this approach and successfully integrated the populations of the thermally excited o-Ps states derived from the Schrödinger equation using a rectangular infinite potential. This led to the TE-extended rectangular (RTE) model19,20. The main features of the above extensions are using the normalized wavefunctions of the o-Ps state in an infinite potential well to calculate the probability of o-Ps in the electron layer, ΔR, inside an expanded pore13,16–20. The pick-off annihilation rate is assumed to be a constant of 2 ns−1 in this electron layer, ΔR, for all materials12–20. Using the Boltzmann distribution for thermal excited states of the o-Ps, the RTE formula can explain the dependence of the o-Ps lifetime on temperatures higher than 273 K. The above RTE extensions have gained an advantage in extending the calculations of the o-Ps lifetimes for pore sizes larger than that of the TE model and explaining the o-Ps lifetime dependence in the high-temperature range. However, these solutions are still incomplete. The applications of such models for many cases of mesopores show disagreements with experimental results. The temperature dependence of the o-Ps lifetime calculated by the RTE model is inconsistent with experimental results21 at temperatures lower than 273 K. It is the fact that using an infinite potential well is convenient for the analytical derivation of the Schrödinger equation; however, it is not appropriate for larger pore sizes. In addition to the above solution for extending the TE model for large pores, the factor κ, explained as the relative contact density16, can be introduced16 for the correction of 3γ-intrinsic annihilation. However, the analytical expression of the pore radius dependence of this correction factor, κ, has not been found. Another way to extend the TE model can be found in the work of Ito et al.14. Instead of adjusting the factor κ for the self-decaying rate in the medium, Ito et al.14 adjusted the fraction of the o-Ps probability related to the pick-off annihilation by multiplying that of the TE formula13 by an empirical decreasing function of the pore radius. This practice solution has successfully calculated the o-Ps annihilation lifetime for larger pores14. Nevertheless, the formula of Ito et al.14 and simple model of Wada et al.15 cannot deal with pores with different shapes, which strongly influence the o-Ps lifetime calculations, and it did not take into account the explanation for the temperature dependence of the o-Ps lifetime. Furthermore, the influences of bulk composition22 and pore topology23 have not been considered by the aforementioned works12–21. To extend the TE model for complex geometries of the pore network, Zubia et al.23 recently implemented the atomic model and provided a numerically calculated result for microporous zeolites. However, to better interpret the o-Ps lifetimes associated with various pore sizes and topologies of different types of porous materials, the aforementioned models12–20,23 are suggested to be improved by another approach that is different from those of TE-extended models. Again, regarding the reason for the limitation of the RTE model in explaining the o-Ps lifetime-dependent on the low temperature range, it is suggested that the use of the Boltzmann distribution for the population of o-Ps states is suitable only for the high temperature range but is not appropriate for low temperatures. The dependence of the o-Ps lifetime on the low temperature range has been explained later by Dutta et al.21 Nevertheless, the empirical formula of Dutta et al.21 is unsuitable for temperatures greater than 273 K. These problems have not been completely resolved by existing models12–21,23. Meanwhile, research studies using PALS have been increasing. Researchers are interested in applying the PALS method to various porous materials, such as MOFs24,25, thin films10,26,27, microporous zeolites28,29 and polymers30, mesoporous silica31 and zeolites32.
To consider the characteristics of o-Ps annihilation associated with different porous materials of different pore sizes, bulk compositions, pore geometries and topologies, in this work, we present experiments with the results of both PALS and nitrogen adsorption–desorption measurements for different porous materials and an approach using a finite potential well for o-Ps annihilation in a pore. Relating to the model of o-Ps annihilation in a pore, we assume that o-Ps undergoes pick-off annihilation in both regions, including the outer12,13 and inner21 electrons of the pore volumes. Here, the electron density in the pore inner volume is assumed to arise due to the thermal atomic vibration amplitude at the pore surface21,33, and the electron density in the pore outer volume is considered to be the bulk electron density12,16–20. This approach has resulted in the surface-volume formula (SVF) giving the o-Ps calculation of the o-Ps annihilation rate depending on the surface-to-volume ratio and on the temperature. The effect of bulk composition on the o-Ps lifetime is included. SVF is suitable for calculations of both micro- and mesopores. Experimentally, we perform PALS measurements for the MOF of AL-Mil-5334, zeolites ZSM-52,35, MCM-4136, zeolites 5A37 and 13X38. The experimental results of AL-Mil-53, ZSM-5 and MCM-41 are also used to calibrate the SVF calculations into experimental results for the determination of the SVF parameters by a consistent system of transcendental equations. Notably, this procedure is needed and found in many other models13,14,19,20 in which the RTE calculations are calibrated by using the TE calculations13. Al-Mil-53 is a metal–organic framework with a Mil-53 pore topology and a large breathing effect34, ZSM-535 is a hierarchical microporous zeolite with mfi topology, and MCM-41 is a mesoporous silica material with a channel shape. These materials are currently receiving much attention due to their unique properties in gas adsorption, removal of chemical and biological compounds, catalysis, and industrial use2,37,39–43. We did not carry out gas adsorption measurements for 5A and 13X to calibrate the SVF calculation with the PALS results. However, the measured o-Ps lifetimes associated with 5A and 13X can be used to calculate their pore sizes, which is consistent with other reports. The o-Ps lifetimes calculated by SVF for micropores approximately agree with those calculated by the TE and RTE models (pore diameters < 2 nm) and agree with other experimental data in the literature obtained from micropores and mesopores. The temperature dependence of the o-Ps annihilation simulated by the SVF is consistent with the experimental results of the literature18–21 in the range of 20–700 K. The experimental results of the o-Ps lifetimes of this work and related references are performed under vacuum conditions.
Results
The experimental results
The experimental results are presented in Tables 1 and 2. The o-Ps lifetimes of all samples, AL-Mil-53, ZSM-5, MCM-41, zeolites 5A and 13X, are shown in Table 1, in which τ1–τ4 are lifetime components with intensities I1–I4. The results of the surface areas and volumes of MCM-41, ZSM-5 and Al-Mil-53, which represent different pore sizes, geometries and topologies, are presented in Table 2. Here, SBET is the surface area given by the Brunauer–Emmett–Teller (BET) equation9, Sext, Vads, Smicro, and Vmicro are the external surface area, adsorption volume, microsurface area, and micropore volume, respectively, obtained from isotherm adsorption measurements and the t-plot method9,44. Additionally, Smicro and Vmicro are associated with the micropores of ZSM-5 and Al-Mil-53 and are used to calculate the ratio 3 V/S used to calibrate the SVF into experimental results. For the case of MCM-41, the measurement shows no micropores, the pore surface area and volume of mesopores are ascribed to SBET and Vads, and the effective pore radius is calculated by 3Vads/SBET and is also used for the calibration to calculate the parameters of the SVF expression. For zeolites 5A and 13X, we performed the measurement for positron lifetimes only but did not carry out measurements of nitrogen adsorption for these samples. This is because their narrow pores with radii of subnanometres are not quite effectively accessed by gas adsorption methos9. Furthermore, there may be a difference in the positronium and nitrogen adsorption on these micropores; therefore, the calibration and comparison of SVF calculations with the experimental results of nitrogen adsorption for 5A and 13X are not considered. Note that ZSM-5 and AL-Mil-53 are microporous materials with pore radii of subnanometres; however, they also contain larger pores in their network structures. The results of pore surface areas and volumes of ZSM-5 and Al-Mil-53 presented in Table 2 are suggested to be associated with the pore of the effective radii, defined as 3 V/S, greater than 1 nm. These experimental results show that the pore-related o-Ps lifetime depends not only on the pore sizes but also on the bulk composition and structure, pore geometry and topology. Namely, for the cases of ZSM-5 and Al-Mil-53, although both have the same effective pore radii, the pore-related lifetime, τ4, associated with ZSM-5 is greater than that of Al-Mil-53. This fact is beyond the interpretation of previous models19–21. Note that although ZSM-5, 5A and 13 X are microporous materials with pore radii of subnanometres, the pore geometry and topology of ZSM-5, different from those of 5A and 13X, have created larger pores with long lifetime components. The presented results clearly show that the long lifetimes of ZSM-5 and Al-Mil-53 are induced by the main pore network, not by defects.
Table 1.
The results of PALS measurements deconvoluted by PALSfit fitting45.
| Samples | τ1 (ns) | τ2 (ns) | τ3 (ns) | τ4 (ns) | I1 (%) | I2 (%) | I3 (%) | I4 (%) | χ2 |
|---|---|---|---|---|---|---|---|---|---|
| MCM-41 | 0.184 ± 0.003 | 0.470 ± 0.007 | 2.87 ± 0.09 | 43.40 ± 0.56 | 63.4 ± 0.8 | 26.6 ± 0.8 | 2.0 ± 0.1 | 8.0 ± 0.1 | 1.032 |
| ZSM-5 | 0.200 ± 0.002 | 0.600 ± 0.004 | 3.54 ± 0.09 | 35.80 ± 0.88 | 48.9 ± 0.4 | 42.1 ± 0.4 | 3.0 ± 0.5 | 6.0 ± 0.8 | 1.034 |
| Al-Mil-53 | 0.209 ± 0.003 | 0.490 ± 0.009 | 3.14 ± 0.20 | 32.20 ± 3.42 | 71.0 ± 1.1 | 25.1 ± 1.1 | 1.4 ± 0.1 | 2.5 ± 0.2 | 1.030 |
| Zeolite 5A | 0.167 ± 0.003 | 0.530 ± 0.006 | 2.22 ± 0.17 | 5.21 ± 0.10 | 38.9 ± 0.6 | 48.7 ± 0.4 | 4.8 ± 0.3 | 7.7 ± 0.4 | 1.065 |
| Zeolite 13X | 0.167 ± 0.003 | 0.520 ± 0.006 | 2.73 ± 0.15 | 6.01 ± 0.16 | 39.6 ± 0.4 | 45.8 ± 0.5 | 7.0 ± 0.4 | 7.6 ± 0.5 | 1.020 |
Table 2.
The results of gas adsorption–desorption analysis.
| Samples | SBET m2/g) | Sext (m2/g) | Vads (cm3/g) | Smicro (m2/g) | Vmicro (cm3/g) |
|---|---|---|---|---|---|
| MCM-41 | 935 ± 18 | – | 0.716 ± 0.015 | 0 | 0 |
| ZSM-5 | 284 ± 3 | 177 ± 1 | 0.270 ± 0.006 | 107 ± 3 | 0.056 ± 0.001 |
| Al-Mil-53 | 1193 ± 25 | 328 ± 6 | 1.470 ± 0.030 | 865 ± 26 | 0.458 ± 0.003 |
Modelling o-Ps annihilation in a pore
o-Ps annihilation in a pore with any given shape, with pore volume V0 and surface are, S0, is modelled as a single unstable particle12 with mass of 2me (me is electron mass) confined in a finite spherical potential well, U(r), and radius R0. U(r) is zero for r between 0 and R0 − ΔR1 and is U0 for r between R0 − ΔR1 and R0 + ΔR. Here, r is distance from the central point of the sphere (pore), and R0 is effective pore radius defined as 3V0/S0. Due to the negative work function, o-Ps can be affected by the positive finite potential, U0 = − ΦPs21,46–48, where ΦPs is the o-Ps work function. The potential well is given as:
| 1 |
where ΔR1 is an empirical value, which is assigned as 2.4a046, the Bohr radius, a0 = 0.529 Å, and ΔR = 0.166 nm, is empirical value of the thickness of the electron layer surrounding a pore, which was introduced by the previous authors13,19–21,48 for both cases of the infinite and finite potential wells, this value is interpreted as an approximate value of the mean penetration depth of o-Ps in the bulk outside a pore. As mentioned above, o-Ps can undergo different annihilation characteristics in different regions of the pore, as illustrated in Fig. 1. When trapped in a pore with energy E ≤ − ΦPs47,48, o-Ps is scattered multiple times by the pore surface becoming thermalized to undergo annihilation either via three gammas in the pore vacuum (3γ self-annihilation) of region I (r < R0 − ΔR1) with an annihilation rate12,15, λ3γ = 0.00704 ns−1 or via pick-off annihilation in regions II (R0 − ΔR1 < r < R0) and III (R0 ≤ r < R0 + ΔR) with different rates. Those o-Ps states moved only in region I, they underwent self-annihilation (the relative contact density is considered as unit15). Those o-Ps states have not undergone self-annihilation in region I and enter regions II and III, can undergo pick-off annihilation. The pick-off annihilation rate in region II, which is caused by thermal vibration of atomics at the pore surface, is lower than that in region III, which is caused by a bulk electron. First, we consider those pores with radii exceeding ΔR1 and suppose that o-Ps is moving from the pore centre outwards (Fig. 1). Because of multiple scatterings, the initial o-Ps energy, E, therefore decreases until annihilation occurs. The average energy of o-Ps at the time of annihilation is denoted as Eav(τ)49, where τ is the mean o-Ps lifetime (see S1). The radial o-Ps wavefunction, , can be obtained by deriving the Schrödinger equation with a finite spherical potential U(r). The wavefunction fractions of the o-Ps in regions II and III are used for calculation of the pore-related o-Ps lifetime that results in a surface-volume formula representing the dependence of the pore-related o-Ps annihilation rate on the surface-to-volume ratio, S0/V0, (or effective pore radius), and temperature as follows (for the derivation, see S1 and S2 of supplementary information):
| 2 |
Figure 1.
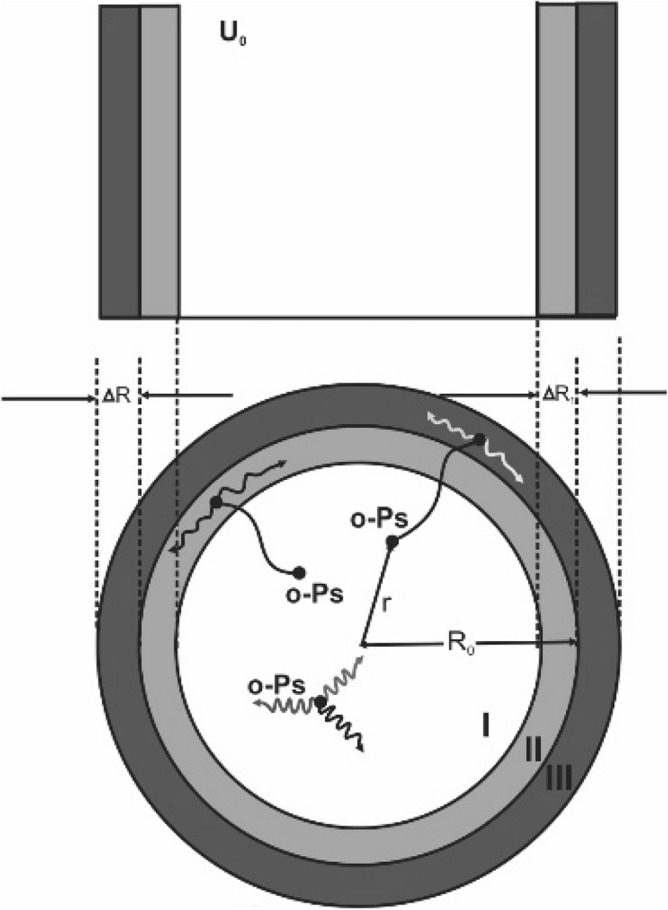
The annihilation of o-Ps in a pore (note that the electron density in region III is higher than that of region II).
At room temperature, Eq. (2) is presented in terms of the effective pore radius as follows:
| 3 |
where ϰ and q are constants. , where is the classical electron radius (nm), T is temperature (K), c is the speed of light (nm/ns), λ0 is the value of λ0(T) at room temperature (T = 298 K), and ρe0(T) is the average bulk electron density in region III at temperature T, η(T) is the ratio, ρeth(T)/ρe0(T), where ρeth(T) is the average electron density arisen by the thermal atomic vibrations at the pore surface21,33 of region II at temperature T (η0 is the value of η(T) at room temperature, T = 298 K). Moreover, . The quantity Eav(τ), which was previously introduced by Nagashima et al.49, is an exponential decay function of time. We have shown in S1 that Eav(τ) is also an exponential function of the minus ratio, − V/S. Eav(τ) = U0exp(−μV/S) + Eth, where μ is constant, and Eth ≈ (3/2)kBTps, where TPs is o-Ps temperature (see S1). Note that ρe0(T) linearly relates to the bulk density of the atoms, ρa0(T), by a factor Zeff, an effective number of electrons50, namely, ρe0(T) = Zeffρa0(T). As presented in S2, the values of four parameters, η0, ϰ, q, and μ, were semi-empirically found as follows: η0 ≈ 0.12, ϰ ≈ 0.057, q ≈ 0.03 nm, and μ ≈ 2.5 nm−1. Significantly, with given values of those parameters, the results of the SVF calculation are in good agreement with many other experimental data in the literature for pore sizes greater than ΔR1 (Tables 3, 4, 5). When the effective pore radius R0 becomes very large (in the range of the macropore), the results of the o-Ps annihilation rate calculated by SVF and by other models12–20 closely approach 0.00704 ns-1 because the fraction of the 3γ-intrinsic annihilation becomes dominantly and the fraction of the pick-off annihilation rate becomes very small. Therefore, for macropores, the difference in the o-Ps lifetimes related to the different pore sizes becomes difficult to significantly distinguish due to the overlaps in statistical deviations (Table 5). The SVF has been shown to be suitable for pores with different geometries and topologies. For those pores with effective radii smaller than ΔR1, the o-Ps annihilation rate is approximately λ0 (see S2). Note that the effective pore radius may differ from the geometrical radius. For example, for infinite cylindrical pores, the geometrical radius is two-thirds of the effective radius; however, for spherical pores, the geometrical radius is also the effective radius.
Table 3.
Comparison of SVF, TE, and RTE calculations and PALS results for MCM-41, ZSM-5, and Al-Mil-53.
| Sample | Geometry/topology | V/S (nm) | SVF (ns) | TE13 (ns) | RTE19,20 (ns), δRTE = 0.18 nm, a = 6 V/S (3D geometry) | Measured o-Ps lifetime (ns) |
|---|---|---|---|---|---|---|
| MCM-41 | Channel | 0.765 | 43.76 | 83.77 |
58.40 48.07 |
43.40 |
| ZSM-5 | mfi topology | 0.520 |
32.94 36.90a |
44.93 |
38.20 24.25 |
35.80 |
| Al-Mil-53 | Mil-53 topology | 0.523 | 33.13 | 46.09 |
38.76 24.68 |
32.20 |
aThe result value calculated by using, λ0 = 1/τ2; data in bold italics indicate for 2D geometry of RTE calculation, a = 4 V/S.
Table 4.
Comparison of the SVF, TE and RTE calculations and experimental results of micropores, MOF, from the literature24.
Table 5.
Comparison of SVF, TE and RTE calculations and large pores experimental results from the literature14,57.
| Sample | Geometry/topology | Ref. of pore diameters, d0 (nm) | SVF (ns) | TE13 (ns) | RTE19,20 δRTE = 0.18 nm a = 2 (R + δRTE) (ns) |
Ref. of o-Ps lifetime (ns) |
|---|---|---|---|---|---|---|
| Silica gel57 | – | 4.0057 | 40.50 | 69.14 | 55.73 | 44.6557 |
| Silica gel57 | – | 6.0057 | 55.60 | 108.04 | 74.43 | 60.2057 |
| Silica gel57 | – | 10.0057 | 75.12 | 132.96 | 94.87 | 75.1957 |
| Silica57 | – | 13.2020 | 86.18 | 138.47 | 104.06 | 84.2520 |
| Zircon14 | – | 50.6014 | 121.15 | 141.97 | 131.19 | 122.7014 |
| Silica20 | – | 136.1420 | 134.40 | 142.00 | 140.47 | 137.1420 |
| Silica | – | 280.4920 | 138.50 | 142.00 | 141.87 | 138.5820 |
Discussion
Pore structure-induced o-Ps annihilation explained by the SVF
Using the SVF can explain the influences of the bulk composition, structure, pore geometry and topology, as shown by the experimental results of this work and related literature. Generally, once positronium is formed, the positron lifetime spectrum must contain the following main components of lifetimes: the shortest component related to the positron annihilation in bulk averaged with the two-gamma p-Ps annihilation lifetime, the o-Ps annihilation in bulk material, the pore- and/or defect-related o-Ps annihilation lifetime, and the defect-related positron lifetimes. The last one, if it exists, may be merged with the o-Ps lifetime in bulk material. In this work, the positron lifetime spectra of all porous samples are deconvoluted into four lifetime components, τ1, τ2, τ3, and τ4, with the corresponding relative intensities, I1, I2, I3, and I4, as presented in Table 1, respectively. The first component, τ1, is ascribed to the average value of the positron lifetime in the bulk and the para-positronium lifetime (125 ps). The second component, τ2, relates to the bulk and ΔR-layer o-Ps lifetime, averaged with other components of bulk and (or) defect positron annihilations. In this study, the pore (and/or defect)-related o-Ps lifetimes are τ3 and τ4.
The bulk annihilation rate of o-Ps depends on the atomic density and effective electron number, Zeff50,51. The o-Ps annihilation rates in the bulk, λ0, can be13,19,20 2 ns−1 or different from52–54 2 ns−1. Experimental results show that the bulk composition also influences the o-Ps lifetime22. However, generally, the value λ0 ≈ 2 ns−1 is used for the SVF calculations (in fact, the measurements and deconvolutions using PALS show that the value 1/τ2 was observed to be approximately 2 ns−1). Therefore, in some cases, both values, λ0 = 2 ns−1 and = 1/τ2, can be used for SVF calculation for reference and discussion.
The application of SVF is suitable to calculate the geometrical sizes of several cases of micropores with different geometries and topologies. Zeolites 5A and 13X each contain two micropores known as β-cages and α-cages38, which are truncated octahedrons and truncated cubic octahedrons38, respectively. The α-cages of zeolite 5A are connected through the window of the octagonal face, and those for zeolite 13 X are connected by the window of the dodecagonal face38. The o-Ps states trapped in those pores undergo annihilation with different o-Ps lifetimes, τ3 and τ4, with intensities I3 and I4, respectively. Noticeably, for the case of zeolite 5A, the side of the truncated octahedron is also the side of the truncated cubic octahedron, in which the side length of the truncated octahedron, 0.199 nm, calculated by SVF using τ3, approximates the values of the side length of the truncated cubic octahedron (0.198 nm), which is calculated using τ4. It is similar for the case of zeolite 13X. These results indicated that τ3 is related to the β-cage, and τ4 is associated with a larger α-cage. By application of the SVF, the values V/S calculated from τ3 and τ4 are convenient for calculations of pore radii and apertures of the 8-ring and 10-ring windows relevant to β-cages and α-cages. Namely, for the apertures of the 8-ring and 10-ring windows, the maximum diameters that molecules can diffuse along, estimated by using SVF, are 0.48 nm for zeolite 5A and 0.83 nm for zeolite 13X, which are reasonably in agreement with the results determined by other methods38,55. In contrast to zeolites 5A and 13X, a long lifetime (35.8 ns) was obtained for the ZSM-5 sample. The largest intensity value of I4 suggests that τ4 is associated with the predominant pore structure of ZSM-5, which must be the ZSM-5 framework. ZSM-5 is a hierarchical zeolite crystallized in an orthorhombic system with the Pnma space group35,42, and its framework contains sinusoidal channels intersected with straight channels structured by 10-member rings. The value of the pore diameter of the 10-member rings is within 0.52–0.57 nm, as estimated from τ3 (using SVF), which agrees with another report35. Therefore, the shorter lifetime component, τ3, is ascribed to the ZSM-5 microchannel. The long lifetime (35.8 ns) is attributed to the larger pores of the pore network of ZSM-5 with an effective pore radius of 1.57 nm. Similarly, for Al-Mil-53, the value of τ3 is ascribed to the micropore56 with an effective pore radius of 0.31 nm, equal effective radius of the orthorhombic pore with dimensions of 0.85 nm × 0.85 nm × 0.6 nm (diameter × diameter × height), and quite agreed with pore dimension data of the MIL-53ht (Al) micropore, as presented by Loiseau and Ferey et al.34. τ4 is associated with the effective pore radius, 1.59 nm, of the large pores of the Al-Mil-53 frame network. Note that the Mil-53 family can be synthesized in different crystal systems34,56. Using the SVF, one can calculate the o-Ps lifetimes associated with those cases of pores, and conversely, with given measured o-Ps lifetimes, one can calculate the pore size. For a pore with any shape, if the dimension of the pore is given, one can calculate the V/S ratio of that pore. Once the V/S ratio of a pore can be provided, the o-Ps lifetime associated with that pore can be calculated using SVF.
Furthermore, the SVF calculations are consistent with the experimental data obtained from both micro- and mesopores with different pore geometries and topologies, in which the SVF and TE and RTE calculations are approximately the same for the cases of micropores (Tables 3, 4, 5, and Fig. 2). For example, all SVF, TE and RTE models can appropriately predict the pore-related o-Ps lifetimes for micropores of metal–organic-frameworks with pcu topology, such as24 MOF-5, MOF-8, and MOF-20 (Table 4). However, the TE model fails for pores with radii larger than 1 nm. For many cases, as presented in Tables 3 and 5, the RTE calculations are not consistent with measured data for pores with diameters greater than 4 nm. The SVF calculations are in good agreement with the data of both micropores and mesopores (Tables 3, 4, 5). For macropores, the calculations of all models, SVF, TE, and RTE, closely approach 142 ns.
Figure 2.
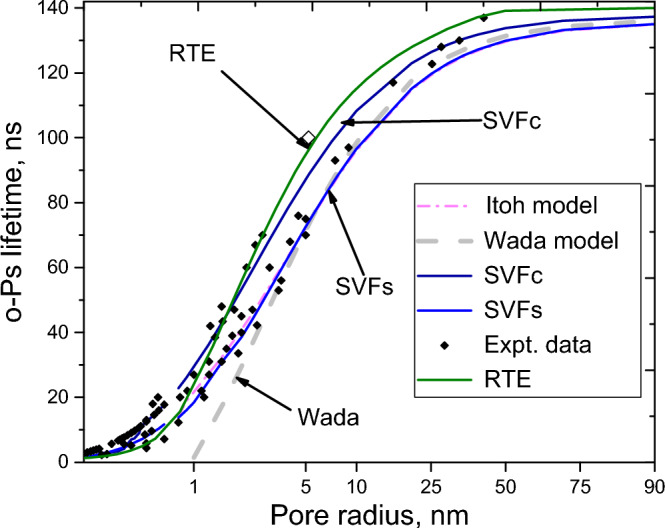
Comparison of the SVF and other models.
To visualize the comparison between the SVF and other models, we present in Fig. 2 the simulations of the RTE, Itoh, Wada, and the SVF models (SVF simulation includes SVFc and SVFs) plotted against the (geometrical) pore radius. Here, SVFc is the simulation of the SVF for infinite cylindrical pores, and SVFs is the simulation of the SVF for spherical pores, along with the experimental data, including the data from the literature14,20,54 and data of this work. For spherical pores, the geometrical radius is the same as the effective pore radius, and for infinite cylindrical pores, the geometrical radius (aperture) is approximately two-thirds of the effective pore radius. Because the pore shapes are not clarified in the set of the experimental data of the literature14,20,54, they may be the spherical, cylindrical, or other shapes. Therefore, we present the simulation for two typical pores: spherical and cylindrical shapes. Note that, based on the dependence of the o-Ps annihilation rate on the the S/V ratio, the SVF model can be used to simulate different pore shapes. In contrast, the Itoh and Wada models mainly consider spherical pores. Figure 2 indicates that SVFc (royal solid line) matches some experimental data, which are suggested to be associated with the cylindrical pores, while SVFs (blue solid line) matches some experimental data, which are suggested to be associated with spherical pores. The Itoh model is applicable to only pore radii larger than 0.8 nm. For pore radii larger than 0.8 nm, the simulation line of the Itoh model (red dashed dot line) almost coincides with the SVFs line. The Wada model is also applicable to only the cases of pore radii larger than 0.96 nm. For pores with radii larger than 2.5 nm, it is found that the Wada simulation (grey dashed line) almost merges with the SVFs and Itoh lines. For pore radii less than 2.5 nm, the Wada line significantly deflects from the experimental data. The RTE simulation (olive solid line), plotted against the values of modelling parameter, a/2 – δRTE, which is interpreted by Gidley et al.19 and Dull et al.20 as pore radius.
Note that in Table 3, the RTE parameters, a (= b = c) = 6 V/S, are obtained from the relation, l = 4 V/S = (2/3)a19,20, the SVF and TE models use the effective pore radius equal 3 V/S for the calculations. In Table 4, the SVF and TE calculations also use the effective pore radius, R0, calculated from the infinite cubic rectangles (rectangular prism), while the RTE calculation use parameters, a, b, c, which are determined from the relation, a = b = c = 2(R0 + δRTE)19,20, where δRTE = 0.18 nm, is the RTE constant (note that if one uses the value of the side length as the RTE parameter or uses values, a (= b = c) = 6 V/S, or a (= b = c) = 4 V/S the calculated o-Ps lifetimes using the RTE model for these cases are much less than the measured values). In Table 5, the SVF and TE models use the pore radius, d0/2 (d0 is the pore diameter), for the calculations, the RTE model applies the parameters, a = b = c = d0 + 2 δRTE19,20.
It is shown in Fig. 2 that, in the range of micropores with radii smaller than 1 nm, the SFV, TE and RTE calculation results are approximately the same and are agreed with experimental results. For larger pores, the RTE simulation (in 3D geometry) significantly differs from the simulations of SVFs, Itoh, Wada, and many cases of the experimental data of literature, but keeps closely the SVFc simulation (cylindrical simulation) and some other experimental results. As seen in Tables 3 and 5, there are the agreements between some results of the RTE calculation results for micropores, such as, MOF-5, MOF-20, MOF-8, ZSM-5 and Al-Mil-53, with the experimental results. However, for many cases of mesopores as shown in Tables 3, 4, 5, there are discrepancies between the RTE calculation results and experimental results. This inconsistency can be explained by that the modelling parameter of RTE model, a, in the relation with the pore radius, a = 2(R + δRTE), and that in the relation with the mean free path, a = (3/2)l = 6 V/S for 3D geometry20, or a = 4 V/S for 2D geometry20, appears not to be consistent for different cases of pore sizes and shapes (see the explanation in S3).
Temperature dependence of the o-Ps annihilation lifetime
As reported, the o-Ps lifetime depends on the temperature19–21. However, this dependence has not been fully explained for a wide range of 273–700 K by any single formula12–21. For example, the RTE19,20 and Goworek17 models are only appropriate for high temperatures (T ≥ 273 K), while the Dutta et al. formula21 is suitable only for low temperatures (T ≤ 273 K), as shown in Fig. 3, in which the solid lines (l is the o-Ps mean free path, l = 4 V/S19) are simulated for the temperature dependence of the o-Ps lifetime using the RTE formula19,20, and the dashed-dotted lines are the simulation of the Dutta et al.21 formula. Using the SVF enables us to explain this fact (see more details in S3). First, considering the high temperature range (273–700 K), it is rational to assume that the averaged electron density in region II, ρeth(T), linearly relates to the bulk electron density and to the mean square amplitude of the normal component of the thermal atomic vibrations33 at the pore surface, :
| 4 |
where c1 is the proportionality coefficient. As shown by previuos research33, in the range of high temperatures, the mean square amplitude is approximately proportional to kBT (T is the temperature in Kelvin, and kB is Boltzmann’s constant). For convenience of presentation, is denoted as the expression of the mean square amplitude of the normal component of thermal atomic vibrations at the pore surface for high temperatures (T ≥ 273 K). The following can be written:
| 5 |
where c2 is a proportionality factor and is defined as the mean square amplitude at low temperature T, for which kBT ≈ 033. Thus:
| 6 |
Figure 3.
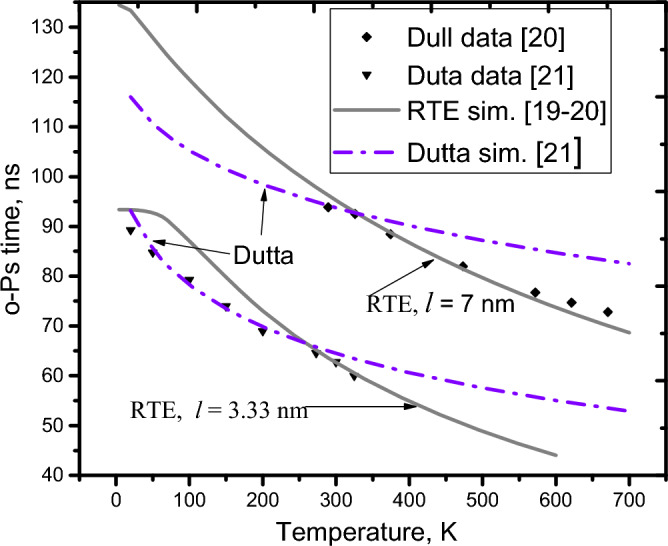
The characteristics of the o-Ps annihilation in the high temperature range (T > 273 K) appear to be different from those in the low temperature range (T < 273 K).
η1(T) is denoted as the expression of η(T) for the high temperature range, T ≥ 273. Equation (6) becomes:
| 7 |
where c1 and c2 are proportionality coefficients. The values of and u0 = are assigned as 0.00305 Å2 and 0.018 Å2, respectively (based on the experiences of the theoretical calculation33 and experiment58 for the case of SiO2). With given values of η0, u0, and , the values of c1 and c2 are therefore inferred (c1 ≈ 6.667 Å−2 and c2 = 0.582 Å2 eV−1). The expression of the SVF in using η1(T) is symbolized as SVF1. The SVF1 simulation (black solid line), as plotted in Fig. 4, shows agreement with the experimental data (♦ symbol) of the o-Ps lifetimes measured for high-temperature measurements19,20. The SVF1 simulation also agreed with the RTE simulation19,20 (short-dash lines) in this high temperature range. However, the SVF1 and RTE simulation results are not in line with the data obtained from the low-temperature measurements21 (20–273 K). This indicates that in the low temperature range, the expression of u1 is no longer appropriate. To solve this problem, at low temperature (T ≤ 273), the mean square amplitude of the normal component of thermal atomic vibrations at the pore surface, u2 ≡ , is proposed to be approximately (see Fig. S2):
| 8 |
Figure 4.
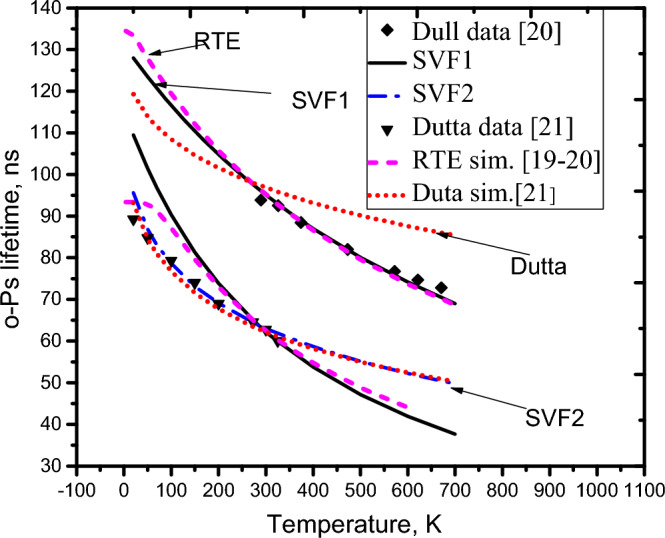
SVF1 simulation is consistent with the data of high-temperature (T ≥ 273 K) of the o-Ps lifetime, whereas SVF2 simulation is consistent with that of low-temperature (T ≤ 273 K).
The expression of η(T) in the low temperature range, denoted as η2(T), can be written as:
| 9 |
where b = 0.089 Å2(eV)−1/2, the proportionality coefficient that is estimated from the condition ). The simulation results of SVF2 (SVF2 is the expression of the SVF in using η2(T)), as plotted in Fig. 4 (blue dashed-dotted lines), agree with the low-temperature data of Dutta et al.21 (▼ symbol). The SVF2 is also consistent with the Dutta et al.21 simulation (short-dotted line). Generally, for the expression un = , the dependence of the mean square amplitude of the normal component of thermal atomic vibrations at the pore surface on a wide temperature range of 20–700 K can be well approximated by a polynomial of (kBT)1/2 variables, in which the 3rd-order approximation of un(T) is as follows:
| 10 |
The values of the coefficients, a0 ≈ 0.00324 Å2, a1 ≈ 0.113 Å2(eV)−1/2, a2 ≈ − 0.561 Å2(eV)−1, and a3 ≈ 2.80 Å2(eV)−3/2, are easily given by fitting the right-hand side of Eq. (10) into u1 and u2 (see S3). The temperature simulations of the SVF using un, as plotted in Figs. 5 and Fig. 6, show agreement with both the high- and low-temperature data from the literature17–21. It is shown that the SVF can fully explain the dependence of o-Ps annihilation over a wide temperature range of 20–700 K, in which the calculation of the SVF (solid line) agrees with that of RTE19,20 (Dashed line) and Goworek et al.17 (Dash-dotted line) for temperatures greater than or equal to 273 K, while it is consistent with the Dutta et al.21 simulation for temperatures less than or equal to 273 K. It is noted that in the calculation of the o-Ps annihilation lifetimes using SVF presented above, the o-Ps temperature, TPs, is approximately considered to be the sample temperature, T.
Figure 5.
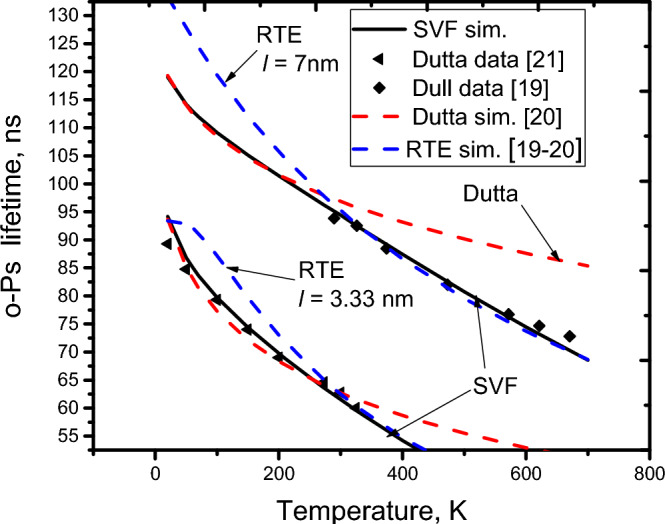
Comparisons of the o-Ps lifetimes calculated by SVF, RTE, and Dutta et al.21 with experimental data19,21.
Figure 6.
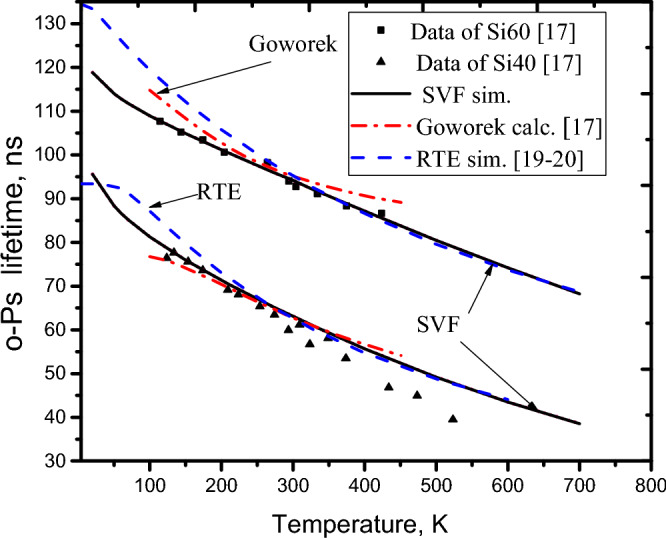
Comparison of the o-Ps lifetimes calculated by SVF and RTE, and Goworek et al.17 models with the experimental data17.
Method
We performed both PALS and nitrogen adsorption measurements for MOF Al-Mil-53 (Nanochemazone), hierarchical zeolite ZSM-5 (ACS Materials, Si/Al = 38), and mesoporous MCM-41 (Sigma Aldrich). For the PALS measurement, powder samples with micron-sized particles were pressed into pellets at a pressure of approximately 1.5 GPa and heated for 10 h under vacuum at 100 °C. The PALS measurements were performed at room temperature (298 K) using an ORTEC fast–fast gamma coincidence spectrometer at the Center for Nuclear Techniques in Ho Chi Minh City with a lifetime resolution of 210 ps and with a Na-22 source of 30 μCi. The measurements were carried out under vacuum conditions at approximately 0.8 × 10⁻⁴ torr. Each obtained spectrum of positron lifetimes was accumulated to be 1 × 10⁶–4 × 10⁶ counts. PALS spectra of samples were deconvoluted using PALSfit45 into four components, τ1, τ2, τ3, and τ4, with corresponding intensities, I1, I2, I3, and I4, respectively. The results are presented in Table 1. The specific surface area and pore volume of Al-Mil-53, ZSM-5 and MCM-41 were analysed using nitrogen isotherm adsorption9,44. The samples were heated for 5 h at 300 °C, and the adsorption measurements were conducted at 77 K using Micromeritics, Model 3Flex, version 3.02 (Hanoi National University of Education) and were analysed by using Brunauer-Emmett-Tel (BET)9 and t-plot analyses44; the results are given in Table 2.
Conclusion
In summary, to investigate the o-Ps annihilation characteristics of nanoporous materials with different pore sizes, shapes, and topologies, in this work, we present both PALS and isotherm nitrogen adsorption measurements for different porous materials and an approach using a finite potential well for o-Ps annihilation in a pore. This results in the formula SVF that provides the calculation of the o-Ps annihilation rate that depends on the surface-to-volume ratio and temperature. The SVF calculation result is shown to agree with the experimental results of the positronium annihilation lifetimes obtained from the experiment of this work and from other data from the literature of both micro- and mesopores with different geometries and topologies. Using the SVF, we calculated the effective and geometrical sizes of microporous materials, 5A, 13X, ZSM-5, and Al-Mil-53, which are in good agreement with the results determined by other authors and methods. The experimental data of the temperature dependences of the pore-related o-Ps lifetime in a wide range of temperatures from 20 to 700 K are fully explained by the SVF. SVF can be applied for the pores formed in different shapes with the provision of the pore dimensions.
Supplementary Information
Acknowledgements
This research is funded by the Research and Development Center for Advanced Technology, and partly by Vingroup Big Data Insitute (VINBIGDATA), Vingroup, and partly by Vingroup Innovator Foundation (VINIF), under project code VINIF. 2020.DA08. We thank Dr. Nguyen Manh Nghia at Hanoi National University of Education, Dr. Luu Anh Tuyen at the Center for Nuclear Techniques in Ho Chi Minh City for their measurements of nitrogen adsorption and PALS, and Dr. Bui Van Dong, VNU University for his assistance in making the figures.
Author contributions
N.T.T. and N.D.T. proposed the model for o-Ps in a pore, designed experiment, reviewed results and wrote the manuscript, and N.T.D., N.Q.H., and T.D.T. took part in the calculations, data processing, group discussion and approval of the final manuscript.
Data availability
The datasets used and/or analysed during the current study are available from the corresponding author on reasonable request.
Competing interests
The authors declare no competing interests.
Footnotes
Publisher's note
Springer Nature remains neutral with regard to jurisdictional claims in published maps and institutional affiliations.
Contributor Information
Nguyen Thanh Trung, Email: trungnt@iop.vast.vn.
Nguyen Duc Thanh, Email: nducthanh@gmail.com.
Supplementary Information
The online version contains supplementary material available at 10.1038/s41598-023-40901-3.
References
- 1.Amirilargani M, Merlet RB, Hedayati P, Nijmeijer A, Winnubst L, Smet CPM, Sudhölter EJR. MIL-53(Al) and NH2-MIL-53(Al) modified α-alumina membranes for efficient adsorption of dyes from organic solvents. Chem. Commun. 2019;55:4119–4122. doi: 10.1039/c9cc01624d. [DOI] [PubMed] [Google Scholar]
- 2.Mitchell S, Pinar AB, Kenvin J, Crivelli P, Kärger J, Pėrez-Ramírez J. Structural analysis of hierarchically organized zeolites. Nat. Commun. 2015;6:8633. doi: 10.1038/ncomms9633. [DOI] [PMC free article] [PubMed] [Google Scholar]
- 3.Zou D, Liu D, Zhang J. From zeolitic imidazolate framework-8 to metal-organic frameworks (MOFs): Representative substance for the general study of pioneering MOF applications. Energy Environ. Mater. 2018;1:209–220. [Google Scholar]
- 4.Tap TD, Sawada HS, Katsumur Y, Maekawa Y. Poly(ethylene-co-tetrafluoroethylene) (ETFE)-based graft-type polymer electrolyte membranes with different ion exchange capacities: Relative humidity dependence for fuel cell applications. J. Membr. Sci. 2013;447:19. [Google Scholar]
- 5.Babarao R, Sheng Dai S, Jiang D. Effect of pore topology and accessibility on gas adsorption capacity in zeolitic imidazolate frameworks: Bringing molecular simulation close to experiment. J. Phys. Chem. C. 2011;115:8126–8135. [Google Scholar]
- 6.Liu X, Shi J, Yang G, Zhou J, Wang C, Teng J, Wang Y, Xie Z. A diffusion anisotropy descriptor links morphology effects of H-ZSM-5 zeolites to their catalytic cracking performance. Commun. Chem. 2021;4:107. doi: 10.1038/s42004-021-00543-w. [DOI] [PMC free article] [PubMed] [Google Scholar]
- 7.Li C, Zhao B, Zhou B, Qi N, Chen Z, Zhou W. Effect of electrical conductivity on the formation and annihilation of positronium in porous materials. Phys. Chem. Chem. Phys. 2017;9:7659–7667. doi: 10.1039/c6cp07483a. [DOI] [PubMed] [Google Scholar]
- 8.Ojkic N, Serbanescu D, Banerjee S. Surface-to-volume scaling and aspect ratio preservation in rod-shaped bacteria. Elife. 2019;8:e47033. doi: 10.7554/eLife.47033. [DOI] [PMC free article] [PubMed] [Google Scholar]
- 9.Thommes M, Kaneko K, Neimark AV, Olivier JP, Rodriguez-Reinoso F, Rouquerol J, Sing KSW. Physisorption of gases, with special reference to the evaluation of surface area and pore size distribution (IUPAC Technical Report) UIPAC Tech. Rep. Pure Appl. Chem. 2015;87:1051–1069. [Google Scholar]
- 10.Stassin T, Verbeke R, Cruz AJ, Rodríguez-Hermida S, Stassen I, Marreiros J, Krishtab M, Egger MDW, Vankelecom IFJ, Furukawa S, Vos DD, Grosso D, Thommes M, Ameloo R. Porosimetry for thin films of metal-organic frameworks: A comparison of positron annihilation lifetime spectroscopy and adsorption-based methods. Adv. Mater. 2021;33:2006993. doi: 10.1002/adma.202006993. [DOI] [PubMed] [Google Scholar]
- 11.Ravikovitch PI, Haller GL, Neimark AV. Density functional theory model for calculating pore size distributions: Pore structure of nanoporous. Adv. Colloid Interface Sci. 1998;76–77:203–226. [Google Scholar]
- 12.Tao SJ. Positronium annihilation in molecular substances. J. Chem Phys. 1972;56:5499–5510. [Google Scholar]
- 13.Eldrup M, Lightbody D, Sherwood JN. The temperature dependence of positron lifetimes in pivalic acid. Chem. Phys. 1981;63:51–58. [Google Scholar]
- 14.Ito K, Nakanishi H, Ujihira Y. Extension of the equation for the annihilation lifetime of ortho-positronium at a cavity larger than 1 nm in radius. J. Phys. Chem. B. 1999;103:4555–4558. [Google Scholar]
- 15.Wada K, Hyodo T. A simple shape-free model for pore-size estimation with positron annihilation lifetime spectroscopy. J. Phys. Conf. Ser. 2013;443:012003. [Google Scholar]
- 16.Consolati G, Mariani M, Millini R, Quasso F. Investigation on the porosity of zeolite NU-88 by means of positron annihilation lifetime spectroscopy. Nucl. Instrum. Methods. Phys. Res. B. 2009;267:2550–2553. [Google Scholar]
- 17.Goworek T, Ciesielski K, Jasinska B, Wawryszczuk J. Positronium states in the pores of silica gel. Chem. Phys. 1998;230:305–314. [Google Scholar]
- 18.Ciesielski K, Dawidowicz AL, Goworek T, Jasinska B, Wawryszczuk J. Positronium lifetimes in porous Vycor glass. Chem. Phys. Lett. 1998;289:41–45. [Google Scholar]
- 19.Gidley DW, Frieze WE, Dull TL, Yee AF, Ryan ET, Ho HM. Positronium annihilation in mesoporous thin films. Phys. Rev. B. 1999;60:R5157–R1560. [Google Scholar]
- 20.Dull L, Frieze WE, Gidley DW. Determination of pore size in mesoporous thin films from the annihilation lifetime of positronium. J. Phys. Chem. B. 2001;105:4657–4662. [Google Scholar]
- 21.Dutta D, Ganguly B, Chatterjee B, Mukherjee T. Effect of temperature on positronium annihilation in silica gel. J. Phys. Chem. B. 2005;109:10092–10095. doi: 10.1021/jp050380g. [DOI] [PubMed] [Google Scholar]
- 22.He C, Oka T, Kobayashi Y, Oshima N, Ohdaira T, Kinomura A, Suzuki R. Positronium annihilation and pore surface chemistry in mesoporous silica films. Appl. Phys Lett. 2007;91:024102. [Google Scholar]
- 23.Zubiaga A, Warringham R, Mitchell S, Gerchow L, Cooke D, Crivelli P, PérezRamírez J. Pore topology effects in positron annihilation spectroscopy of zeolites. ChemPhysChem. 2017;18:470–479. doi: 10.1002/cphc.201601258. [DOI] [PubMed] [Google Scholar]
- 24.Crivelli P, Cooke D, Barbiellini B, Brown BL, Feldblyum JI, Guo P, Gidley DW, Gerchow L, Matzger A. Positronium emission spectra from self-assembled metal-organic frameworks. J. Phys. Rev. B. 2014;89:241103(R). [Google Scholar]
- 25.Chen Y-Z, Gu B, Uchida T, Liu J, Liu X, Ye B-J, Xu Q, Jian H-L. Location determination of metal nanoparticles relative to a metal-organic framework. Nat. Commun. 2019;10:3462. doi: 10.1038/s41467-019-11449-6. [DOI] [PMC free article] [PubMed] [Google Scholar]
- 26.Nuruddin M, Chowdhury RA, Lopez-Perez N, Montes FJ, Youngblood JP, Howarter JA. Influence of free volume determined by positron annihilation lifetime spectroscopy (PALS) on gas permeability of cellulose nanocrystal films. Appl. Mater. Interfaces. 2020;12:24380–24389. doi: 10.1021/acsami.0c05738. [DOI] [PubMed] [Google Scholar]
- 27.Garcia-Valenzuela A, Butterling M, Liedke MO, Hirschmann E, Trinh TT, Attallah AG, Wagner A, Alvarez R, Rostra JG, Rico V, Palmero A, Gonzalez-Elipe AR. Positron annihilation analysis of nanopores and growth mechanism of oblique angle evaporated TiO2 and SiO2 thin films and multilayers. Microporous Mesoporous Mater. 2020;295:109968. [Google Scholar]
- 28.Bosnar S, Vrankić M, Bosnar D, Ren N, Šarić A. Positron annihilation lifetime spectroscopy (PALS) study of the as prepared and calcined MFI zeolites. J. Phys. Chem. Solids. 2017;110:227–333. [Google Scholar]
- 29.Zhu B, Doherty CM, Hu X, Hill A, Zou L, Lin YS, Duke M. Designing hierarchical porous features of ZSM-5 zeolites via Si/Al ratio and their dynamic behavior in seawater ion complexes. Microporous Mesoporous Mater. 2013;173:78–85. [Google Scholar]
- 30.Li Y, Liu J, Kong J, Qi N, Chen Z. Role of ultramicropores in the remarkable gas storage in hypercrosslinked polystyrene networks studied by positron annihilation. Phys. Chem. Chem. Phys. 2021;23:13603–13611. doi: 10.1039/d1cp01867a. [DOI] [PubMed] [Google Scholar]
- 31.Zhou B, Qi N, Wang B, Chen ZQ. Effect of swelling agent on the pore structure of SBA-15 studied by positron annihilation. Appl. Surf. Sci. 2019;475:961–968. [Google Scholar]
- 32.Milina M, Mitchell S, Crivelli P, Cooke D, Perez-Ramırez J. Mesopore quality determines the lifetime of hierarchically structured zeolite catalysts. Nat. Commun. 2014;5:3922. [Google Scholar]
- 33.Alerhand OI, Joannopoulos JD, Mele EJ. Thermal amplitudes of surface atoms on Si(111)2 × 1 and Si(001) 2 × 1. Phys. Rev. B. 1989;39:12622. doi: 10.1103/physrevb.39.12622. [DOI] [PubMed] [Google Scholar]
- 34.Loiseau T, Serre C, Huguenard C, Fink G, Taulelle F, Henry M, Bataille T, Férey G. A rationale for the large breathing of the porous aluminum terephthalate (MIL-53) upon hydration. Chem. Eur. J. 2004;10:1373–1382. doi: 10.1002/chem.200305413. [DOI] [PubMed] [Google Scholar]
- 35.Kokotailo GT, Lawton SW, Olson DH, Meter WM. Structure of synthetic zeolite ZSM-5. Nature. 1978;272:437–438. [Google Scholar]
- 36.Costa JAS, Jesus RA, Santos DO, Mano JF. Recent progresses in the adsorption of organic, inorganic, and gas compounds by MCM-41-based mesoporous materials. Microporous Mesoporous Mater. 2020;291:109698. [Google Scholar]
- 37.Song Z, Huang Y, Xu WL, Wang L, Bao Y, Li S, Yu M. Continuously adjustable, molecular-sieving “Gate” on 5A zeolite for distinguishing small organic molecules by size. Sci. Rep. 2015;5:13981. doi: 10.1038/srep13981. [DOI] [PMC free article] [PubMed] [Google Scholar]
- 38.Perkal MB, Walters WB. Positron annihilation in synthetic zeolites 4A and 13X. J. Appl. Phys. 2005;98:033509. [Google Scholar]
- 39.Collins F, Rozhkovskaya A, Outram AG, Outram JG, Millar GJ. A critical review of waste resources, synthesis, and applications for zeolite LTA. Microporous Mesoporous Mater. 2019;291:109667. [Google Scholar]
- 40.Dou R, Zhang J, Chen Y, Feng S. High efficiency removal of triclosan by structure-directing agent modified mesoporous MIL-53(Al) Environ. Sci. Pollut. Res. 2017;24:8778–8789. doi: 10.1007/s11356-017-8583-7. [DOI] [PubMed] [Google Scholar]
- 41.Niculescu VC. Mesoporous silica nanoparticles for bio-applications. Front. Mater. 2020;7:36. [Google Scholar]
- 42.Losch P, Pinar AB, Willinger MG, Soukup K, Chavan S, Vincent B, Pale P, Louis B. H-ZSM-5 zeolite model crystals: Structure-diffusion-activity relationship in methanol-to-olefins catalysis. J. Catal. 2017;345:11–23. [Google Scholar]
- 43.Che Q, Yi W, Liu Y, Wang X, Yang H, Chen H. Effect of mesopores in ZSM-5 on the catalytic conversion of acetic acid, furfural, and guaiacol. Energy Fuels. 2021;35:6022–6029. [Google Scholar]
- 44.de Boer JH, Lippens BC, Linsen BG, Broekhoff JCP, van den Heuvel A, Osinga ThJ. The t-curve of multimolecular N2-adsorption. J. Colloid Interf. Sci. 1966;21:405–414. [Google Scholar]
- 45.Kirkegaard P, Olsen JV, Eldrup MM. PALSfit3, A Software Package for Analyzing Positron Lifetime Spectra. Technical University of Denmark; 2017. [Google Scholar]
- 46.Puska J, Nieminen RM. Theory of positrons in solids and on solid surfaces. Rev. Mod. Phys. 1994;66:841. [Google Scholar]
- 47.Nagashima Y, Morinaka Y, Kurihara T, Nagai Y, Hyodo T, Shidara T, Nakahara K. Origins of positronium emitted from SiO2. Phys. Rev. B. 1998;58:12676. [Google Scholar]
- 48.Tanzi GM, Castelli F, Consolati G. Positronium confinement in small cavities: A two-particle model for the lowering of contact density. Phys. Rev. Lett. 2016;116:033401. doi: 10.1103/PhysRevLett.116.033401. [DOI] [PubMed] [Google Scholar]
- 49.Nagashima Y, Kakimoto M, Hyodo T, Fujiwara K, Ichimura A, Chang T, Deng J, Suzuki K, McKee BTA, Stewart AT. Thermalization of free positronium atoms by collisions with silica-powder grains, aerogel grains, and gas molecules. Phys. Rev. A. 1995;52:258. doi: 10.1103/physreva.52.258. [DOI] [PubMed] [Google Scholar]
- 50.Charlton M, Humberston JM. Positron Physics. Cambridge University Press; 2000. [Google Scholar]
- 51.Dupasquier A, De Natale P, Rolando A. Formal calculation of the pick-off annihilation rate for ortho- and parapositronium. Phys. Rev. B. 1991;43:10036. doi: 10.1103/physrevb.43.10036. [DOI] [PubMed] [Google Scholar]
- 52.Dannefaer S, Friessnegg T, Kerr D, Uedono A, Li X, Tanigawa S. Annihilation of positronium in a-SiO2 investigated by combined angular correlation and lifetime measurements. Phys. Rev. B. 1996;54:15051. doi: 10.1103/physrevb.54.15051. [DOI] [PubMed] [Google Scholar]
- 53.Govorek T. Positronium as a probe of small free volumes. J. Nucl. Radiochem. Sci. 2000;1(1):11–13. [Google Scholar]
- 54.Sharder DM. Compounds of positrons and positronium. In: Jean JC, Mallon PE, Sharder DM, editors. Chapter 2 of book: Principles and Applications of Positron & Positronium Chemistry. World Scientific Publishing Co. Pte. Ltd.; 2003. [Google Scholar]
- 55.He C, Krishna R, Chen Y, Yang J, Li J, Li L. Ultrafine tuning of the pore size in zeolite A for efficient propyne removal from propylene Chin. J. Chem. Eng. 2021;37:217–221. [Google Scholar]
- 56.Stassin S, Waitschat S, Heidenreich N, Reinsch H, Pluschkell F, Kravchenko D, Marreiros J, Stassen I, Dinter JV, Verbeke R, Dickmann M, Egger W, Vankelecom I, Vos DD, Ameloot R, Stock N. Aqueous flow reactor and vapour-assisted synthesis of aluminium dicarboxylate metal–organic frameworks with tuneable water sorption properties. Chem. Eur. J. 2020;26:10841–10848. doi: 10.1002/chem.202001661. [DOI] [PMC free article] [PubMed] [Google Scholar]
- 57.Dutta D, Chatterjee S, Pillai KT, Pujari PK, Ganguly BN. Pore structure of silica gel: A comparative study through BET and PALS. Chem. Phys. 2005;312:319–324. [Google Scholar]
- 58.Fukaya Y, Kawasuso A, Hayashia K, Ichimiya A. Precise determination of surface Debye-temperature of Si(1 1 1)-7 × 7 surface by reflection high-energy positron diffraction. Appl. Surf. Sci. 2004;237:29. [Google Scholar]
Associated Data
This section collects any data citations, data availability statements, or supplementary materials included in this article.
Supplementary Materials
Data Availability Statement
The datasets used and/or analysed during the current study are available from the corresponding author on reasonable request.